
Price moved higher as expected, closer to the target.
Summary: The bounce is continuing higher as a double or single zigzag. The target for it to end is 2,002 or 2,004. At this stage, earliest confirmation that the bounce is over would come with a new low below 1,974.08. Next confirmation would come with a breach of the channel on the hourly chart. Reasonable confidence may be had finally with a new low below 1,931.81.
To see how each of the bull and bear wave counts fit within a larger time frame see the Grand Supercycle Analysis.
To see detail of the bull market from 2009 to the all time high on weekly charts, click here.
Last published monthly charts can be seen here.
If I was asked to pick a winner (which I am reluctant to do) I would say the bear wave count has a higher probability. It is better supported by regular technical analysis at the monthly chart level, it fits the Grand Supercycle analysis better, and it has overall the “right look”.
New updates to this analysis are in bold.
BULL ELLIOTT WAVE COUNT
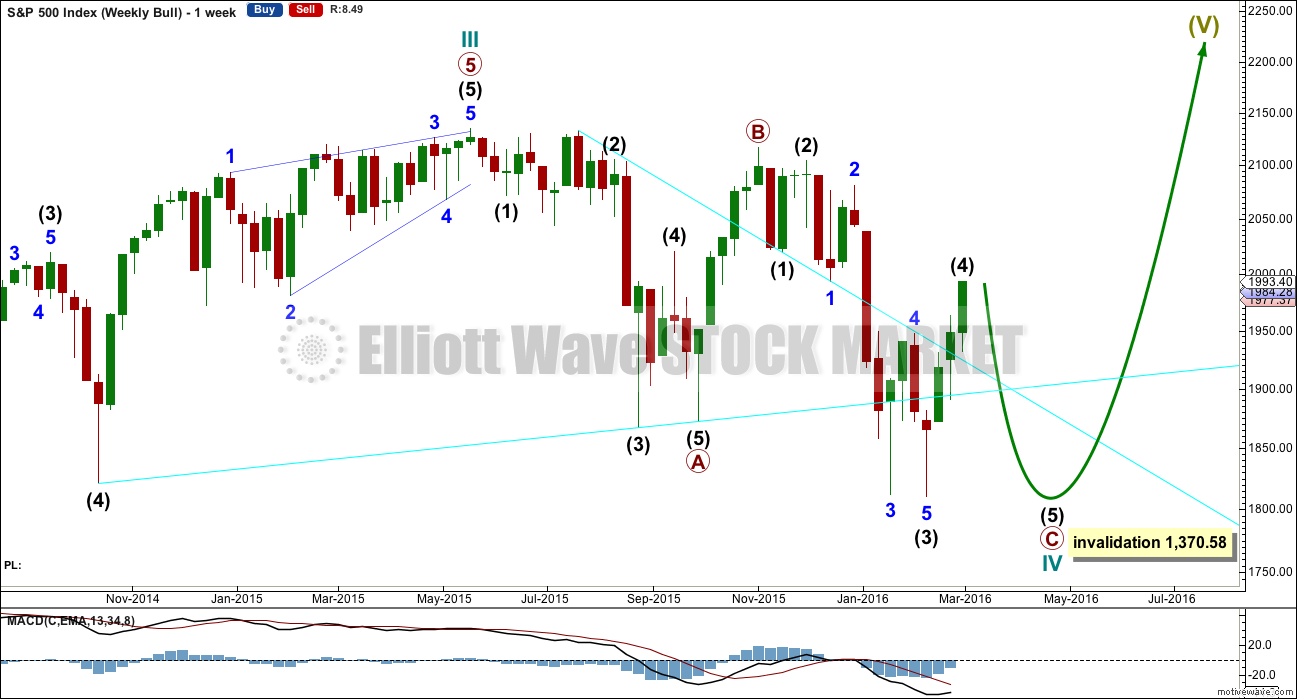
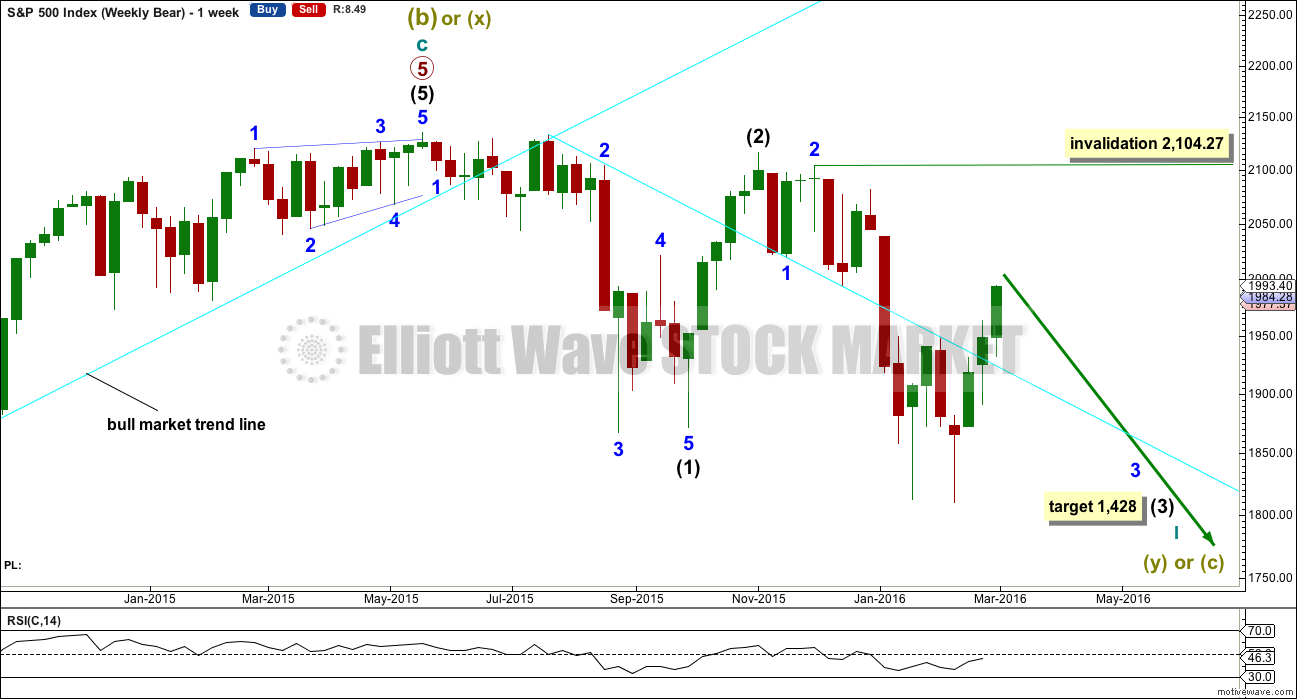
WEEKLY CHART
Click chart to enlarge.
To see all movement from the all time high without squashing the daily candlesticks up too much, it is time to publish weekly charts regularly.
This wave count is bullish at Super Cycle degree.
Cycle wave IV may not move into cycle wave I price territory below 1,370.58. If this bull wave count is invalidated by downwards movement, then the bear wave count shall be fully confirmed.
Cycle wave II was a shallow 0.41 zigzag lasting three months. Cycle wave IV should exhibit alternation in structure and maybe also alternation in depth. Cycle wave IV may be a flat, or combination. This first daily chart looks at a flat correction.
Cycle wave IV may end within the price range of the fourth wave of one lesser degree. Because of the good Fibonacci ratio for primary wave 3 and the perfect subdivisions within it, I am confident that primary wave 4 has its range from 1,730 to 1,647.
Primary wave C should subdivide as a five.
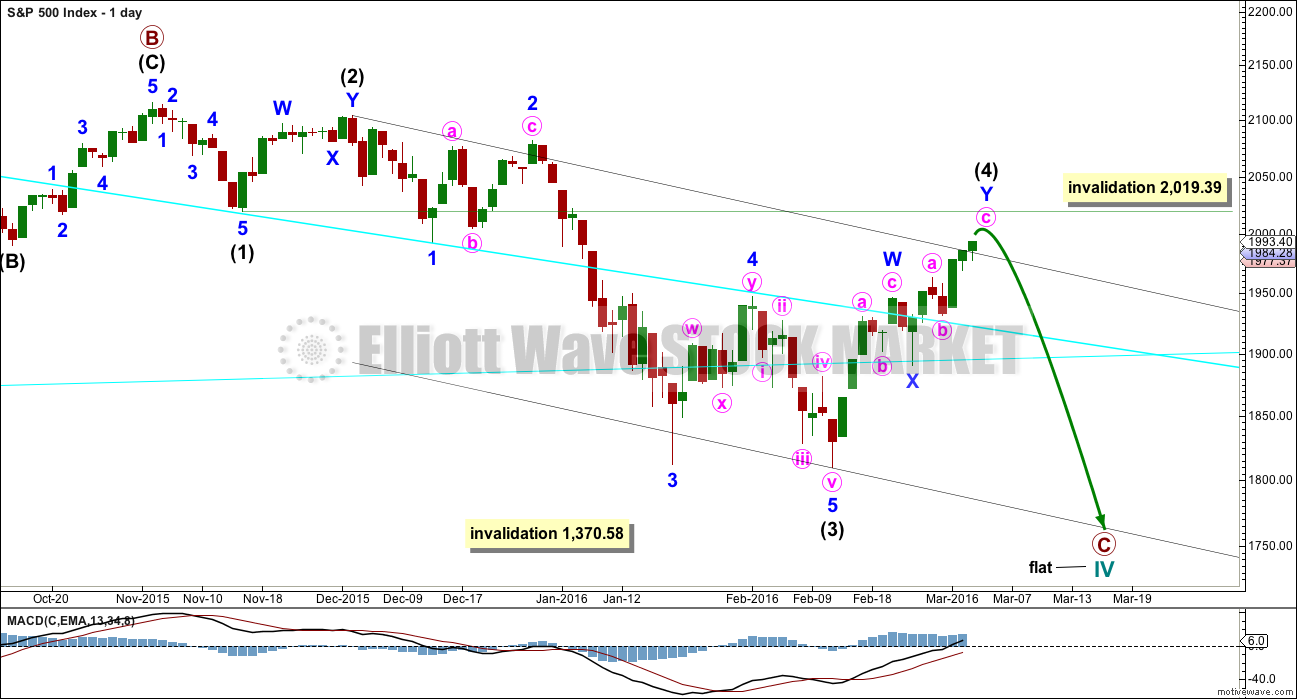
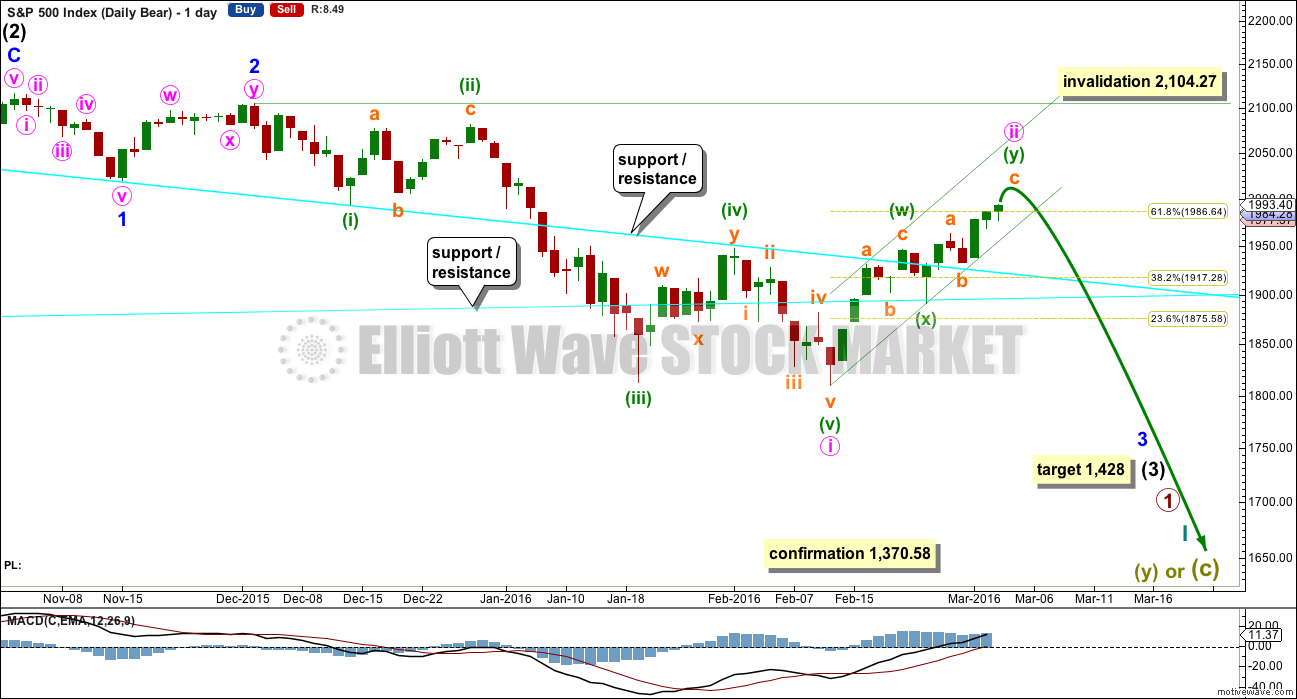
DAILY CHART – FLAT
Click chart to enlarge.
Within the new downwards wave of primary wave C, intermediate waves (1), (2) and now (3) may be complete. Intermediate wave (4) is continuing higher and may not yet be complete. Intermediate wave (2) will subdivide either as a single or double zigzag (as will intermediate wave (4) ). There is inadequate alternation between these two corrections, which reduces the probability that the current correction is a fourth wave.
When intermediate wave (4) may again be seen as complete, then a target may be calculated for intermediate wave (5) to end. It should move at least slightly below the end of intermediate wave (3) at 1,810.10 to avoid a truncation.
The idea of a flat correction for cycle wave IV has the best look for the bull wave count. The structure would be nearly complete and at the monthly level cycle wave IV would be relatively in proportion to cycle wave II.
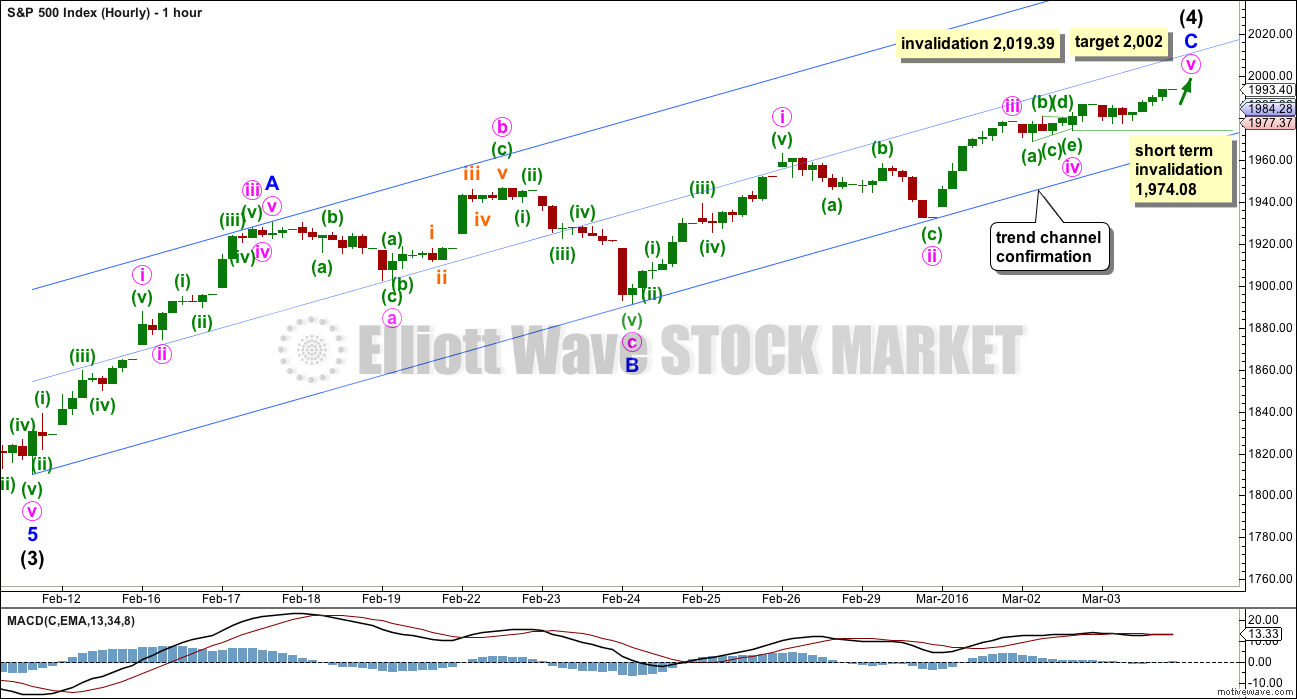
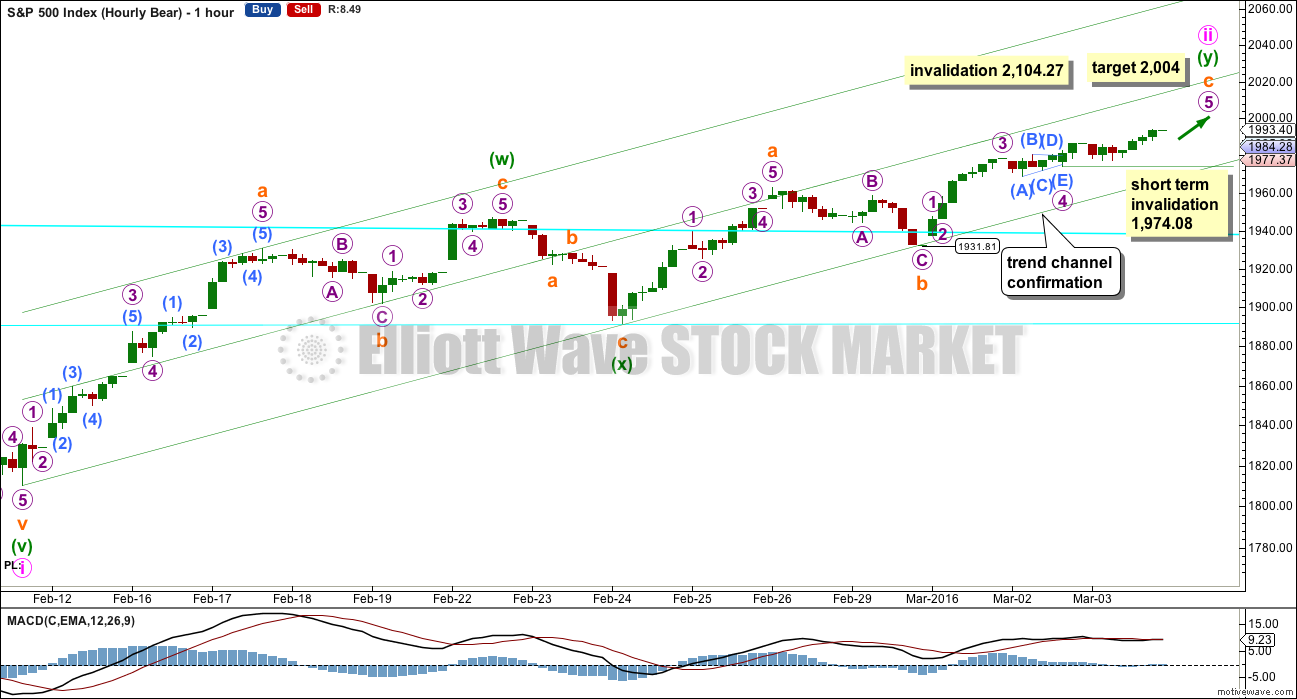
HOURLY CHART
Click chart to enlarge.
Again, there are two different ways to see this upwards movement. I will use the hourly bull and hourly bear charts to show both ways, and both ways work the same for both bull and bear wave counts (the degree of labelling is two higher for this bull wave count).
Upwards movement may be an almost complete single zigzag.
Within the zigzag, minor wave A subdivides as a five. Minor wave B subdivides as a three, an expanded flat correction.
Minor wave C is an almost complete five wave structure. Within minor wave C, minute wave ii is a zigzag and minute wave iv exhibits alternation as a triangle which fits perfectly on the five minute chart. This is a barrier triangle, which are often followed by short fifth waves.
Within minor wave C, minute wave iii is shorter than minute wave i. This limits minute wave v to no longer than equality in length with minute wave iii, so that the third wave is not the shortest and the core Elliott wave rule is met. The limit for minute wave v for this wave count would be at 2,020.62. This is above the invalidation point for the bull wave count, but not for the bear.
Within minor wave C, minute wave iii is just 2.07 points longer than 0.618 the length of minute wave i. At 2,002 minute wave v would reach 0.618 the length of minute wave iii.
On the five minute chart, today’s upwards movement resolved the overlapping within minute wave v. The structure may be complete here or very close indeed.
If minute wave iv continues further, it may not move into minute wave i price territory below 1,962.96.
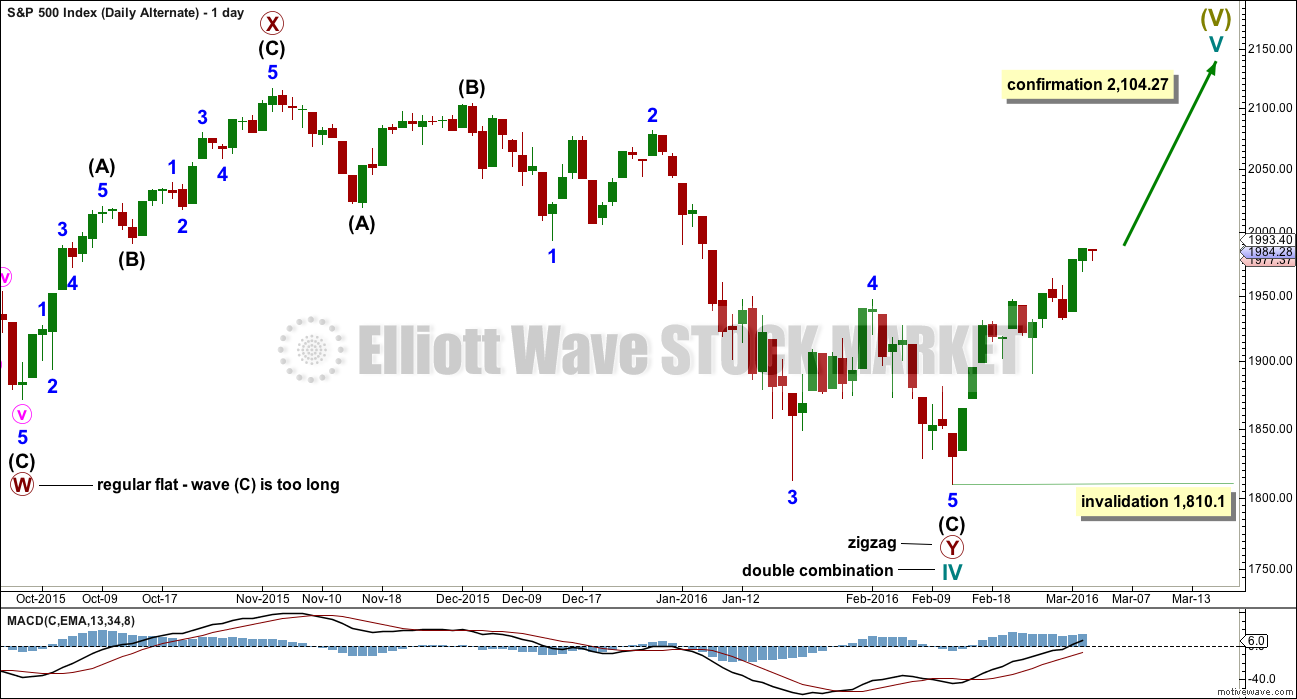
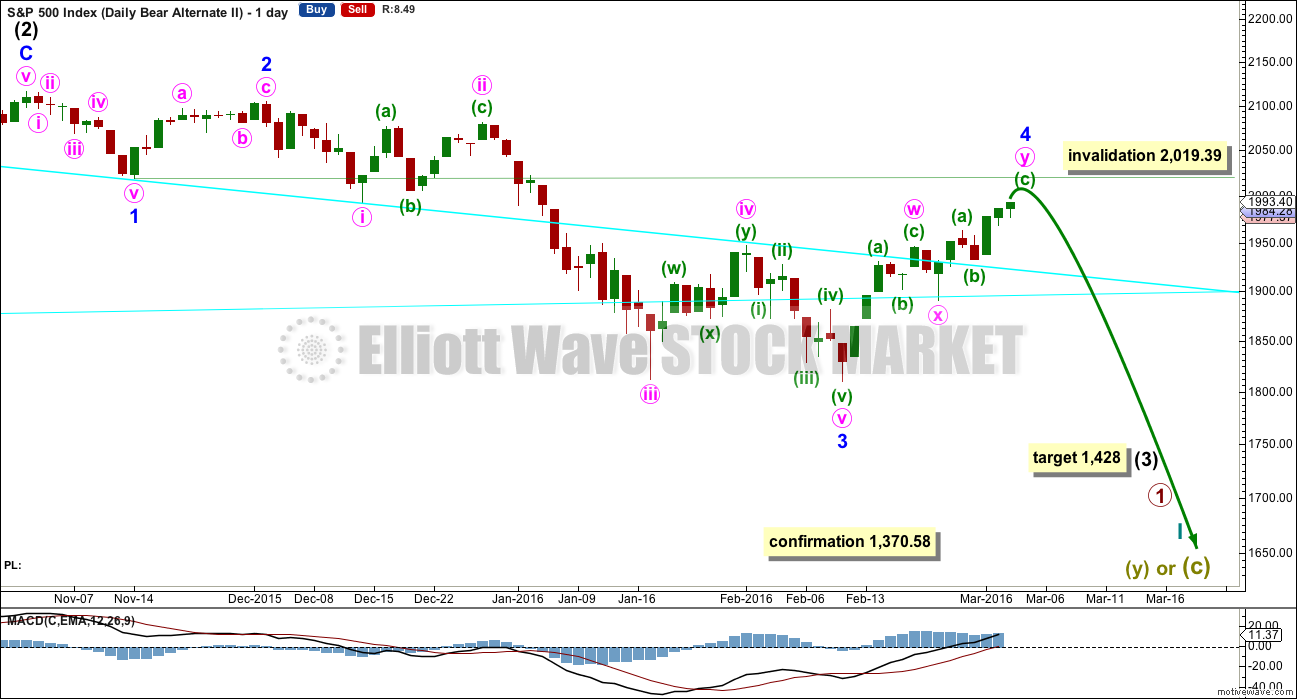
DAILY CHART – COMBINATION
Click chart to enlarge.
This idea is technically possible, but it does not have the right look. It is presented only to consider all possibilities.
If cycle wave IV is a combination, then the first structure may have been a flat correction. But within primary wave W, the type of flat is a regular flat because intermediate wave (B) is less than 105% of intermediate wave (A). Regular flats are sideways movements. Their C waves normally are about even in length with their A waves and normally end only a little beyond the end of the A wave. This possible regular flat has a C wave which ends well beyond the end of the A wave, which gives this possible flat correction a very atypical look.
If cycle wave IV is a combination, then the first structure must be seen as a flat, despite its problems. The second structure of primary wave Y can only be seen as a zigzag because it does not meet the rules for a flat correction.
If cycle wave IV is a combination, then it would be complete. The combination would be a flat – X – zigzag.
Within the new bull market of cycle wave V, no second wave correction may move beyond the start of its first wave below 1,810.10.
I do not have any confidence in this wave count. It should only be used if price confirms it by invalidating all other options above 2,104.27.
BEAR ELLIOTT WAVE COUNT
WEEKLY CHART
Click chart to enlarge.
This bear wave count fits better than the bull with the even larger picture, super cycle analysis found here. It is also well supported by regular technical analysis at the monthly chart level.
Importantly, there is no lower invalidation point for this wave count. That means there is no lower limit to this bear market.
Downwards movement so far within January still looks like a third wave. This third wave for intermediate wave (3) still has a long way to go. It has to move far enough below the price territory of intermediate wave (1), which has its extreme at 1,867.01, to allow room for a following fourth wave correction to unfold which must remain below intermediate wave (1) price territory.
Intermediate wave (2) was a very deep 0.93 zigzag. Because intermediate wave (2) was so deep the best Fibonacci ratio to apply for the target of intermediate wave (3) is 2.618 which gives a target at 1,428. If intermediate wave (3) ends below this target, then the degree of labelling within this downwards movement may be moved up one degree; this may be primary wave 3 now unfolding and in its early stages.
DAILY CHART
Click chart to enlarge.
Intermediate wave (2) lasted 25 sessions (not a Fibonacci number) and minor wave 2 lasted 11 sessions (not a Fibonacci number).
Minute wave ii has now lasted fourteen sessions, three longer than minor wave 2. This still allows the wave count to have the right look even though it is not longer perfect.
Minute wave ii may not move beyond the start of minute wave i above 2,104.27.
A small channel is added to this bear market rally on the daily chart. This channel needs to be breached before confidence may be had that the rally is over.
HOURLY CHART
Click chart to enlarge.
The first idea outlined on the hourly bull chart also works in the same way for this bear wave count, and vice versa.
At 2,004 subminuette wave c within the second zigzag would reach equality in length with subminuette wave a.
Within subminuette wave c, I have some confidence that micro wave 4 was a barrier triangle. This fits perfectly on the five minute chart. Fourth wave barrier triangles are followed by either very short brief fifth waves or long extended fifth waves. On the five minute chart, the structure for micro wave 5 may now be seen as complete. Upwards movement for today’s session resolved the overlapping at its start.
Within micro wave 5, no second wave correction may move beyond its start below 1,974.08. This short term invalidation point becomes a confirmation point. A new low below 1,974.08 could not be a second wave correction within micro wave 5, so at that stage micro wave 5 would have to be over. At that stage, the probability that the bear market rally is over increases.
A clear breach of the green channel on this hourly chart and also now on the daily chart is required for trend channel confirmation of an end to this rally.
Thereafter, a new low below 1,931.81 could not be a second wave correction within subminuette wave c, so at that stage subminuette wave c would have to be over. A new low below 1,931.81 would provide substantial confidence that the rally is over.
MACD still shows divergence with price which is not persistent. MACD was flat while price moved slowly higher today. This upwards movement is very weak.
ALTERNATE DAILY CHART
Click chart to enlarge.
I have previously noted this idea in the text and now it is time to chart it, so that the implications are clear.
Within the downwards impulse unfolding, it may be that intermediate waves (1) and (2) are complete and now minor waves 1, 2 and 3 may also be complete within intermediate wave (3).
This wave count expects minor wave 5 to be extended within intermediate wave (3). Minor wave 5 should also show a strong increase in momentum, so that at its end intermediate wave (3) has clearly stronger momentum than intermediate wave (1).
There is no difference to the target for intermediate wave (3). This wave count makes a difference to the invalidation point. Minor wave 4 may not move into minor wave 1 price territory above 2,019.39.
This wave count also has a lower probability than the main bear wave count. This wave count would be more typical of commodities than the S&P.
Minor wave 2 lasted eleven days. So far minor wave 4 has lasted fourteen days and it may be incomplete.
TECHNICAL ANALYSIS
DAILY CHART
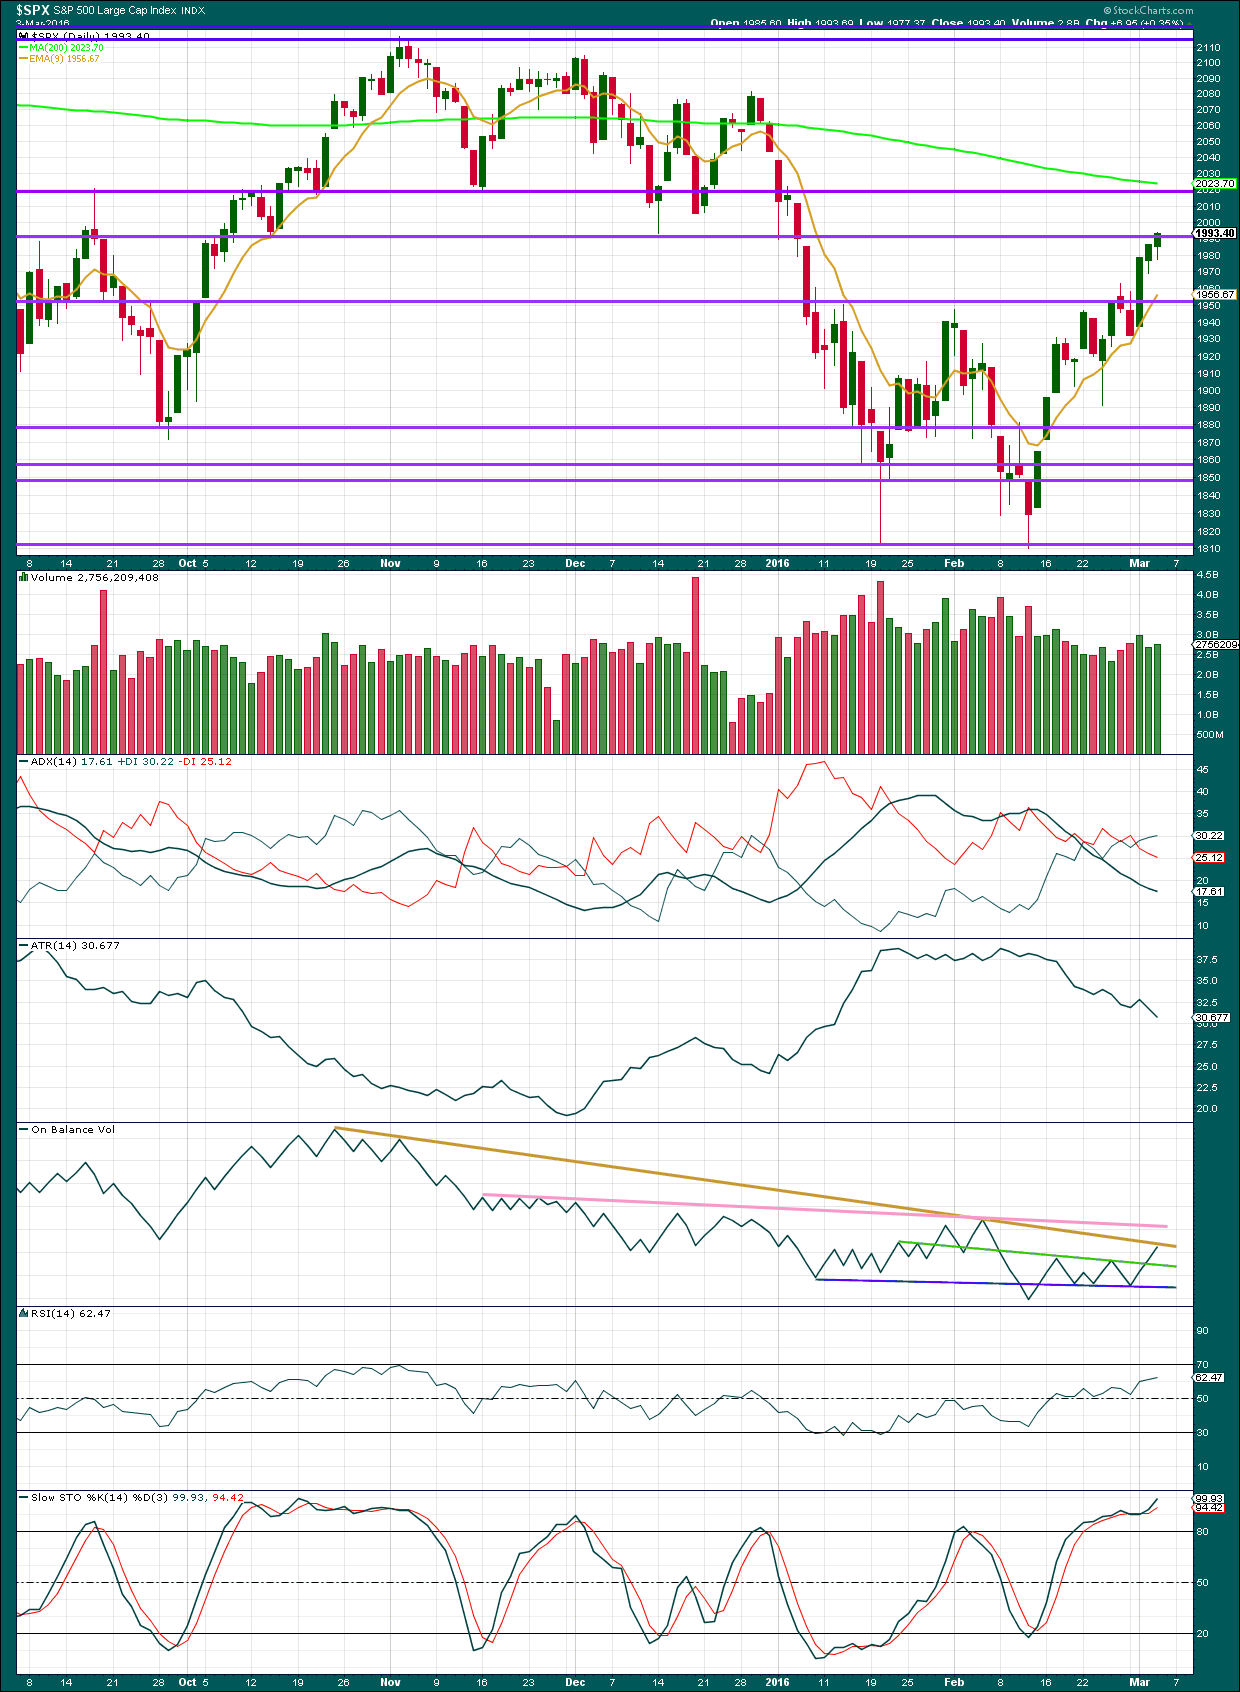
Click chart to enlarge. Chart courtesy of StockCharts.com.
Volume data on StockCharts is different to that given from NYSE, the home of this index. Comments on volume will be based on NYSE volume data when it differs from StockCharts.
Price has moved higher for three days in a row on declining volume. The rise in price is not supported by volume.
ADX is still declining despite this rally now lasting thirteen days, almost as long as the average 14 on which ADX is based. ATR agrees with ADX, both are declining. This indicates the market is not trending but consolidating.
On Balance Volume has turned up to touch its brown trend line. This line is long held and reasonably shallow, and it should offer reasonable resistance. If OBV breaks above this line, then the next pink line should offer very strong resistance. This line is almost horizontal and repeatedly tested. That should stop the rally, if it continues for days.
RSI is comfortably above neutral allowing the market plenty of room to fall.
Stochastics remains overbought. A downwards swing would still be expected about there for a range bound approach.
DOW THEORY
For the bear wave count I am waiting for Dow Theory to confirm a market crash. I am choosing to use the S&P500, Dow Industrials, Dow Transportation, Nasdaq and I’ll add the Russell 2000 index. Major swing lows are noted below. So far the Industrials, Transportation and Russell 2000 have made new major swing lows. None of these indices have made new highs.
I am aware that this approach is extremely conservative. Original Dow Theory has already confirmed a major trend change as both the industrials and transportation indexes have made new major lows.
At this stage, if the S&P500 and Nasdaq also make new major swing lows, then my modified Dow Theory would confirm a major new bear market. At that stage, my only wave count would be the bear wave count.
The lows below are from October 2014. These lows were the last secondary correction within the primary trend which was the bull market from 2009.
These lows must be breached by a daily close below each point. So far the S&P has made a new low below 1,821.61, but it has not closed below 1,821.61.
S&P500: 1,821.61
Nasdaq: 4,117.84
DJT: 7,700.49 – this price point was breached.
DJIA: 15,855.12 – this price point was breached.
Russell 2000: 1,343.51 – this price point was breached.
This analysis is published @ 06:47 p.m. EST.
This was a comment posted by an experienced member over on Lara’s gold blog – thought it was quite timely.
“March 5, 2016 at 5:02 am
Watch Surfers Get Demolished On The Sport’s Most Beautiful And Dangerous Wave
http://www.huffingtonpost.com/entry/surfers-pipeline-wipeouts_us_56d9f07de4b0000de40490f5
“This is what happens when “wavers”, aka “traders” don’t follow Lara’s guidance. lol”
To put this post into context, i was SO convinced that the world was about to fall off a cliff i started loading up shorts from every line of resistance we have encountered in this recent move… for the last 100 points or so….
Yes you read that right, i’m holding shorts from SPX1900 (and 5950 on the FTSE incidentally)
I just kept adding with gay abandon the further up we moved, safe in the knowledge we’re in a bear market, the trend is down, third wave approaching etc etc.
Anyway, i didn’t give it a whole lot of thought or concern until the closing print today, when i looked at a picture of a rather relaxed looking PTJ in his office with a sign in the background saying “losers average losers”
At that moment I wondered, “What if I’m wrong?…. What if ALL the bears are wrong?”
To be very serious for a moment here folks – What if a bottom might actually be in place and we are on the way up again? I honestly didn’t consider that for a moment until today…
Anyway I took Lara’s Daily Bull alternate and working from there did some counts this evening, the results of which didn’t exactly make me jump for joy…
Not sure about anyone else, but on my feed I’m now seeing the move from 1808 area as being VERY impulsive on the hourly time-frame.
If anyone can put forward a good argument as to why this is incorrect or might be wrong I’d be happy to buy you wine/beer all weekend and you can tell me all about it 🙂
All my analysis to date indicates to me that a larger bear market is underway. Specifically: declining volume over years at the monthly chart level, divergence with RSI persistent at the monthly chart level, failure swing by RSI at the monthly chart level, and a trend line break on the monthly chart.
It was a break below the Magee bull market trend line which told me the market had changed from bull to bear.
Until the bear market trend line is broken to the upside I will assume that the bear market remain intact.
Now, despite all of the above I could be wrong. I have been wrong before, and I will be wrong again. No one can always be right. But my due diligence and technical analysis all tells me the market is bearish.
That does not help you short term though. I cannot tell you this bounce is over until we have trend line / price confirmation that it is over.
ATM I do not have a position on the S&P. I am waiting for confirmation that the bounce is over. I don’t like trying to pick tops, I don’t want to hold a negative position for more than 2-3 days.
That Magee line? Is it the one that was upward sloping that had to be breached by at least 3% to give the signal of a trend change? If that is the one, it has been correct so far. 2015 was a long drawn out battle. It was a long distribution period by the smart money and/or banksters. That was and still is a very significant signal.
Exactly. From “Technical Analysis of Stock Trends” by Magee et al.
It was well breached, by more than 3% on a close.
I find the best TA is the simplest. The simplest is trend lines.
They work on all time frames. Not always, but most often. Nothing works always (if it did we’d all be billionaires)
I’m really a nobody in this EW world, but I must say I think you are right. I tried to get Lara to look at her daily combo for an hourly count about a week ago, because, at the time it was the only count that allowed for a larger degree impulse move up from Feb lows. If nothing else it would have presented the all elusive ‘possibility’
I exited a ?countertrend trade? prematurely but profitable none-the-less by 19%.
Lara’s argument about the combo is very strong which is why I was inclined to stay with the other counts. But I still see us in an impulse toward 2040. Weekly MACD is about to cross up. We have stong bullish candles on that time frame. Time will tell.
Best of luck to all. : )
By ‘think you are right’ do you mean you think we are in a new Bull wave to new all time highs?
2040 is below invalidation so I’m not really understanding what you mean?
I also have to say we too often under-estimate the subterfuge and connivance of the banksters. Looking at the European markets, their co-ordinated run higher has been remarkable. After all, this was not supposed to happen until AFTER Draghi announced his expanded QE later this month. This current pop in the US market has the distinct smell and feel of stealth QE all over it. It could be costly to not recognize the lengths to which the banksters will go to try and keep this party going in the short term and clearly will succeed to the degree they are able to manipulate crowd sentiment. How high could this market go? I don’t know and I don’t care. I am quite confident it how LOW it will eventually go. I have taken steps with the bulk of my short position to avoid near and mid-term bankster ambushes as I do not expect they will go gentle into that good night.
Very nice chart, Stuart. Thanks for sharing that with us. I am really far from an Elliott wave analyst, but I can not find anything that would disqualify it. The bear count invalidation point is 2104 and change. It is possible to go a long ways and still be in a bear market. The 2050 area is a magnet because of the gap. We have the 200 day ma that acts like a magnet as well. If the price gets to far ahead of the wave count, the market must take up some time as well as prepare to catch as many possible wrong at the turning point.
I ask again, has wave two done its job? on me? No. I am persuaded we have nothing but a rally in a bear market. But 2nd waves and b waves are notoriously difficult to trade because there are many, many possibilities.
When the longer or intermediate term counts I am following / using for my trades invalidates, it so often means I do not know what is going on with the waves. Then I must rely on other indicators like we are doing on this blog and sharing with one another as well as possible / alternate wave counts. So thanks again for giving us that count.
I am going to make the market price prove to me this upward correction is over before I will put my money on it. It must prove it with both TA and Elliott wave analysis. Lara will give us the points at which the market could be turning as well as points that increase the confidence the correction is over.
Sit and wait patiently knowing that at any time this market could plunge like a waterfall. Be ready to pounce like a mountain lion on its prey!
Lara is the expert but to me some of the proportions don’t look right.
Proportion in time and price give counts the ‘right look’. This chart as labelled does not look right to me.
You can pretty much force any count on any chart (eg. add wave labels to small corrections but not to others so no rules are broken), especially an impulsive count on a zig zag which itself is impulsive. Lara checks on a 5min chart if the sub divisions fit on ‘trickier’ patterns. Sometimes this can be the difference between the right count and a wild goose chase.
This is where tons of experience and regular TA come into play. If it were about EW alone, I probably would not need to subscribe to this site – I can get by (just about).
Lara provides a huge amount more due dil. than just EW to charts when coming up with counts and alternate probabilities.
But Lara is human – jump the gun and you’ll take the heat (and possibly even the loss).
We’re lucky here – when I cut my teeth I did almost the exact same thing as Stuart (averaging losing position) – albeit I was following a terrible analyst so was almost guaranteed to lose (and did – big time). At least everyone here has a good fighting chance 🙂
Just want to add to the above that you can be the best analyst in the world but if you can’t keep your emotions in check then yer in big trouble.
I mention that as it is another remarkably good trait that Lara has imo. It’s rarity cannot be overstated.
Lara’s patience should also be noted – times like these she is as much a social worker (soothing peoples nerves) as an analyst!
LOL
I think it’s the surfing. And Cesar. He’s the most calm person I know.
I just keep reading my TA books. I keep looking at the numbers, indicators, oscillators.. all the evidence I can see. Volume, breadth, volatility…. take it all into account.
I see it as a puzzle to solve. I love puzzles. All I want is to be right.
I hate being wrong. So I put a lot of energy into trying to be right.
When I step back and look at the bigger picture I see very little to be bullish about.
Further to the concerns you, Olga, and dsprospering have expressed:
I agree that now with this more sustained upwards move some of the proportions don’t look right.
I’m working on trying to find something that may have a better overall look. Will publish shortly.
Hi Lara,
To clarify – I was refering to Stuarts chart not any of yours. I have no concerns with any of your counts / TA whatsoever – quite the opposite in fact.
I have a suggestion that may at first seem a bit strange but give it a shot. Close your computer and walk away from the EW charts. Spend at least 24 hours informing yourself, from as many sources as you can, about the state of the global economy, the financial condition of central banks, the debt to GDP ratio of nations, etc, etc. The reason for that is to give yourself a context in which to make an informed analysis of the state of things in the US, after all, as the poet says, “No man is an island”. Our fortunes are inseparably linked to global markets, despite the idiotic blather you hear from talking heads about “decoupling”
The before you even consider EW counts and after some general reflections about the financial state of our own country, national debt, deficits, GDP, income growth, particularly of the so-called middle class, and other big picture items, pop open the hood of the US financial markets and take a look inside. Don’t even worry about stock buy-backs, the level of corporate debt of the companies that comprise the indices, or the current P.E. ratios, or the growth of top and bottom line revenues being reported the last 24 months. Just look at the individual charts of every company making up every index that is producing the chart you are going to use for your EW count. As you probably know this is referred to as market breadth. After you have done the above, then go back and look at where these indices are trading and without even wondering about the EW count, tell me what you think. 🙂
If you leave the charts out and look at where the big picture is and where it is likely going (Fundamentally) at least I can’t see anything to be bullish about.
But do your own research! Don’t listen to the talking heads saying everything is okay or bullish.
If you use your own brain and arrive at your own conclusions… then that is what is true and you should act accordingly.
Stuart,
I’m in an identical situation as you. But I know this not Lara’s fault. She has always said to wait for price confirmation. But I have a higher tolerance for risk, so I’ve been trying to catch the very top which can turn out to be a loser’s bet. I added to my position on Friday, but now the market can go even higher. Specially if oil keeps going higher. In fact this whole bounce was started when oil bounced back hard from its lows of $26. When oil starts its slide again, that’s when the market most likely is going to end its bounce. All I can say is give yourself time. If you’re doing options, you should add positions by buying September options, expiring 6 months from now, or maybe even further out. Not by getting options that expire in March or April because they’re cheaper. Most of my options expire in June, so I’m hoping by then the market will make its move down. About 15% of my position is in March option which will most likely expire worthless. And another 10% in Sept options. I’m thinking now I need to roll those options into September…
Regarding Lara’s credibility, I’d look at her oil analysis from 18 months ago. She called the drop in oil when it was trading at $104/barrel, with her target in the $20’s. And of course I bought short-term options instead of leaps and ended up loosing money on the trade 🙁 I was too early to the start of the slide by about 3-4 months…
Lara war right, it was my strategy that was wrong. I’ll bet SPX will get to 1,400’s as she says. It’s just a matter of timing…
Give yourself time… and wait for price confirmation. Market can linger up here for a while like we saw in 2015. A 7 year bull market isn’t going to just flop and play dead…
And as you mentioned we all COULD be wrong; specially in the short term. We’ve never had such a strong job’s market with such low relative oil/gas prices… that leaves more money in people’s pockets and the illusion that all is well. Who knows…
But we need to stop trying to catch tops, and be more patient for price confirmation… that’s the only way to not see your investment capital shrink very quickly…
Good luck to you and everyone else. I’m learning a lot by everyone’s posts here…
Amen to that Ari. I got so tired of the bankster games that at the last low I liquidated 100% of my medium and long term short positions and moved them to 2018 where they now comprise 90% of my shorting capital. I am using 10% for short and medium term trades, most which are devoted to scalping well-timed moves to the upside and adding to my leaps positions. Let’s see them keep this bubble going for another 24 months if they can. The only possibility of that is if we just completed a major wave four and we should have proof or negation of that within a week – a very short time indeed, considering the contrary possibilities.
You buy this strong labor market garbage?
80% of the jobs created are min wage jobs and thats the way it has been through most of this so called recovery… the numbers are garbage!
In the 1980’s, 1990’s & even in the early to mid2000’s the jobs were real higher paying jobs.
Min wage jobs are not going to expand economic growth.
Yep. Just one sided long right now a bit risky. Holding a spread a much safer route as you can pivot once the market shows its hand by closing the wrong side and letting the other run. Spreads are the only way I know to turn a losing trade into an instant winner at important directional pivots such we now face. We should have more than enough info come Sunday evening.
So far as the short side goes, I am long volatility out the wazoo!!! If they so much as EVEN THINK about pulling that reverse split crap there will be H..E double toothpicks to pay…Cherio!! 🙂 🙂 🙂
Ahead of a major third wave down is not a place to try to get cute…
Put to Call ratio, Stock Price Breath, Safe Heaven Demand, and Stock Price Demand all read extreme greed…
I find it interesting that folks were buying up put options on SSO when this major wave up started…now we have folks buying up call options were the focus should be on the short side…
We have a very nice looking abc up…not a place to jumping the gun…although I like it from the sentiment standpoint…
Well I’m very happy with todays action.
If we get a new high then so be it – I’ll deal with it and plan my next move, but until that point this wave is over as far as I am concerned (nothing like stating the obvious 🙂 )
I lightened my UVXY position slightly just to manage risk but unless we seriously gap up on Monday, I should be able to exit at about break even anyway. If we gap up then I’ll have to strap in for the rollercoaster ride and try to average my cost down with a bit of scalping. We’re not talking huge bets here (yet!).
I liked the divergence between S&P and UVXY today. Somebody somewhere always seems to know something 😉
Volume is a slight issue for me but as far as I undertstand we were already running on vapours in that department so I’m not giving it too much weight. I’ll let price do the talking. If Mr Market says higher, then higher we go!
Top class analysis (as usual) from Lara – many thanks 🙂
Have a great weekend everyone
If I were a betting man, I would wager that both indices are now heading for the 200 day moving averages for the proverbial last, long kiss good-bye. I really did not expect that visit until primary two up had arrived. I’m starting to get the sneaky feeling that we may be farther along in this bear market than we think so far as the wave counts are concerned, the persistent elevated market prices notwithstanding. I think we continue higher, based on today’s action around the pivots. I think I am also going to keep the premium from those put spreads….. 🙂
Me too. I may have to move everything up one degree.
I still want to see how long the next wave down looks on the monthly chart before I make that final decision.
Next line of resistance 2,020 is about where the 200 day MA now sits.
Slight increase in volume today is slightly concerning.
But…. that sharp five down on the five minute chart looks bearish. But that is really only very short term.
MACD on the hourly still shows this move up today is weak. OBV has found resistance.
If it keeps going up then if we have a day where RSI shows divergence that would be the strongest bear sign I could see.
For now, the trend short term is up for a bounce. We have zero confirmation it is over. We need to expect it can continue higher until we have confirmation that it has ended.
Volatility, in addition to that impulsive move down, suggests a bearish outlook is warranted as both VIX and UVXY printed green candles today despite the markets’ positive close. Strong moves down in my experience are also heralded by decisive moves through these round numbers so the pause there today does give me….what shall I say…? “pause”; you also mentioned the increase in volume. It will be most instructive to learn which signal to pay more attention to in a case like this come Monday- increased volatility? or an increase in volume at round number support/resistance? Should be a good lesson for future reference.
Hmm.. is spx wanting to close that gap around 2043 ?
Split decision on the round # levels for closing prices…
17006.77 DJIA
1999.99 SPX
The other end in 2009… was it not 666.66 ???
A split decision is really a victory for the bulls as it means the pivots are now acting as support. Barring a plunge in futures Sunday night, which I now do not expect, we should see a run up 2 to 3% above these pivots, which just happens to be the area of the 200 dma. The next move down will take these out decisively, no split decisions. Until then we have to respect the banksters!
Hedged with SPY 197/199 bullish put credit spread. If market heads South next week will buy back 199 puts. Cheap insurance at maximum risk of 200 per contract if we gap below 197. Have a great (and calm!) week-end everyone! 🙂
Adding a few upside hedges against one more spike up next week. Clearly this battle is not going to be resolved today.
I really, really hate these pivot dust-ups, but you gotta pay attention to what happens around ’em I don’t like the fact that the bears did not smash them on the way down. Meandering in this area militates against a strong move down….
There’s the cash dump. Let’s see how the bears respond. If they don’t take back the pivots before the close, we head for 2060….
UVXY sporting a bull flag…saying not so fast….!
UVXY up, market up, bearish.
Both VIX and UVXY should be heading South ahead of a move higher….
3:25PM 495.589 Million Volume – still lighter than yesterday.
2:06PM 388.096 Million Volume
1:00PM 326.340 Million Volume
Thanks for the volume update Joseph! 🙂
3:54PM 556.374 Million Volume – still lighter than yesterday.
4:00PM 608.059 Million Volume – Lighter than yesterday…
But
4:06PM 780.759 Million Final Volume – higher than yesterday
Looks like bears are waiting for a cash dump at the pivots to bring out the heavy….
My short term watch level is now 1994.92, albeit this might only be a of an abc (or might not be corrective at all).
Short term trendlines on the 1m chart are useful here.
5 up right now would not be a disaster (yet) – could just be wave a of a corrective zig zag
Action from todays high???
Yes, it does look like a nice five down.
Could be an A wave of a correction though….
So we still need some price confirmation of a trend change.
Pivots about to be surrendered. Price should fall away from these convincingly…no monkeying around….
We just had a 5 down so think we might bounce again – what it does during that bounce is key.
We have just gone under the previous wave 4, so this is not a wave 5 extension at that degree – could still be a wave 2 of one degree higher. Need to watch out for moves down being 3’s rather than 5’s
1982.37 – is my next confirmation of interest, then 1974.08
Hang on Sloopy,, Sloopy hang on..
Initially read that as ‘Sloppy’… thought you’d lost it for a sec there Doc! 🙂
Hang on…Hang on! 🙂
I count 5 down on the 1 minute chart of SPX.
The Fear Greed index is at 72. I have said for two weeks or so, I’d love to see it get to 80. This is close enough to indicated the public is convinced we are going up, up and away.
The put call ratio ended yesterday at 0.77. That is a quite bearish indicator.
On next confirmed 3 wave bounce I’m going 50% short with a stop at todays high – will hopefully be able to bring that stop down to break even.
Won’t warn anymore about the huge risk involved – think everyone knows it’s not a good idea until we pass below Lara confirmation points!
You… gunslinger you! Meet ya at the O.K. corral. 🙂
I stuffed in a few additional UVXY calls earlier…Oh so reckless… 🙂 🙂
Eyeing June SPY 200/195 bearish call spread…
UVXY perked up a bit. I also picked up a few 😉 but did’t report in realtime (as is very reckless – and I mean that!!!) so doesn’t really count. Few weeks from now a couple dollars difference in entry will hopefully be a moot point.
Still awaiting a 3 wave bounce before I throw the kitchen sink at it.
It is always worth noting that a 5 wave move down from a high can be a c wave – consider yourselves warned 😉
No question about the wisdom of caution with leveraged instruments- they will absolutely bite your head off….
Or an A wave
Yeah indeed. I specifically pointed to the C wave ‘Danger’ as I personally found C waves from a top not at all obvious in the early days of using EW. I was caught out quite a few times. The ABC danger I found alot more intuitive as every man and his dog seems to state you need to await a ‘5 down’. Think I must have missed the ‘and 3 up’ part in the early days.
Of course being burnt by C waves from a top is totally due to jumping the gun / not awaiting confirmation. Cannot for the life of me understand why I had to learn the hard way (lose money) looking back now.
Ah, I see. Yes. A C wave of an expanded flat.
That certainly can and does fool the beginner Elliotician. Tricky structures those flats.
Is that all it has? I say lets hang ten, or what ever you surfers say, big tsunami down .
I think the dog is sniffing the rattlesnake right now
(poss wave iv sniffin wave i) – but will it run off or get bitten??
We have our answer – poss conf 1.
Under 2001.97 things get better – this could stilll be a 2nd wave down (so further extention)
Still along way to go though – jumping the gun not recommended!!
Ooops – *extension* I meant!!
Got very small degree 5 down from the top.
Waiting for a small 3 wave bounce back up to short the Dickens out of it with stop at todays high.
High risk strategy – not advocating it. You can lose your shirt getting stopped out 20 times picking a top.
lol the high probability is that you should be alright today Olga…Bears pretty much capitulated yesterday. $CPC printed 0.77 yesterday.
Will add that to the bear side of the weighing scales Jack – many thanks for the info.
Great…
This could still be a larger corrective structure – need to be mega careful here unless very tight stops and eyes like a hawk.
Also possibility of getting gapped above stops – think I’m talking myself into awaiting alot more confirmation.
I agree. Nothing less than a surrender of those round numbers prior to the close will see me doing any jumpin’. It will be a very conservative bearish call credit spread with remaining dry powder.
We say “commit”.
You have to commit to the wave. Give it everything you have to catch it and ride it.
I see a nice triangle, which may be complete… or not.
Either way it indicates more upwards movement.
1,974.08 will still be a strong confirmation point. At this stage a break below that would also break out of the channel on the hourly chart. *Edit: I think my channel on this five minute chart is probably different.
This is what I have today for the five minute
If micro 3 = micro 5 the target would be 2,010.
you were within 1 point Lara….thanks again
So far… but that’s only of any use at all if that is actually where it ends.
And we don’t know yet if it’s ended.
thank you
if we get a pop higher where would you envision the target?
If that was aimed at my ‘pop higher’ comment, then very close by imo (but still could extend).
A pop higher followed by going below the wave e of the triangle (if thats what it is), or wave 1 of the final impulse would indicated the move is over.
Lara is around so no doubt will update us on her thoughts as soon as the wine from last night wears off a bit 😉 🙂 🙂 🙂
I was very restrained. Up at six ready to explore 🙂
Volume lighter today than yesterday at this time 1PM.
When I remember, I will be logging the midday volume. 326.34 million
2:06PM 388.096 Million Volume
Wave (iv) triangle? Would be nice as it is a (pre)terminal pattern…
I would not be in the least bit surprised. Triangles have been indeed a common theme of the move up off the last low. We will know if the move up is terminal as a hallmark is a very swift reversal after the spike out of…we should look for one more high…
Bit of divergence on VIX ETF’s – often seen at turnarounds.
Again – somebody seems to know something!!
Yep. I am seeing some accumulation. Somebody sold a gigantic 30/25 June
put credit spread for three bucks. They may be willing to take assignment at 30 for a final cost of 27 per share. Very smart. I don’t think UVXY is going to be anywhere near even 30 come June. Why didn’t I do that??! 🙂 🙂
This better not truncate!!!
I at least want one more pop higher.
Good morning.
Yes, it would. Except we’ve seen at least one before I think in this upwards move.
I think that barrier triangle earlier portended an extended fifth wave, not a short fifth wave.
This smaller triangle is hopefully prior to the final fifth.
Top o’ the morning! Lady of the beautiful isles. What a setting to wake up to! How much of that chablis remains might I ask?! 🙂 🙂 🙂
I hate hangovers so limit my wine intake. That Paroa Bay Sauvignon Blanc is an award winner, really good quality. If you’re going to limit your wine consumption then IMO you should have the best 🙂
*Edit: just checked, there’s enough left in the bottle for more tonight 🙂
Gotta admit – when I saw your comment ‘This will be my workstation tomorrow morning (minus the wine of course!). ‘
Got me thinking…. if it were me it would only be minus the laptop 🙂
Like to have space for plenty of wine!
Penetration of round numbers accomplished. A close above means a run at SPX 2060 at the least. If surrendered today I think that’s all she wrote…
Right up to and a bit above the 200 day moving average. That will convince the majority this is a continuation of a bull market. In fact, I am wondering if Lara’s bull counts deserve more attention. Interesting to say the least. Is wave 2 convincing me?
Certainly aint convincing me – a move above invalidation would though!
We need more than a rally to change from bull to bear.
And more than a breach of the 200 day moving average.
A break above the invalidation point or a bear market trend line would do it.
Upwards movement supported by volume, no divergence with MACD on the hourly (increasing strength) and some support from breadth would also indicate a new bull market.
We don’t have any of that.
Lovely textbook impulse upwards atm – 2005 prob won’t be far off the mark.
I currently have us just finishing wave v of (extended) (iii) with (iv) and (v) still to go (1 min chart)
I have top of (i) at 1989.76 – below there would prob be first indication its over.
All the above is labelled from todays lows
Maybe in (iv) now? With (v) still to go (unless it is extending higher – extensions of extensions 🙂 )
I have lower degree iv of (iii) low at 1997.54
This wave (iv) down (if that’s what it is??) cannot go below 1989.76 (wave (i) top) – if it does then that might be earliest indication that this current move upwards is over.
Think one more run to near 2005 target for double top.
Hoping so – but trying to pick a top is a fools game (as was proven yesterday) so not holding my breath.
Just labelling what I see atm – could always extend higher but yer never know. Finger is near the trigger but not yet twitching 🙂
UVXY June 30 strike calls down a bit but not too serious a haircut. A close below pivots will see addition of a few more to lower cost basis to exactly 8 Washingtons. 🙂
Yeah – UVXY not playing along with Mr Market so much today, albeit it did a fair amount of sliding yesterday so perhaps there is some discount already baked in through overdone selling enthusiasm.
It should quickly snatch that back if this wave is nearly done. It’s almost back positive now with the market up 0.5%. Might be signalling a turnaround.
Certainly sneaks up on yer
Current move down just proven corrective with that poke above 2003.43 – Sig probability now that we still have new high above todays high to go.
Could still correct down lower first though (but not below 1989.76).
This poss (iv) and previous (ii) already quite out of proportion – as Lara always states, this is the problem with lower degree charts.
Chart is always easier! 🙂
(ignore that random ‘5’ – is one of my labels gone AWOL – should be right at the top)
Is this 1 min chart?
If yer lookin at my charts it always is! 😉 🙂
Count looks good and right up to Lara’s target. Thanks Olga!
No worries – but no counting any chickens yet Thomas!
I am wondering if the current wave 2 correction has completed its task of convincing everyone that the way is clear to move much higher, say 2300 on the SPX. The job of the wave two is to convince the mass of market participants that the bull market corrections are complete and the bull market has returned.
Who thinks this wave 2 has done / completed the job?
Rodney,
Based on last couple of days action, dip buyers should be picking up the inventory with the hope for recovery into the close. Let’s see how the price and volume come out today.
Would have thought today would help alot?
I’m always taken aback by how quickly people forget recent history especially when doing so supports their bias.
Bugs me more that alot of people seem to be seeing this count (or variations that mean a similar thing at this point). Certainly does not make it wrong, but always makes me cautious.
Provided one awaits confirmation it should be irrelevant anyway imho. If we are ending W2 now then we are, if we’re not then we’re not.
The higher we go, the better the risk / reward becomes and often the better the entry points become imo.
That initial spike in futures is all algo thrashing around. You are right on the money on the question of the FED. To save face they are going to have to tighten by 25 basis points and the market knows it’s going to be a disaster. It is an interesting situation as I don’t trust anything that comes out of the Obama administration so who knows how legitimate the jobs numbers are. Nonetheless, the numbers are out there and the FED will look like complete imbeciles if they fail to act, as would be indicated by the jobs number.
SPX and DJI now trading into a range of powerful overhead resistance so today should be revealing.
Payroll thoughts? Initial push then fallback,surely the fed needs put the rates up if it is ‘data dependant’
Funky,
I was thinking along the same lines, if job growth is what we are seeing, I can’t understand why and what will stop FED from raising the rates. All these things are coming together and one bad step by FED here is going to burn them once they loose the credebility.
Stockcharts – technical analysis effect of the jobs numbers:
http://stockcharts.com/articles/tradingplaces/2016/03/jobs-surge-in-february-sp-500-looks-to-clear-2000.html
VIX under pressure after the job report but still time before the cash markets open.
VIX right at trend line of higher higher and higher lows. Will it hold, or will it fold?
Vern,
Thanks for sharing, the trendline goes all the way back to May 2015 so this will be an important decision point for VIX.
Most welcome. I have had my eye on that line for the last week or so and quite interested in price action around it. It should tell us a lot about what to expect in the near to medium term.
Looks very nice Lara.
I shall be visiting my daughter at Exeter University, England.
Might send some pics
I am now in the Bay of Islands, just for the weekend. We have family visiting from Texas, we’re showing them some NZ beauty. Northland, of course 🙂
This will be my workstation tomorrow morning (minus the wine of course!). Fresh air. Clean water. Trees. Calm.
That is truly lovely…
Where in Texas is your family visiting from? I live in Austin 🙂
They’re from Austin too!
That’s awesome… Maybe you can introduce us. Can’t have enough friends in this crazy world… I moved here about 2 years ago, and still haven’t met too many people here. What a great coincidence! And I have a neighbor who is from NZ. His name is Grant. Very cool guy. He teaches sailing… Maybe I can introduce them…
Exquisite! 🙂
Have a great time and relaxation! 🙂
The wine and calm go together! Enjoy family and make fond memories.
Beautiful view! Cheers!
hmm,, only one comment tonite,, must be an indicator that we are topping.
LOL
I’m surprised actually that Verne didn’t leave 1st to you on both posts 🙂
I waited, and waited and waited…for an entire 15 seconds!!! 🙂
Interesting the different degrees of correction in NDX and SPX. It will be neat to see when they all become aligned ( so far as the wave counts ) and probably easier to interpret volatility price action.
It’s that complicated chop on S&P from 13th November 2015 to 29th December 2015.
For Nasdaq it fits more neatly as the end of the prior correction, then a smaller lower degree correction.
For S&P it fits best as two corrections of one and one lesser degree, and will only fit as one if a running flat AND a truncation in the B wave of it is allowed.
I think it could be resolved when we get to the fourth wave corrections.
Either way, both markets need the middle of a big third to move price much lower.
Vern & Lara,
I looked up the Hurst Cycle analysis on NDX and PCLN, they two are telling completely different story. NDX Hurst analysis expects a signicant drop while the high flyers like PCLN analysis doesn’t. Do either of you have experience with the Hurst Cycle Analysis? I am trying to understand different technical analysis techniques.
Hi Ris, hope you don’t mind if I jump in here… I follow Hurst and think it is a good tool to have in the arsenal. Are you using Sentient Trader software? It is worth a look, they also give webinars that can be interesting.
The coverage I have seen for the Qs is similar the what they are expecting for SPX. Up until March 4, down till July, up until late November (US elections) then down for the rest of the bear market. We are having a powerful short term cycle crest within a longer term cycle trough. Haven’t seen coverage on PCLN, but that stock seems to do its own thing quite a bit. Sentient shows SPX turning down a little later March 8th.
IMO Hurst cycles work well as a compliment to EW — and especially Lara’s analysis. Definitely one more thing to have on the radar. Keep us informed with your findings.
That sounds just about right for completion of primary one to the downside in the July time frame. The FED will have to take back their rate hike, which they will probably do at the end of intermediate three down. I also fully expect they will announce QE4, probably at the end of intermediate five down and will usher in the last great manic rally of this GSC topping process. I think primary two up is going to be a sight to behold, and will take us back close to all-time highs. With social mood starting to darken, I would not be surprised to see the primary rally up interrupted by some sort sort of national or global crisis.
Thanks David,
I will check Sentient Trader out.
Thank you David.
As this is something I’m totally unfamiliar with this adds more to our arsenal 🙂
I am not familiar with Hurst Cycle. I will try and do a bit of checking to see what I can learn.
I am completely unfamiliar with Hurst cycles.
So please do share!