
Again, downwards movement was expected.
Price moved lower to make a lower low and a lower high. This fits the wave count.
Summary: Upwards movement is still most likely over. A break now below the lower cyan trend line and below 1,891 would add substantial confidence. If price moves higher above 1,946.7 tomorrow, then the target for upwards movement to end would be again 1,987. What is more likely is a big third wave down is approaching.
To see how each of the bull and bear wave counts fit within a larger time frame see the Grand Supercycle Analysis.
To see detail of the bull market from 2009 to the all time high on weekly charts, click here.
Last published monthly charts can be seen here.
If I was asked to pick a winner (which I am reluctant to do) I would say the bear wave count has a higher probability. It is better supported by regular technical analysis at the monthly chart level, it fits the Grand Supercycle analysis better, and it has overall the “right look”.
New updates to this analysis are in bold.
BULL ELLIOTT WAVE COUNT
DAILY CHART – FLAT
Click chart to enlarge.
This wave count is bullish at Super Cycle degree.
Cycle wave IV may not move into cycle wave I price territory below 1,370.58. If this bull wave count is invalidated by downwards movement, then the bear wave count shall be fully confirmed.
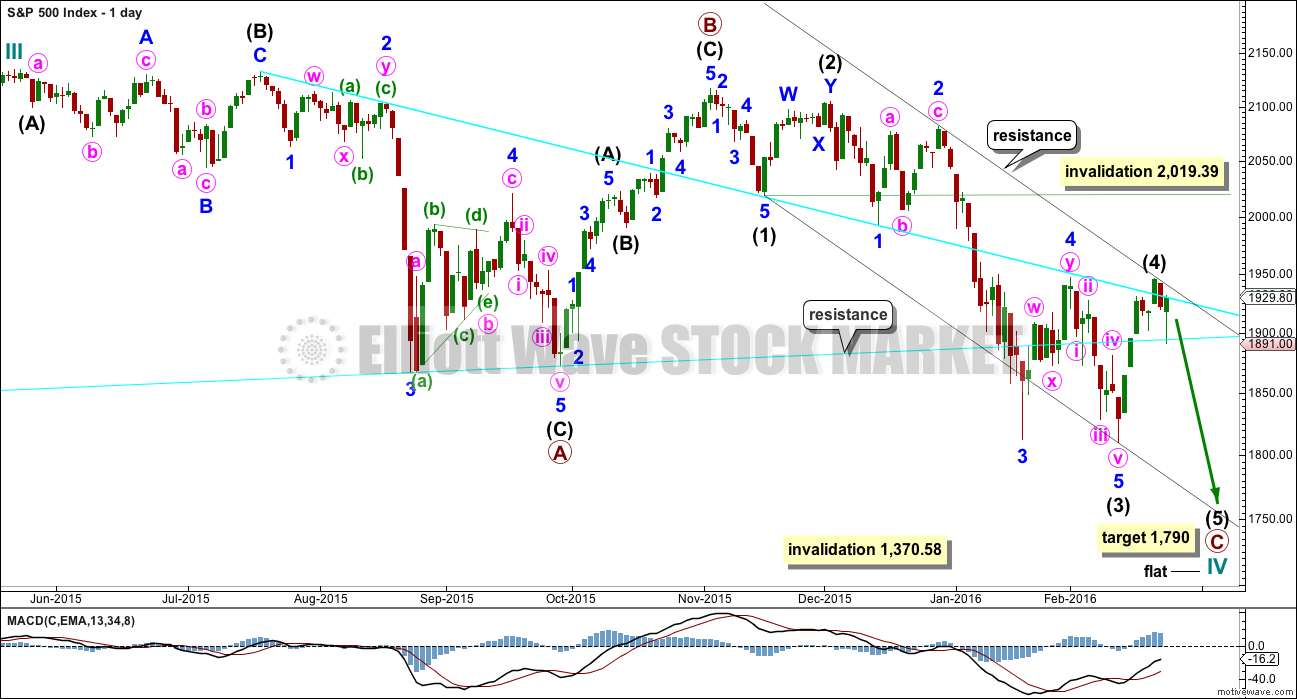
Cycle wave II was a shallow 0.41 zigzag lasting three months. Cycle wave IV should exhibit alternation in structure and maybe also alternation in depth. Cycle wave IV may be a flat, or combination. This first daily chart looks at a flat correction.
Cycle wave IV may end within the price range of the fourth wave of one lesser degree. Because of the good Fibonacci ratio for primary wave 3 and the perfect subdivisions within it, I am confident that primary wave 4 has its range from 1,730 to 1,647.
Primary wave C should subdivide as a five.
Within the new downwards wave of primary wave C, intermediate waves (1), (2) and now (3) may be complete.Intermediate wave (4) may now be over, finding resistance at the upper edge of the black channel. It is just within the fourth wave of one lesser degree still, which is a common place for a fourth wave to end.
Intermediate wave (2) was a deep double zigzag. Intermediate wave (4) may be a complete shallow 0.46 zigzag. There is alternation in depth and a little in structure.
At 1,790 intermediate wave (5) would reach 1.618 the length of intermediate wave (1). This would see intermediate wave (5) move below the end of intermediate wave (3) at 1,847 avoiding a truncation. Primary wave C would end below the end of primary wave A but not too far. Cycle wave IV would have a reasonable regular flat look.
The idea of a flat correction for cycle wave IV has the best look for the bull wave count. The structure would be nearly complete and at the monthly level cycle wave IV would be relatively in proportion to cycle wave II.
HOURLY CHART
Click chart to enlarge.
Both hourly charts are again the same, so comment will be with the preferred bear wave count.
DAILY CHART – COMBINATION
Click chart to enlarge.
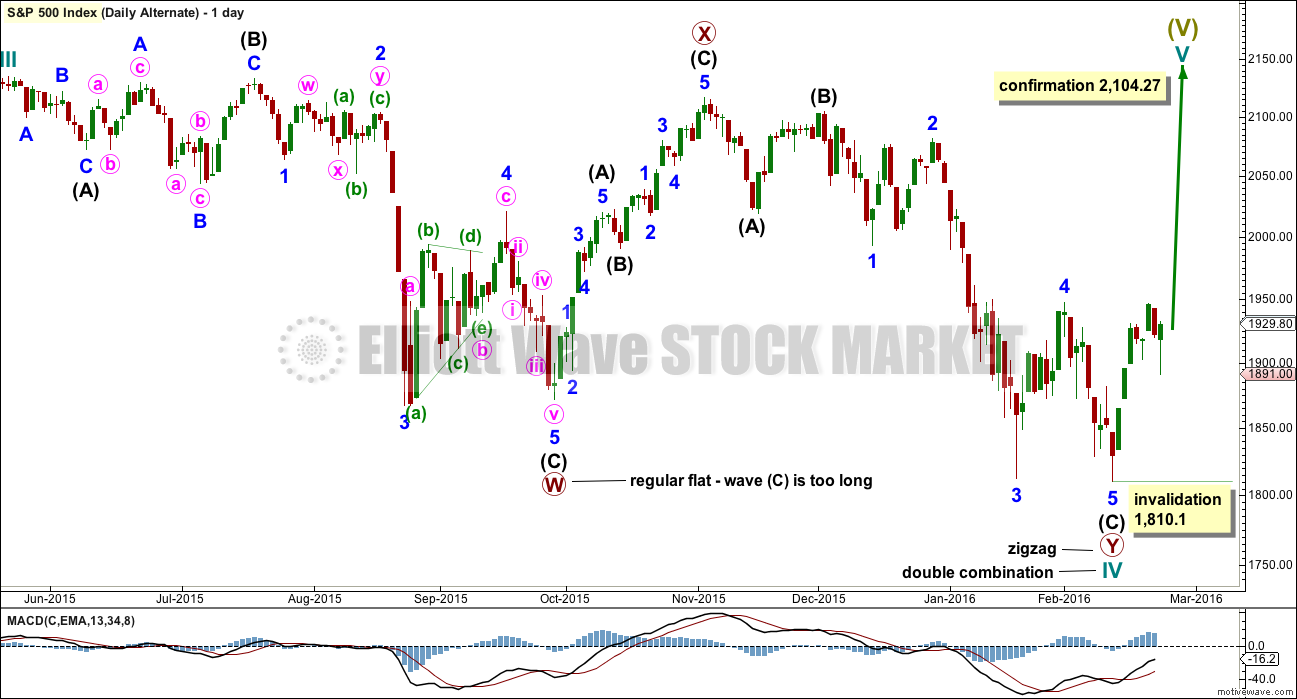
This idea is technically possible, but it does not have the right look. It is presented only to consider all possibilities.
If cycle wave IV is a combination, then the first structure may have been a flat correction. But within primary wave W, the type of flat is a regular flat because intermediate wave (B) is less than 105% of intermediate wave (A). Regular flats are sideways movements. Their C waves normally are about even in length with their A waves and normally end only a little beyond the end of the A wave. This possible regular flat has a C wave which ends well beyond the end of the A wave, which gives this possible flat correction a very atypical look.
If cycle wave IV is a combination, then the first structure must be seen as a flat, despite its problems. The second structure of primary wave Y can only be seen as a zigzag because it does not meet the rules for a flat correction.
If cycle wave IV is a combination, then it would be complete. The combination would be a flat – X – zigzag.
Within the new bull market of cycle wave V, no second wave correction may move beyond the start of its first wave below 1,810.10.
I do not have any confidence in this wave count. It should only be used if price confirms it by invalidating all other options above 2,104.27.
BEAR ELLIOTT WAVE COUNT
DAILY CHART

Click chart to enlarge.
This bear wave count fits better than the bull with the even larger picture, super cycle analysis found here. It is also well supported by regular technical analysis at the monthly chart level.
Importantly, there is no lower invalidation point for this wave count. That means there is no lower limit to this bear market.
Downwards movement so far within January still looks like a third wave. This third wave for intermediate wave (3) still has a long way to go. It has to move far enough below the price territory of intermediate wave (1), which has its extreme at 1,867.01, to allow room for a following fourth wave correction to unfold which must remain below intermediate wave (1) price territory.
Intermediate wave (2) was a very deep 0.93 zigzag. Because intermediate wave (2) was so deep the best Fibonacci ratio to apply for the target of intermediate wave (3) is 2.618 which gives a target at 1,428. If intermediate wave (3) ends below this target, then the degree of labelling within this downwards movement may be moved up one degree; this may be primary wave 3 now unfolding and in its early stages.
Intermediate wave (2) lasted 25 sessions (no Fibonacci number) and minor wave 2 lasted 11 sessions (no Fibonacci number). Minute wave ii may be complete in six sessions, which is not a Fibonacci number.
Minute wave ii may not move beyond the start of minute wave i above 2,104.27.
HOURLY CHART
Click chart to enlarge.
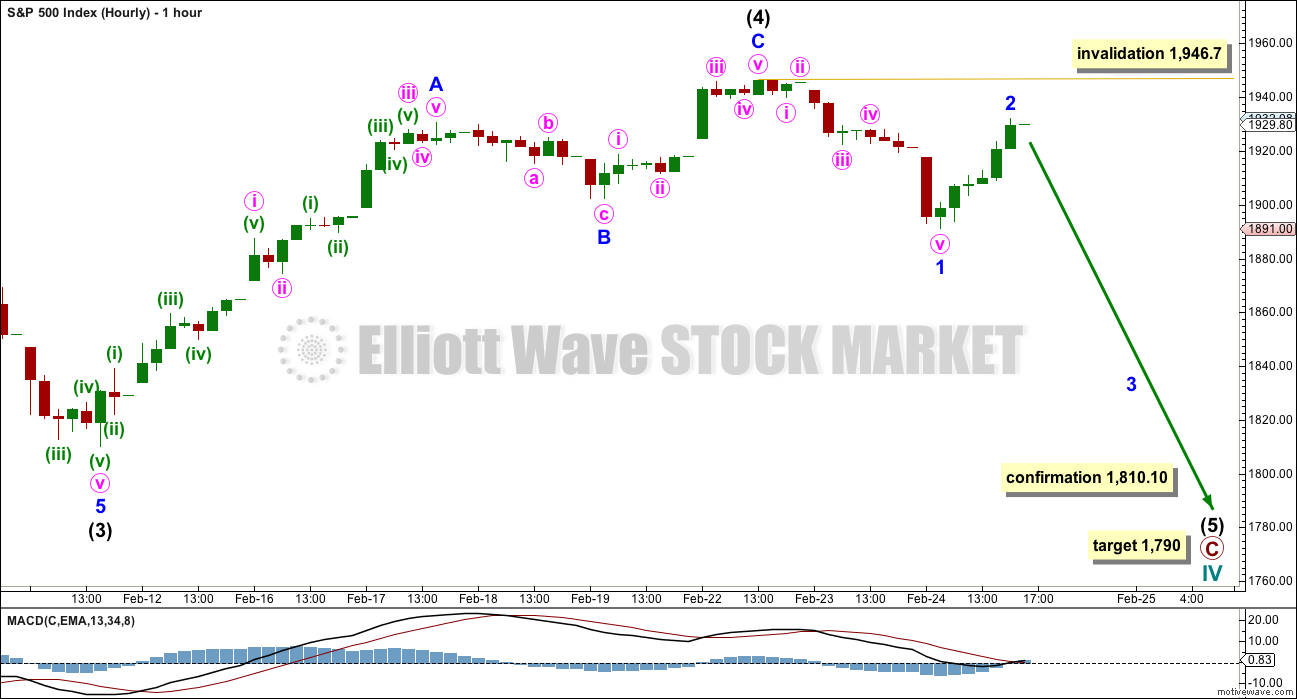
A new low below 1,902.17 could not be a second wave correction within minuette wave (c), so minuette wave (c) must now be over. A zigzag upwards is complete. This is most likely minute wave ii in its entirety.
The downwards wave labelled subminuette wave i fits best as a five wave impulse with a strong fifth wave. Upwards movement to end Wednesday’s session will subdivide either as a five or a three on the five minute chart.
At 1,653 minute wave iii would reach equality in length with minute wave i. This is a reasonable target, and it would expect both minute waves i and iii to be extended within the impulse of minor wave 3.
If price gets to the first target and the structure is incomplete, or if price just keeps dropping through the first target, then the next target is at 1,470 where minute wave iii would reach 1.618 the length of minute wave i.
Downwards movement for Wednesday’s session found support at the lower cyan trend line. The following rally found resistance and ended about the upper cyan trend line. If the lower cyan line is breached tomorrow by downwards movement, then it should thereafter provide resistance. If price throws back to that line, it may offer an entry point to join the downwards trend.
Subminuette wave ii is very deep at 0.74 of subminuette wave i. Second wave corrections can be and often are very deep. However, this one is a small degree second wave within a big third wave. I would have expected it to be more shallow than this. For this reason (and reasons given in the technical analysis section) the alternate below is considered.
At the last high of minuette wave (c), there was divergence between price and MACD: as price made a new high MACD failed to make a corresponding high. This indicates there was weakness in price and supports this main hourly wave count.
ALTERNATE HOURLY CHART
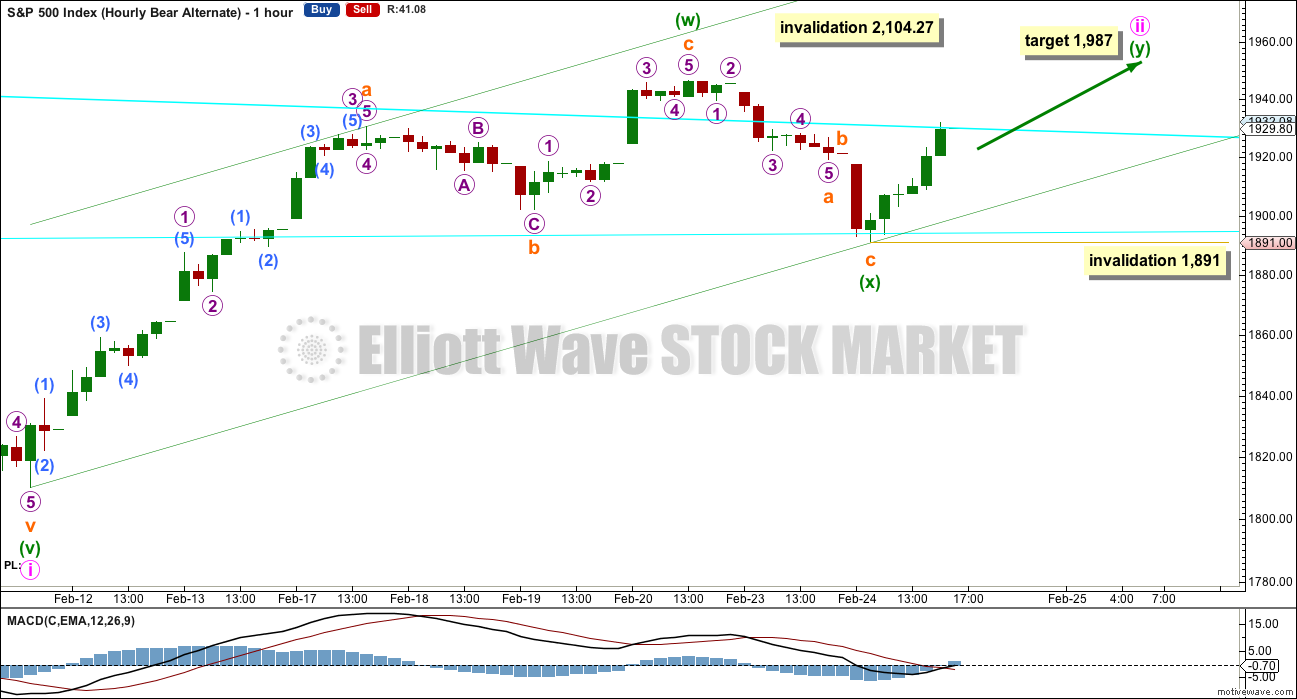
Click chart to enlarge.
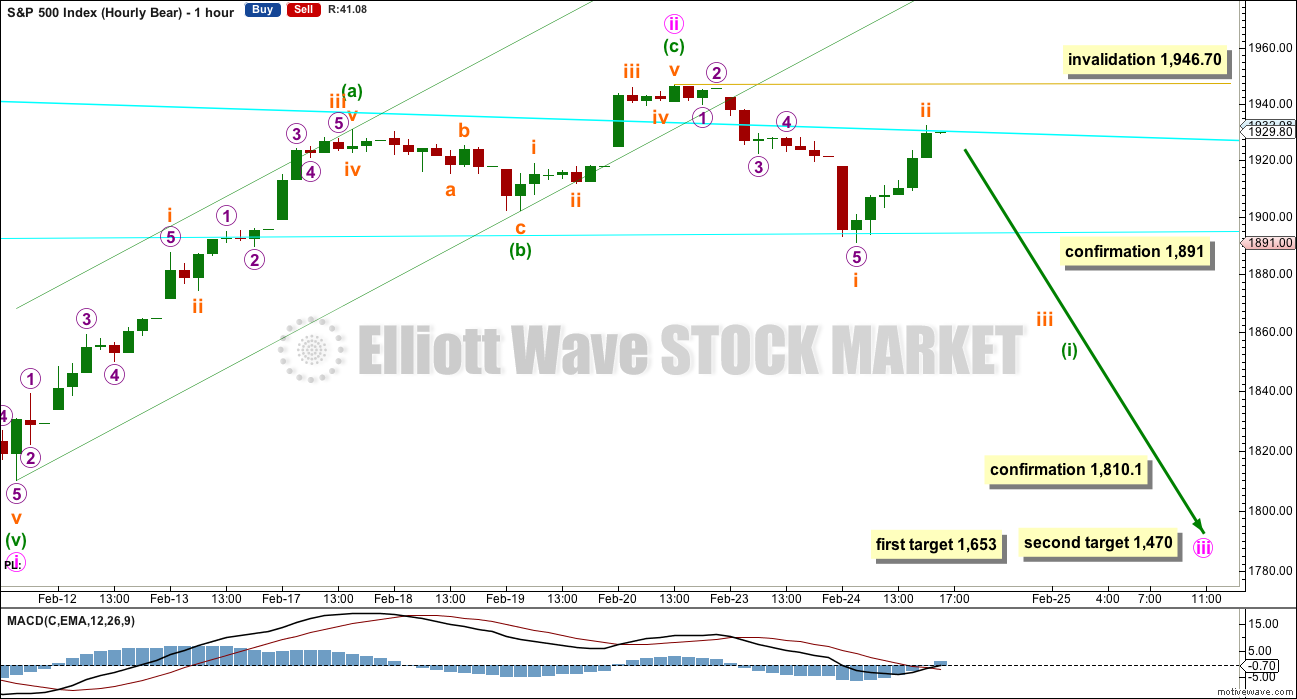
At this stage, the only structure which fits for minute wave ii to continue higher is a double zigzag.
If minute wave ii continues higher as a double zigzag, then it may end about the 0.618 Fibonacci ratio of minute wave i at 1,987.
Minute wave ii may not move beyond the start of minute wave i above 2,104.27.
Upwards movement would have to break through resistance at the upper cyan trend line. If it manages to do that, then look for support at that line for a throw back.
If minute wave ii continues higher, then it may end in a further five sessions, at about 1,987, if it totals a Fibonacci thirteen daily candlesticks.
ALTERNATE DAILY CHART
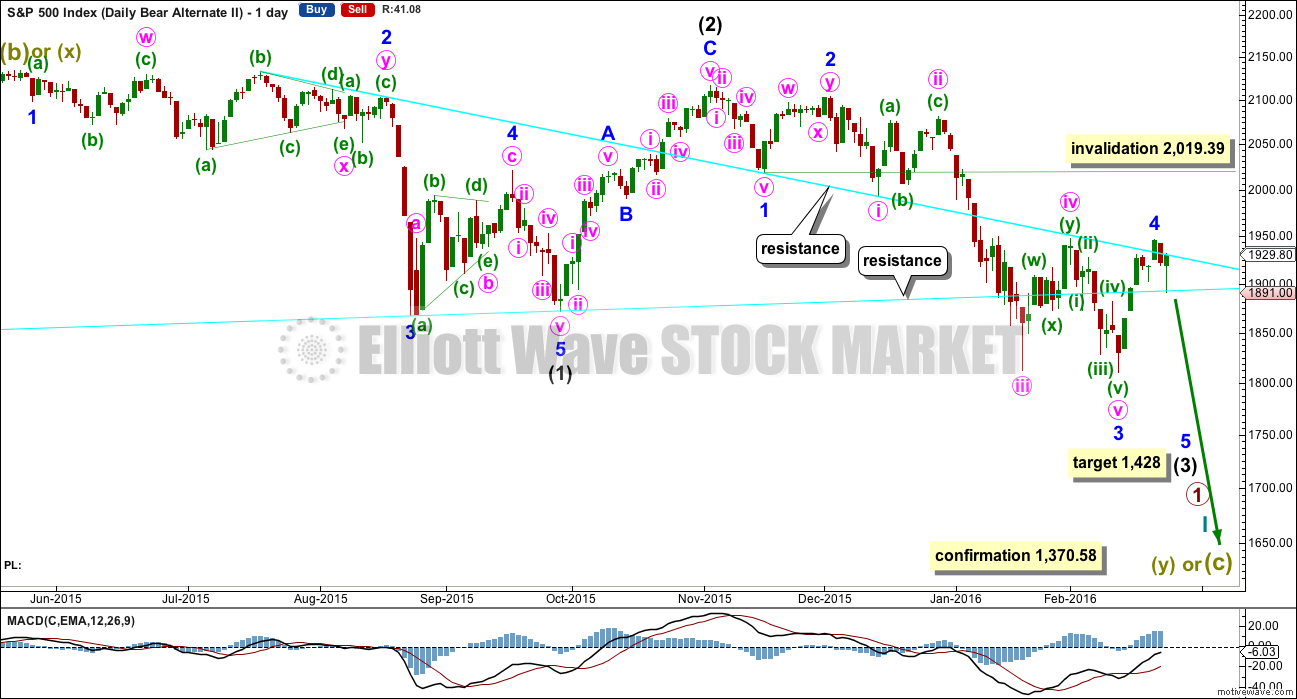
Click chart to enlarge.
I have previously noted this idea in the text and now it is time to chart it, so that the implications are clear.
Within the downwards impulse unfolding, it may be that intermediate waves (1) and (2) are complete and now minor waves 1, 2 and 3 may also be complete within intermediate wave (3).
This wave count expects minor wave 5 to be extended within intermediate wave (3). Minor wave 5 should also show a strong increase in momentum, so that at its end intermediate wave (3) has clearly stronger momentum than intermediate wave (1).
There is no difference to the target for intermediate wave (3). This wave count makes a difference to the invalidation point. Minor wave 4 may not move into minor wave 1 price territory above 2,019.39.
This wave count also has a lower probability than the main bear wave count. This wave count would be more typical of commodities than the S&P.
Minor wave 2 lasted 11 days. Minor wave 4 may be over in 6 days, which is not a Fibonacci number.
TECHNICAL ANALYSIS
DAILY CHART
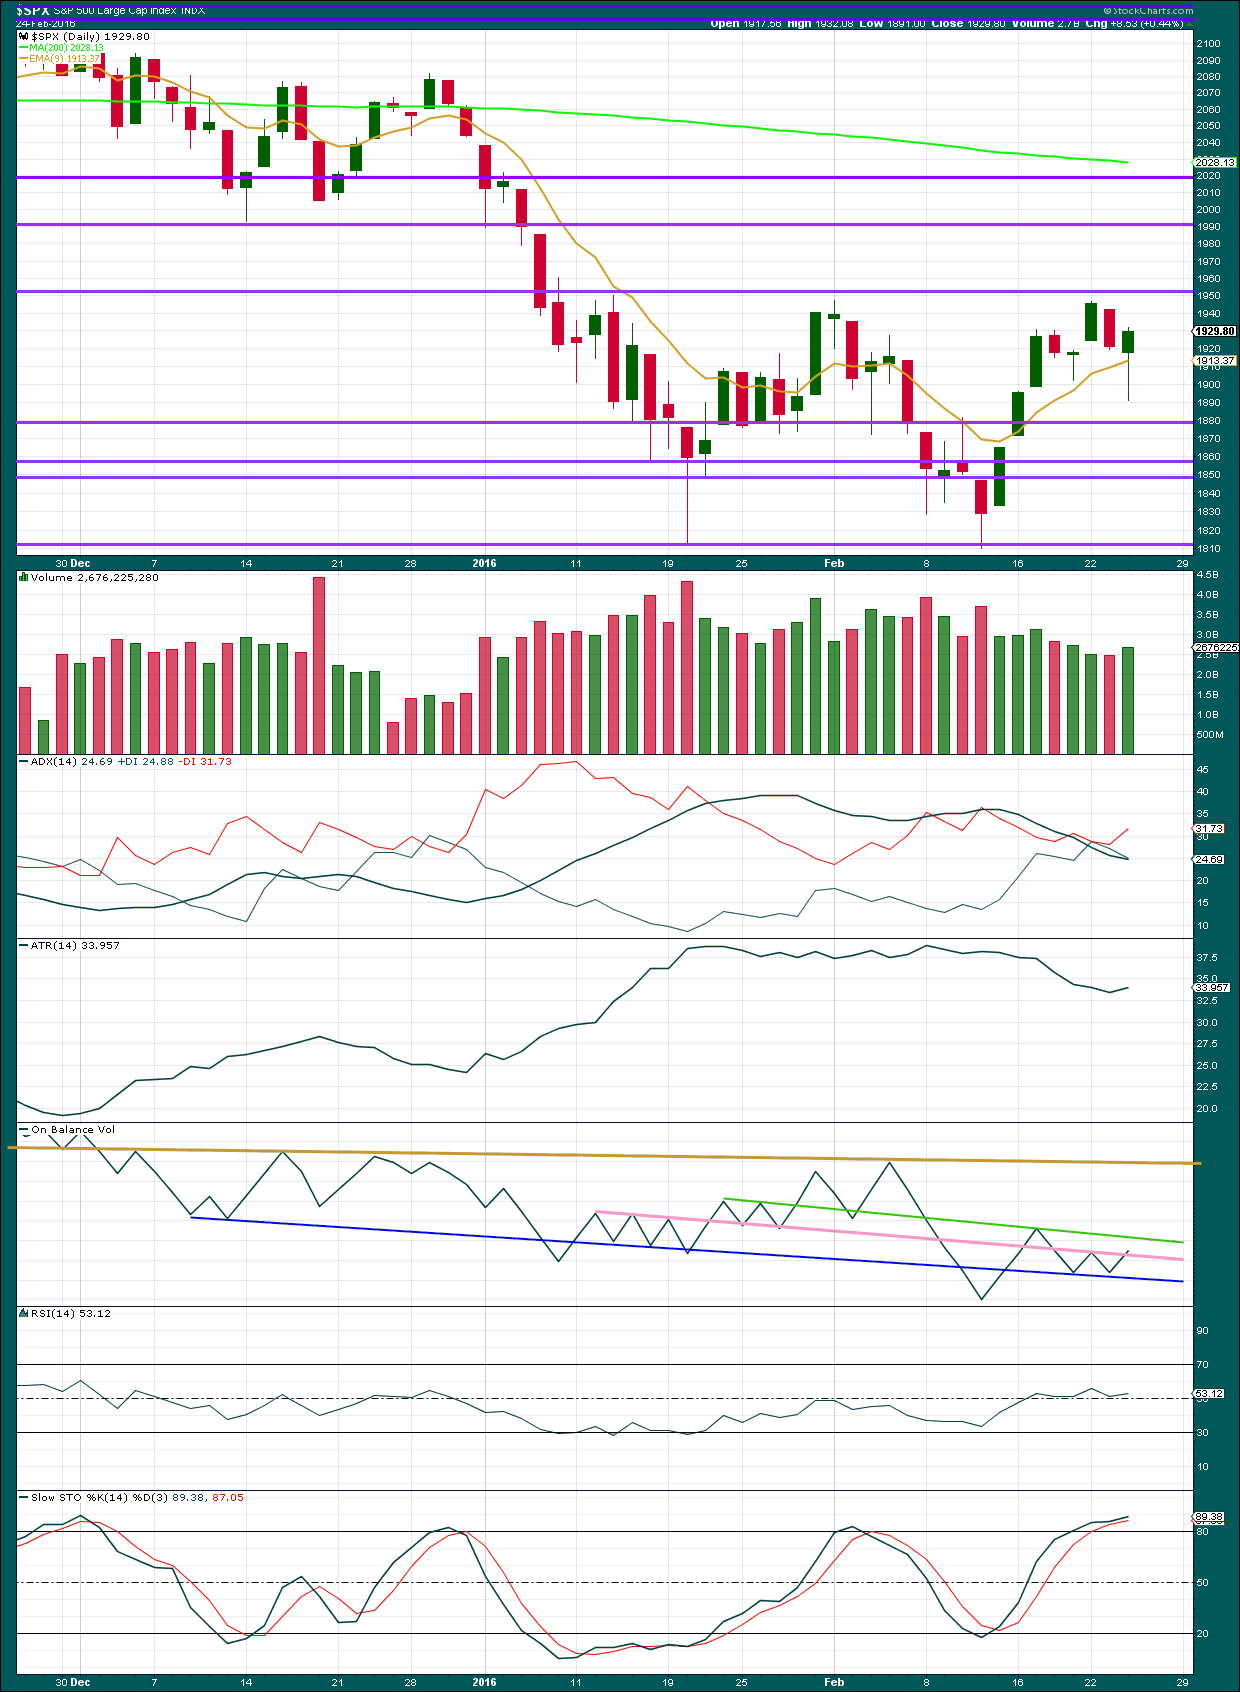
Click chart to enlarge. Chart courtesy of StockCharts.com.
Today’s candlestick is giving mixed signals. Overall, the candlestick is green with a long lower shadow, which is bullish. It comes with an increase in volume, which is also bullish. It came with an increase in breadth (the Advance / Decline line increased today, not shown), which is bullish too.
But price is the final determinator.
Today’s candlestick gave a lower low and a lower high. This is bearish.
The ADX line continues to decline indicating the market is not yet trending (ADX is a lagging indicator). Today, ATR begins to disagree as it is increasing. This may be an early indication of the resumption of a downwards trend.
The -DX line remains above the +DX line; the -DX turned higher today. This is bearish. If the trend returns at this stage it would still be down.
On Balance Volume has still not given any early indication of price direction. It remains bound within the pink, green and dark blue lines. A break above the pink line would be bullish and a break below the dark blue line would be bearish.
There is no divergence with price and RSI. RSI is just above neutral. There is plenty of room for the market to rise or fall.
There remains some divergence with price and Stochastics: as price made the last swing high, Stochastics failed to make a corresponding high. This indicates weakness in price and is bearish.
With classic technical analysis giving a mixed picture today, it may be wise to wait until the lower cyan line and 1,891 is breached before having confidence in the main hourly bear Elliott wave count.
DOW THEORY
For the bear wave count I am waiting for Dow Theory to confirm a market crash. I am choosing to use the S&P500, Dow Industrials, Dow Transportation, Nasdaq and I’ll add the Russell 2000 index. Major swing lows are noted below. So far the Industrials, Transportation and Russell 2000 have made new major swing lows. None of these indices have made new highs.
I am aware that this approach is extremely conservative. Original Dow Theory has already confirmed a major trend change as both the industrials and transportation indexes have made new major lows.
At this stage, if the S&P500 and Nasdaq also make new major swing lows, then my modified Dow Theory would confirm a major new bear market. At that stage, my only wave count would be the bear wave count.
The lows below are from October 2014. These lows were the last secondary correction within the primary trend which was the bull market from 2009.
These lows must be breached by a daily close below each point. So far the S&P has made a new low below 1,821.61, but it has not closed below 1,821.61.
S&P500: 1,821.61
Nasdaq: 4,117.84
DJT: 7,700.49 – this price point was breached.
DJIA: 15,855.12 – this price point was breached.
Russell 2000: 1,343.51 – this price point was breached.
This analysis is published @ 10:04 p.m. EST.
Lara,
Are you absolutely certain that your IP theft is through a member account and not someone working at the hosting service provider using back door?
IP theft…this should be interesting…did I miss something…I don’t recall Lara posting anything about IP theft…lol this is most definitely not related to the S&P500, trading, etc…
Lara posted something about this today at 1:39 PM.
Wow…I guess I did miss something. Sucks. Not cool…Not cool at all…
So many times folks just rant off in here (equally not cool) that I’ve stop reading a lot of things that seems like a rant…
Lara, please let us know if there is anything that we can do to help…Not cool.
There are plenty of steps that can be taken to catch the person out. I’m sure Lara is already onto it 😉
Copycats beware!
Lara has more than one site so it’s not necessarily this one (as far as I am aware she did not specify) – I’d like to think it wasn’t this site.
Difficult thing to stop completely – probably a case of playing wack-a-mole now and again. From a personal point of view – it’s not good our trading intentions / wave counts to become public knowledge before we act on them ourselves.
Sure, I start to see if the “person” has both gold and S&P 500 posted. That should eliminate a lot of folks…
Then, I would proceed by taking all folks that have gold and S&P accounts one by one of the website…lol.
It’s turned us all into Private Detectives! 😉
( I subscribe to both sites! 🙁 )
lol Olga, I am just kicking myself in rear-end. I should have taken my 45k profit off the table yesterday morning. That is not bad for two days’ worth of “work”…
So, I am trying to be happy being a self-appointed honorary detective…lol.
Fairy nuff 🙂
off*
Bears make money…
Bulls make money…
Pigs…
…are tasty on the grill….! 😀
(with deepest apologies to the vegetarians on the forum)
lol they are…
I have found using short term hedges to temper the draw-down on my main short position during counter-trend rallies works very well. If you are convinced, as I am, that the trend in the market is down, and in fact that a lot of evidence shows that we are at the fore-front of what may be a huge market decline, you really do want to get positioned and batten down the hatches. These manic counter-trend rallies are going to continue all the way to the bottom so we may as well get used to it. If on the other hand you think that new highs are a genuine possibility, then of course it is prudent to adhere to tight stop losses and exit when the market moves against your position. Like Joseph, my plan is to sit tight on my main short position and scalp the upside swings on days like today. He’s been in the short trenches since last May! The man has some staying power. Obviously, I know not everyone is comfortable with this approach and clearly risk tolerance and personal conviction will play a critical role in how we decide to play what’s ahead. Best of luck to everyone in the coming weeks!
Thank you for sharing your strategy Verne. Most helpful to may I am sure, myself included.
Most welcome Lara. I know the stress of repeatedly being shaken out of short positions in a downtrend by these ferocious counter rallies. Thanks to your stellar analysis, coupled with my own due diligence, there is no doubt in my mind where this is ultimately going. While I fully understand that there is nothing certain in life, some things are more certain than others. I think I know a bear market rally when I see one, and the current price action qualifies in spades. As you adroitly pointed out, the key is surviving the rallies- giving oneself an abundance of time and an absence of leverage is one viable stratagem. Here’s to surviving the whipsaw, by whatever means necessary! 🙂
I appreciate you sharing as well Verne. I also prefer holding a position when the probability of a large move is high. One way I like dealing with these counter trend rallies is to ring the cash register when a strong move occurs in the direction of my trade. After the drop in December and January I took profits on 25% of my position and paid myself. I have reinvested some of that now and will hold again until the next large drop occurs. I am also prepared to exit if I am wrong, but I give the positions plenty of room. Wishing you and the rest of the group a very profitable year!
Hi Lara,
As you know I’m perusing the SP analysis for the week to help me determine my own interest here. I’ve much enjoyed the chat comments today, and, I am so sorry to read about the theft(s) that occurred. IP is BIG on my list of privacy MUST HAVES. . .
My question on EW– (You know I’m novice, so don’t laugh). Since the daily combo is expecting upward movement, is there a way to see the move up from Feb 11th as impulsive? (Iknow, that overall chart expects larger wave direction different than almost
e v e r y o n e right now. ) Your imput is valued.
Thank you Deanna.
Re your EW question: yes. where I have subminuette wave a for my alternate hourly bear that could be a five wave impulse up for a first wave.
Then an expanded flat to the low of minuette wave (x) at 1,891.
And todays upwards movement would be another first wave, within a third wave impulse upwards.
But as you know, I have absolutely no confidence in that alternate very bullish wave count. Which is why I’m not providing an hourly chart for it.
Does anyone have volume figures for the S&P?
Or direct me to where I can find them?
Trying to decide how much short exposure to have overnight. Wave might be close to completion – gap down tomorrow.
But also poss major upside potential. Cannot make a decision without volume really. Don’t want to get locked into a gap up rollercoaster if I can help it.
Using $TVOLSP which says S&P 500 Total Volume…
Todays up move is on lower volume than yesterday 587145.00 Today vs 666635.14
I assume you add zeros to this… no notes or explanation.
The important point is that it is lower today.
looks like 5.9 million on S&P today
Many thanks Joseph and Barry – clearly the rise in price is not supported by volume.
Your welcome. My problem with the volume argument is that when you look at a monthly chart going back to 2009 when the S&P was around 800 – the volume has decline big time from those levels yet we are over 1000 S&P points higher. RSI on the monthly level was ‘overbought’ for pretty much 2 years straight 3/13-2/15. I’m starting to really question these indicators and their overall value relative to price. At the end of the day, price pays.
Agreed – price totally rules for me. But when I’m on the fence with price (like at the possible end of a move), it’s good to have other indicators to tip the balance of probability one way or the other.
When all said and done – if price says I am wrong then I’m wrong.
I’m wary that we are possibly only in wave a of the double zig zag with b and c still to go.
RSI div. (and now Volume) might be indicating that b is about to begin even if the second zig zag is not yet over so it might be worth hanging onto the rest of my shorts and seeing how that plays out.
Hence my interest in volume.
To clarify the above – I meant we could still only be in wave a of the second zig zag of a double zig zag (so Wave A of Wave Y).
That said – the sideways correction today might have been Wave B of Y, so we might be close to completion.
I have about 590 million on SPX.
From StockCharts data:
Volume for today 2,321,536,512
Yesterday 2,678,629,632
Final wave up to shake out remaining cubbies. Loaded last of short term trades. 🙂
I added as well via options. Need to break big below 1810.10 for big profits on them.
I added at the end of today as well.
I am out of all my short positions awaiting further evidence as to market direction short term of course. Small manageable loss. Can’t win them all. Just make sure the losses are cut short
and there goes 1946.70
&^%@
Other service… 1960.40 as possible end “Previous 4 wave high of lesser degree”???
But their is major resistance at 1950. Lets stop here and be done with this!
They know there are quite a few stops at 1950.00 🙂
Break below lower trendline of this move up is now crucial imho – room to go alot higher now (in theory).
Still major 1min RSI Div.
I’ve lightened my short (still not totally out) – volume for today will be of huge interest.
If someone could post volume data for today whilst market still in afterhours would be much appreciated.
This things just keeps going – what goes up must come……..
94 million on SPY as of right now…low
Thanks Barry – I can get SPY volume data – but can’t seem to get data on the whole market like Lara uses.
Not sure how useful SPY volume data is?
About 590 million today. A bit lower than yesterday.
Thanks
Likely will sit on the edge into the close as they want weak bears out and more long positions bought
Or want to lock us bears into a painful gap higher….
Always a gamble (of sorts) – never dull.
Agree but volume will tell the tale, BTW what a coincidence that Feb 26, 2008 was the top before drop into March 2008… waiting… waiting
Yep! I can see the banksters scaring the you-know-what out of some folk holding short with ridiculously jacked up futures overnight. This is what banksters do folk.
I have learned to look for the wave count that best fits their personality and this manic C wave up to end the second leg of a possibly double zig zag perfectly fits the bill. Could it go higher? Maybe. But we have gone from over-sold, to laughably so at today’s close. Odds are we see 1700 before 2000….
Have a great evening everybody….! 🙂
Sorry, I meant OVERBOUGHT!
On verge of bear hourly invalidation point
We might also be on the verge of finishing the wave / poss breaking down – wonder which will happen first?
was that a kiss and run of 1946 ?
Not exactly running atm – more like a leisurely stroll 🙂
RSI Div on 1 min
We have our answer
Trying to add 2 additional option positions in SDOW at crazy bids right here…
Will see if they hit them.
Filled… just cut my average cost on the March option by half.
One down & one to go. Next is for April.
Oh Great they hit the bid on the April as we broke 1946.70… Just wonderful…
Used some of my cash/dollars position to buy more short…
And we have the thrust out of a B wave. It actually doesn’t fit as a triangle on the five minute chart. Unless its a barrier triangle with wave D above wave B… not sure you could call that trend line “essentially flat” though.
Which means that this thrust is a third wave, it may need a small fourth and final fifth up to an new high before its done.
Looks like today will close with a green candlestick. If volume is light then I would expect that may be it. And I’ll be looking for divergence with price and RSI and price and VIX closely. If I see that day to day divergence with VIX that would be nice indication that the upwards move is probably over.
I will be back after the close.
Good luck everybody.
One more push up… 🙂
Settled at 3.65. I am a very reasonable dude! 😀
good luck..i’m in at $3.70
Negotiating with MM on those UVXY calls. Moved to 3.50, he moved to 3.75. Stand by… 🙂
Volume looks light today based upon data at IBD.
http://www.investors.com
Tis good to know! 🙂
I’m back fully short with a stop at 1947.
Sink or swim time! 🙂
ahhh, that explains that big blip in the volume,, hee
Yeah – not exactly the ‘London Whale’.
More like the ‘Douglas Dolphin’ 🙂
Sweet! 🙂 Shorting these “rallies” has been the right call for quite some time now… 😀
Well that’ll jinx it!! 😉 🙂
Oooopsie! 🙂
Whoa!!!! Did anybody else see that down candle on DJI one minute chart????!!!!!!!
I am taking the money and run on those calls. Nice 25% pop.
Opened “stink bid” ( 3 bucks) on April 1 50 strike UVXY calls. 🙂
Ha! Ha! The MM moved his ask from 4.00 to 4.35 as soon as I placed the bid. He is no dummy!! 😀
NDX lagging so will probably give an early clue as to when the party’s over. If it is down 1% and the other indices, like Wile E Coyote are , are still aloft several feet away from the edge of the cliff….well, you get the message… 🙂
Well these bear market rallies really do test our patience and nerve don’t they.
Second wave corrections are designed to do exactly that, test our nerve. They convince most people that there has not been a trend change and the old trend is resuming. And they do it right before a third wave takes off. The deeper the second wave correction the more doubt about a third wave / confidence the old trend is intact. The deeper a second wave correction then necessarily the longer the third wave must be.
Because a third wave has to take price well below first wave territory so that the next fourth wave can have room to unfold and remain below first wave territory. Normally there is a pretty big gap between first wave territory and fourth wave territory.
This one is only just beginning.
Price has made lower highs and lower lows. It’s below the 200 day moving average. I do think that the low on 11th Feb being slightly below the prior swing low on 20th Jan is important.
The trick is to survive the rallies. Take them as opportunities. Manage risk so that if your entry isn’t perfect your position can survive a rally and your nerve can see your position underwater for a few days before it goes positive. That’s really hard, or at least, I know I’m finding that hard.
I still have confidence that the trend is down but I’m concerned that if we see price take out the high at 1,946.7 it may go too far above that for my position to hold on. I don’t want to have another loss right before price turns down for a big third wave. That would really suck. I am finding trading this volatile market the most challenging I have ever traded. NZDUSD is a stroll in the park compared to this!
My personal approach will be to cut shorts to the bone if we take out the high, then use the lower trend channel to get back in ASAP. With invalidations so far above it, it is too much risk (for me). There is always a chance that price will goto the extreme (very close to upper invalidation) so present a fantastic low risk entry.
I personally have no issue with trying to make a trade stick 5 or 6 times provided my losses are kept small.
Buy and hold in this market is very difficult atm imho – I’m not a day trader but at the moment I realise I come across as one as I try to find the ‘sweet spot’. Once (if) I can get a good entry I’m hoping that changes and I can do other things with my time!
The important thing for me is that this whole move up from recent swing lows looks corrective to me – so in theory even if I make a few mistakes with entry, my account should come back into profit soon enough.
Thank you both for you thoughts. I think if we break the 1947, I will close my short positions. I am still at a profit on this trade right now. But too much beyond 1947 and the losses start. Tough call especially because Vernecarty is strongly thinking a big move down will start soon.
What is that saying we post here every so often:
No one every went broke taking profits.
It gives me some sense of comfort knowing that you, Lara, find this market to be most difficult to trade. I was starting to wonder if it was just me.
Imho – this next move down will be so big that even if we miss a bit of it by being shaken out, we will look back and really not care. Key for me is to get back in as soon as price / trendlines confirm a turnaround – otherwise you’re on catch up.
On the other hand if I held short and price moved up beyond my pain threshold, then turned around – I would be pretty sore about it.
Even worse – if I held out, and price invalidated above and the wave count changed to something more bullish which was impossible to see right now. I think that probability is extremely low, but low does not mean impossible.
Nothing is impossible for this market. So I’m keeping my position relatively small to give it room to move.
Risk management. So far its one of my strengths. But ugh. The pain.
I’ve just spent my morning gathering evidence of someone taking my charts published behind the paywall for members only, and re selling my work for their own profit. So I’m in a rather bad mood. And the S&P isn’t helping.
I see waves in the ocean… I think I need a ride to chill out and get my jedi back on 🙂
Really sorry to hear that – def not good state of mind for trading.
Take a few hours out (and splash your name all over your charts!!).
You’ll feel great again soon enough 🙂
Just noticed you already splash your name across your charts so not exactly sure how they are getting away with it.
Perhaps put the watermark behind the actual waves so it can’t easily be deleted / step & repeat the watermark continuously across and down the page?
Wow, people.. sorry to hear that Lara. Hope that stops soon!! Some time off the screen should help you chill a little 🙂
That is terrible. It never ceases to amaze me that bad people are everywhere. Ever since the first sin in the garden, the whole world has been infected. Sorry, I hope the person(s) are prosecuted.
As far as my short positions, my stops are set. The market will decide if I close out my positions. I agree, Olga, that we have plenty of bear market ahead to participate and make money. I remember the saying, “Cut your losses short but let your profits run.”
As far as risk management, my current positions are too large to let them run the risk of a move above 1987. Small loss is best for now and I don’t need to get mad or grumpy.
Lara you go surfing. I go for a long hike. Those sort of activities have great benefits to the body and mind. Enjoy the waves.
Say it ain’t so! You have GOT to be kidding me. This world certainly has its share of slime-balls…. be sure to have you lawyer have a little talk with him about damages due… 🙁
I strongly suspect it would cost more to chase him for damages than I would receive. I’ll cut my losses. I just want it stopped.
My biggest problem actually is figuring out who it is. It must be a member for him to access the paid content. I can’t exactly suspend all members from that country… and so I need to know exactly who it is so I can remove and blacklist that person. That will take some detective work.
What a waste of valuable time.
Very true words indeed. It is very tempting to take legal action, especially when you know you are right, have evidence (and particularly if the accused is based in your own country).
But the only winners are the Lawyers – almost always. At best – damage seen as being caused would be contested down to low levels by their lawyer – generally much lower than your costs.
I have had a very hard lesson on this – someone stole my IP but then went bankrupt during proceedings so I didn’t get a penny despite winning the case. I lost in the region of £250,000 on that lesson and the guy who I was up against is still trading under another company (albeit no longer using my IP).
And that all took place in my country – if you are doing this across borders then god only knows !
Lessons in legal battles are similar (and as harsh) as lessons given by Mr Market imho – I have little faith in the legal system.
Perhaps Paypal data may be your best bet for identification? That’s presuming they are using their real name on the site copying your IP….
It is a bit of extra work for cesar – but he could program you site to ‘actively’ serve the charts based on the member that is logged in, so each one is secretly encrypted with a ‘tell tale’ id which can be traced back to each members account. You could put that ‘secret id’ in the watermark for example.
For fear of stating the obvious – it would need to be something that does not look out of place – is not easy to find, otherwise it would just be deleted by the person copying it. I have my ideas but will not share them here just in case the person is a member of this site.
It’s okay, I’m not actually upset by it. It’s more annoying to have to spend time to stop it, I’d rather spend time analysing markets.
Theft of ones intellectual property is a form of flattery, so I’ll see it that way.
The watermarks are still visible and he’s even tagged it with my name. So it’s actually rather easy to find. Except it’s all in another language and Google translate isn’t the best 🙂
And the criminal(s) is not jsut the person publishing your work but also includes those who pay this person to read your work. Arrrg.
1. I cannot see a five down on the five minute chart 🙁 I can see a pretty clear three down. So probably more upside today.
2. Sideways movement on the five minute chart for this session looks like a B wave triangle as Verne says…. so a final thrust up? The question is, will it make a new high or not?
Just high enough to send the bear cubbies squealing. Hang in there. I think something BIG is afoot to the downside. 🙂
I agree. I’ll give this market room to move and stop watching the little swings.
Lets see what volume has to say today… and how this session ends. Then the analysis begins…
Looking like a classic B wave triangle of some sort. After the thrust out of it….”Gentlemen (and ladies) start your engines…! 🙂
Is there anything in particular that gives you this confident analysis? I ask because I do not share your confidence. I am not opposed in any way. I just lack the confidence. I do believe we are in a bear market and the trend is down. But today I do not have confidence this next move up to 1950 or so will hold or even to 1987.
Thought I’d ask if you need something to fill your terminal boredom. (ha-ha)
Great question and I completely understand your sentiment. I guess I am so relaxed and confident because I don’t have a very big exposure to short term market gyrations as I trade options and can pick my poison time-wise. It is exactly because of the weariness and stress of the short and mid term movements of the market that I decided to move the bulk of my position into leap contracts. I have a few speculative short term positions that may get skunked if I am wrong about this last move, but does anybody really doubt where this market is going to be trading in the next three months? six months? one year? If you are short, hang tough. This thing is going South. It may be sooner (which I think) or it may be later….but it’s going South….BIG TIME!! 🙂
Then there is all that TA stuff….!!!
Thank you. I appreciate your thoughts.
Most Welcome! 🙂
Silly trade on SPY this week expiry 194 strike calls. Should be good for at least a 20% on final upside move. Yeah, I know, better than terminal boredom… 🙂
How high will SPX bounce?
Probably not high enough to warrant loosing any sleep. Reversal should be swift.
How high can a dead cat bounce?
https://www.youtube.com/watch?v=IXl13m5CQsE
(old but still good)
Dammit
Nearly spat my morning coffee all over my screen 🙂
ROFL
depends,, a big fat persian wont bounce at all. those hairless ones bounce purty good, no padding.
LOL 🙂
That’s a question for a Jedi !
It depends on his PAWS! ( “pause” get it??! he! he!) 😀
A WAR now on the upper cyan
More like skirmish…probably a lazy B…
One sharp move up to dislodge remaining cubbies and finish C of Y ought to be all she wrote…formidable resistance remains at 1950.00
FED now saying that they are partially responsible for market sell off is going to damage their credibility and that is not going to be good.
Did they actually say that??!!
FED deserves some blame
http://www.marketwatch.com/story/fed-deserves-some-blame-for-market-selloff-bullard-2016-02-25-81035252?link=MW_home_latest_news
They are fully responsible for where the market valuations are… EXTREEMLY HIGH!
Fed should NOT react to market fluctuations of their policies… That is NOT their mandate and they have NO legal basis to do that.
They MUST normalize Rates.
These are suppose to be FREE MARKETS that allow for real price discovery!
Since 2009 real price discovery has vanished!
A year from now we are going to look back at these evaluations in utter disbelief.
WTI (April) trending down 0.93% or $0.30
“Supply imbalance will take 18 to 24 months to work off at a minimum”.
No deals will be made on OPEC production… anything you hear on a possible deal is pure fantasy.
Looks like we will have about a Flat open. + – 50 on the DOW.
So whatever move we have today will be during normal trading hours without any influence or distorted reaction from the overnight action. IMO the real volume numbers will show today. The technicals will also be a real reflection of action… free from overnight reaction/distortions.
New Official US Data out this morning continues to support the Fed’s decision to continue raising the Fed Funds Rate back to normalization. So IMO 3 to 4 FF Rate increases in 2016. Very different from what the market now expects which is 0-2.
This does not mean longer term yields will no longer go lower… if the safe haven trade is in play due to falling equity markets world wide.
Joseph,
The pumpster need to tag the technical line but if you look at the TICK counts, it certainly shows a significant top and infact back in 2008 Feb 24/26 was the TOP for the markets. Interesting how the two patterns look similar.
Looking again at 6 month daily charts and all of the following have a beautiful 6 month long Head and Shoulder Patterns…
A major break of the neck line on all will also support the Main Bear Count and can leave NO DOUBT!
SPX
$DJI
NDX
COMP
$DJC
Futures:
ES
YM
NQ
Maybe others but I didn’t want to look for the symbols.
What level are you defining as the neckline for the S&P over that 6 month period?
Not exactly sure how to draw that line. But if I use the intra day low of August 25th vs the low of January 20th, the line slopes lower and today is 1800… 1798.40
What is the text book way to draw it?
I don’t know either. I’m trying to figure that out … seems there are different approaches. In some approaches it appears we would have already broken through the neckline.
I don’t believe so… the key real break is an acceleration and move below the entire pattern.
But the line may be at the closes and not the intra day low…. Closes would be 1824.44
Other ways to do it which may be a bit higher.
That real break (confirmation of pattern) needs to happen over the next week or so. Otherwise that pattern morphs into some other look.
Magee:
The neckline is drawn across the bottoms of the reactions between the left shoulder and head, and the head and right shoulder, respectively, and a close below that line by an amount approximately equivalent to 3% of price is “confirmation” or a “breakout”
Like this?
Ok great…
Thank You Lara for also charting the line.
1804.44 Today & sloping lower.
Thanks for clearing that up Lara!
While I think the market is still in a bear the question is how long will oil be held down. Oil looks oversold and a medium size bounce could send the market roaring upwards as a whole. How high this bounce will go before everyone realizes that we are still in a pickle is anyones guess.
it’s going to have to turn down now or never!
Rumor has it that quite a few folk are expecting bankster salvation in March, when a number of them are expected to make announcements, so this thing could drag on till then; not likely, but it is a possibility. Ginger-bread face (affectionately, of course!) Draghi is said to be ready to proffer a few more crumbs to the European bourses.
Looks like all the money pumped yesterday will be lost as well as the futures are being held this morning. Now Smart Beta out with a market crash given the asset valuations…:)
Hopefully I’m wrong but I found many times when the stochastic is rising or falling strong in the direction of the trend (up on daily) and also having low volume to opposite direction (down), increases odds quite a bit to continue trend (up on Daily chart).
I think you are right. I believe yesterday was an X of a developing double zig zag and we now need an abc up to complete Y. I have an open order to reload short trades at buy stop of SPX 1950. It may go a bit past that but I suspect not by much…looking for UVXY hammer…
Thank you for your view on that. I respect your opinion greatly and 1950 is okay in my book. But I do not want to get caught short on a move much higher. So thanks again.
Most welcome. If trade triggered, I plan on a very tight stop loss at 1975.00
China’s market down 6.7% , let’s see what that brings to US markets …
China’s markets down almost 4%
after hours S&P down also
my position looking better 🙂
and FTSE… Go FTSE!
Lloyds up nr 10% lifting all UK banks up.using this to my advantage gla trading today 🙂
And he slides into first!
What happened to the doc?
wow,, I’m late,, I actually do have a life you know,,