
Downwards movement was expected, but a new high to 1,948 – 1,950 was also considered a possibility first. This did not happen.
Summary: Upwards movement is most likely over. A new low below 1,902.17 would provide reasonable confidence. A big third wave down is most likely unfolding. Sometimes these begin slowly and test our patience, but keep in mind surprises may occur to the downside. The target remains at 1,428.
To see how each of the bull and bear wave counts fit within a larger time frame see the Grand Supercycle Analysis.
To see detail of the bull market from 2009 to the all time high on weekly charts, click here.
Last published monthly charts can be seen here.
If I was asked to pick a winner (which I am reluctant to do) I would say the bear wave count has a higher probability. It is better supported by regular technical analysis at the monthly chart level, it fits the Grand Supercycle analysis better, and it has overall the “right look”.
New updates to this analysis are in bold.
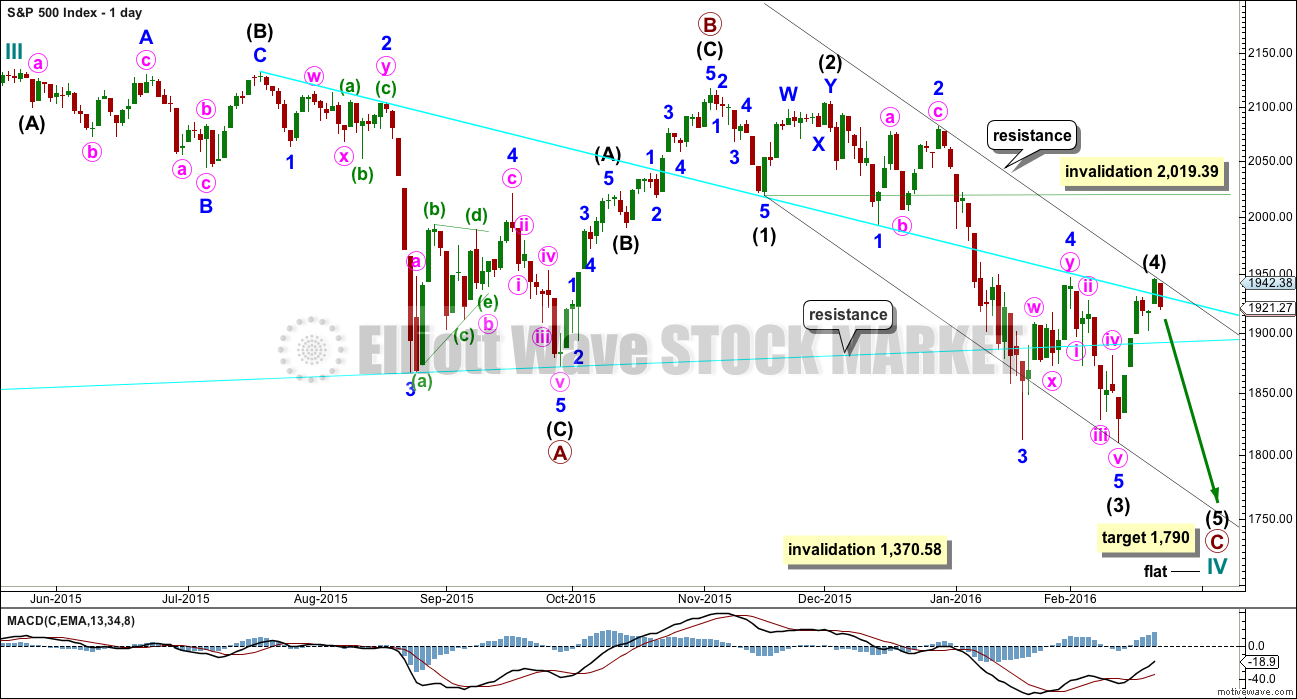
BULL ELLIOTT WAVE COUNT
DAILY CHART – FLAT
Click chart to enlarge.
This wave count is bullish at Super Cycle degree.
Cycle wave IV may not move into cycle wave I price territory below 1,370.58. If this bull wave count is invalidated by downwards movement, then the bear wave count shall be fully confirmed.
Cycle wave II was a shallow 0.41 zigzag lasting three months. Cycle wave IV should exhibit alternation in structure and maybe also alternation in depth. Cycle wave IV may be a flat, or combination. This first daily chart looks at a flat correction.
Cycle wave IV may end within the price range of the fourth wave of one lesser degree. Because of the good Fibonacci ratio for primary wave 3 and the perfect subdivisions within it, I am confident that primary wave 4 has its range from 1,730 to 1,647.
Primary wave C should subdivide as a five.
Within the new downwards wave of primary wave C, intermediate waves (1), (2) and now (3) may be complete.Intermediate wave (4) may now be over, finding resistance at the upper edge of the black channel. It is just within the fourth wave of one lesser degree still, which is a common place for a fourth wave to end.
Intermediate wave (2) was a deep double zigzag. Intermediate wave (4) may be a complete shallow 0.46 zigzag. There is alternation in depth and a little in structure.
At 1,790 intermediate wave (5) would reach 1.618 the length of intermediate wave (1). This would see intermediate wave (5) move below the end of intermediate wave (3) at 1,847 avoiding a truncation. Primary wave C would end below the end of primary wave A but not too far. Cycle wave IV would have a reasonable regular flat look.
The idea of a flat correction for cycle wave IV has the best look for the bull wave count. The structure would be nearly complete and at the monthly level cycle wave IV would be relatively in proportion to cycle wave II.
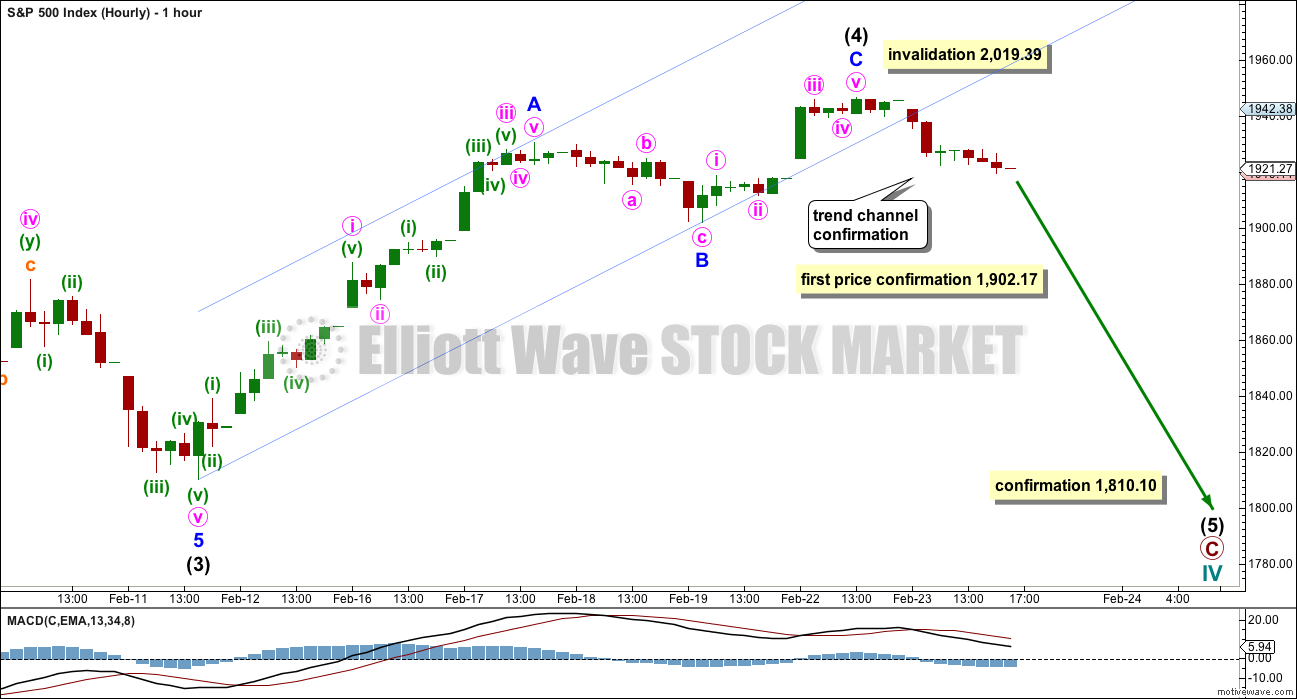
HOURLY CHART
Click chart to enlarge.
Both hourly charts are again the same, so comment will be with the preferred bear wave count.
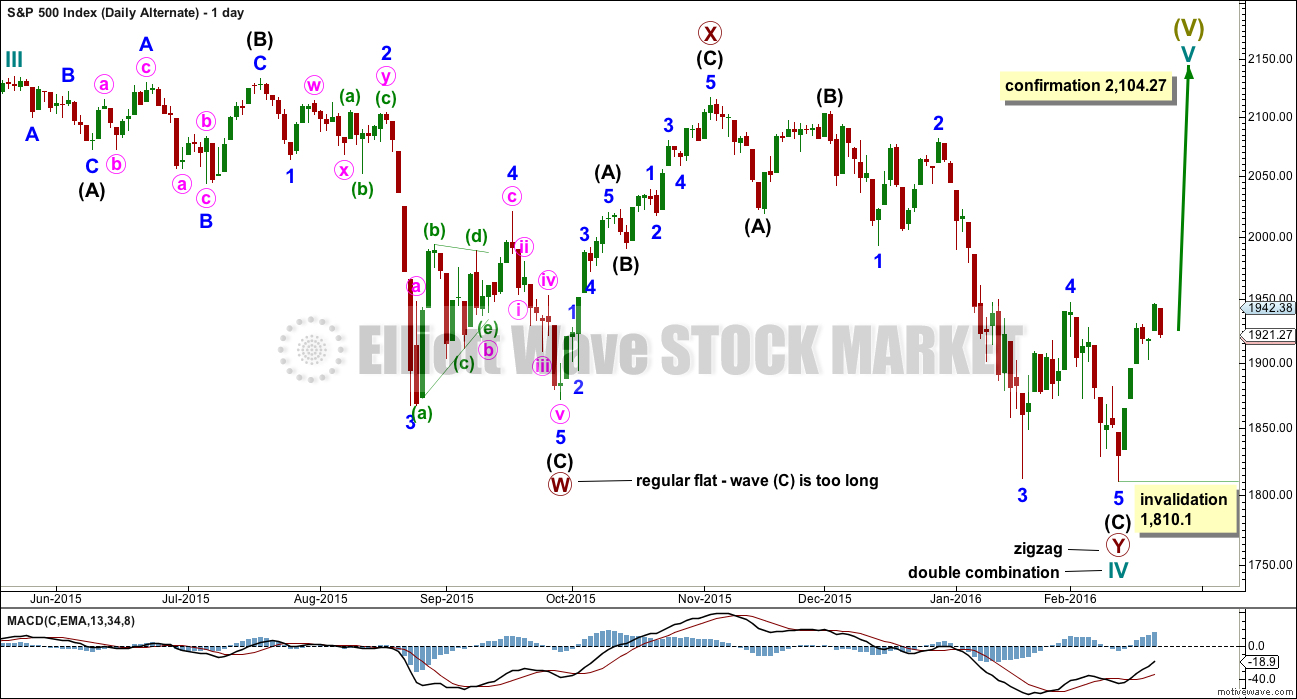
DAILY CHART – COMBINATION
Click chart to enlarge.
This idea is technically possible, but it does not have the right look. It is presented only to consider all possibilities.
If cycle wave IV is a combination, then the first structure may have been a flat correction. But within primary wave W, the type of flat is a regular flat because intermediate wave (B) is less than 105% of intermediate wave (A). Regular flats are sideways movements. Their C waves normally are about even in length with their A waves and normally end only a little beyond the end of the A wave. This possible regular flat has a C wave which ends well beyond the end of the A wave, which gives this possible flat correction a very atypical look.
If cycle wave IV is a combination, then the first structure must be seen as a flat, despite its problems. The second structure of primary wave Y can only be seen as a zigzag because it does not meet the rules for a flat correction.
If cycle wave IV is a combination, then it would be complete. The combination would be a flat – X – zigzag.
Within the new bull market of cycle wave V, no second wave correction may move beyond the start of its first wave below 1,810.10.
I do not have any confidence in this wave count. It should only be used if price confirms it by invalidating all other options above 2,104.27.
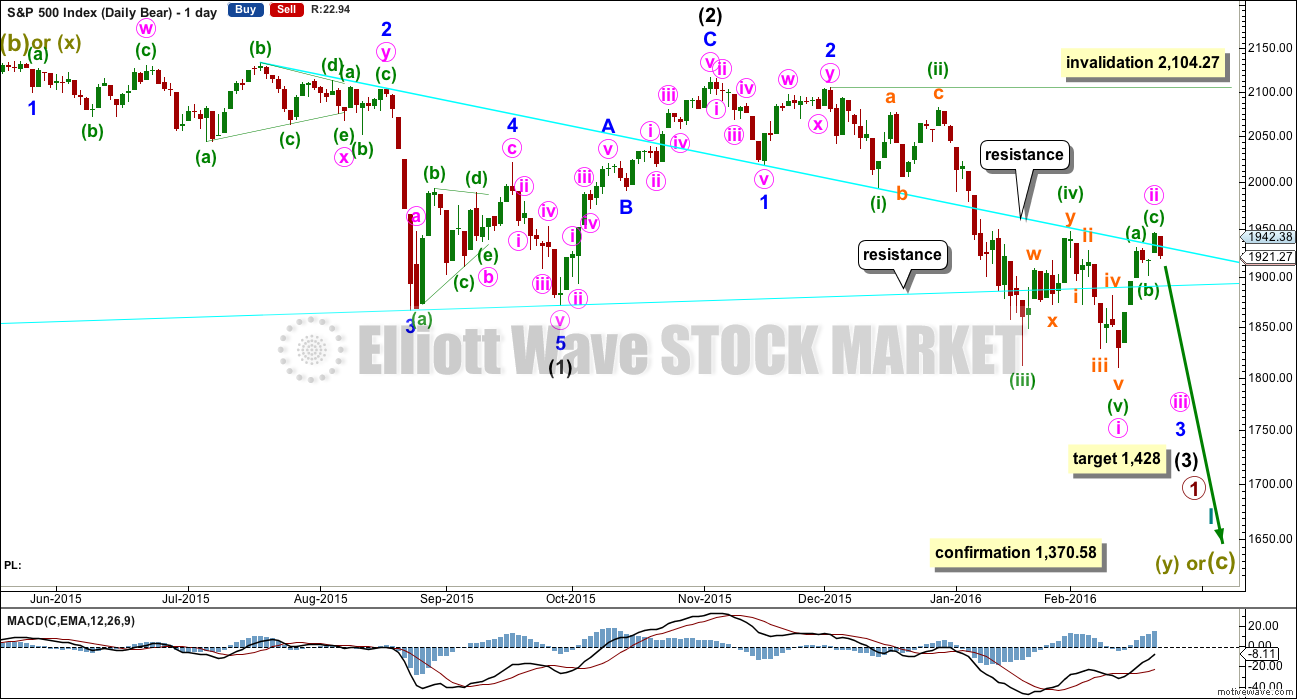
BEAR ELLIOTT WAVE COUNT
DAILY CHART
Click chart to enlarge.
This bear wave count fits better than the bull with the even larger picture, super cycle analysis found here. It is also well supported by regular technical analysis at the monthly chart level.
Importantly, there is no lower invalidation point for this wave count. That means there is no lower limit to this bear market.
Downwards movement so far within January still looks like a third wave. This third wave for intermediate wave (3) still has a long way to go. It has to move far enough below the price territory of intermediate wave (1), which has its extreme at 1,867.01, to allow room for a following fourth wave correction to unfold which must remain below intermediate wave (1) price territory.
Intermediate wave (2) was a very deep 0.93 zigzag. Because intermediate wave (2) was so deep the best Fibonacci ratio to apply for the target of intermediate wave (3) is 2.618 which gives a target at 1,428. If intermediate wave (3) ends below this target, then the degree of labelling within this downwards movement may be moved up one degree; this may be primary wave 3 now unfolding and in its early stages.
Intermediate wave (2) lasted 25 sessions (no Fibonacci number) and minor wave 2 lasted 11 sessions (no Fibonacci number). Minute wave ii may be complete in six sessions, which is not a Fibonacci number.
Minute wave ii may not move beyond the start of minute wave i above 2,104.27.
HOURLY CHART
Click chart to enlarge.
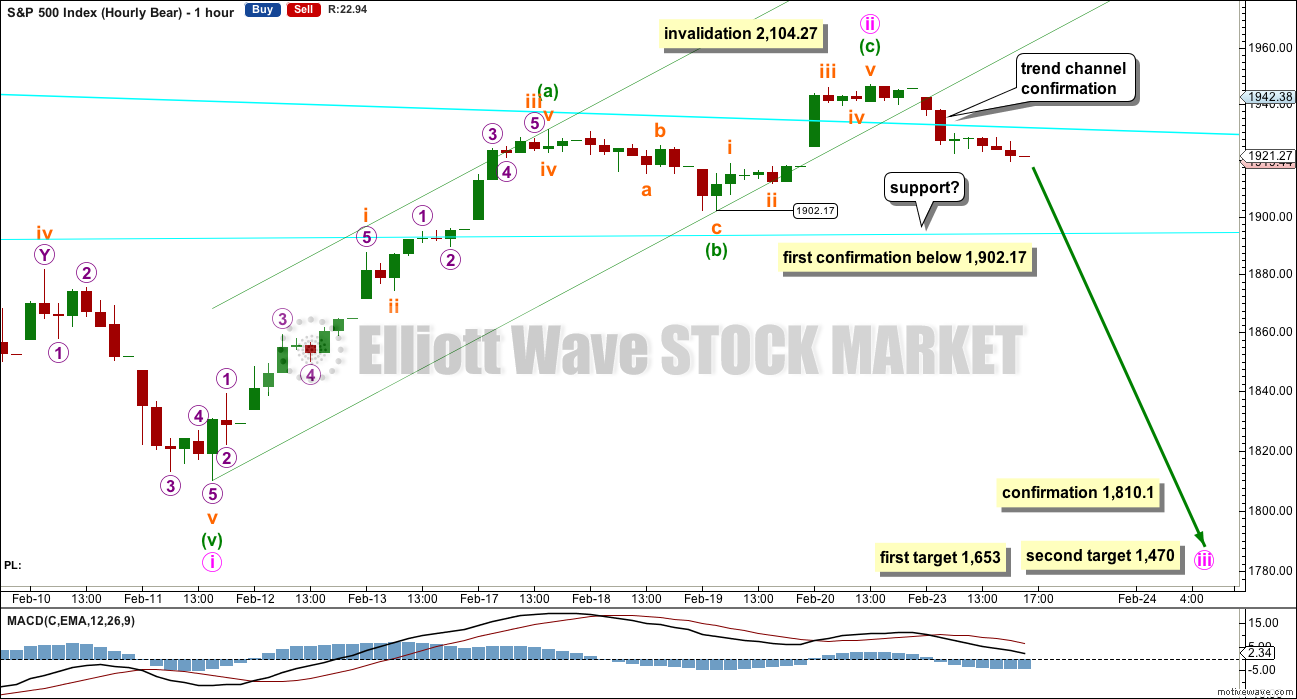
A clear breach of the channel containing minute wave ii is the earliest indication that minute wave ii may be over. However, the S&P often forms slow rounding tops. When it does that a channel is breached yet price continues in the same direction as the correction. For this reason channels about corrections are not always a reliable indicator that the correction is over for the S&P. Price is more reliable.
A new low below 1,902.17 could not be a second wave correction within minuette wave (c), so at that stage minuette wave (c) would have to be over. The start of minuette wave (c) should not be seen any lower than this point. A new low below 1,902.17 would provide reasonable confidence that the upwards correction for minute wave ii is over and a third wave down would then most likely be underway.
The next move for this wave count is a third wave at three degrees, which is the middle of a large intermediate degree third wave. The middle and end of this next wave down may be explosive. Look out for surprises to the downside.
When price reaches the lower cyan line, then it may find some support there.
When price confirms a trend change with a new low below 1,902.17, then the invalidation point may be moved down to the start of minute wave iii. For now it must be left where it is on the daily chart. The risk with this wave count today is that minute wave ii may not be over and may yet continue higher. It may not move beyond the start of minute wave i above 2,104.27.
A new low below 1,810.1 would provide final price confirmation that minute wave ii should be over.
At 1,653 minute wave iii would reach equality in length with minute wave i. This is a reasonable target, and it would expect both minute waves i and iii to be extended within the impulse of minor wave 3.
If price gets to the first target and the structure is incomplete, or if price just keeps dropping through the first target, then the next target is at 1,470 where minute wave iii would reach 1.618 the length of minute wave i.
ALTERNATE DAILY CHART
Click chart to enlarge.
I have previously noted this idea in the text and now it is time to chart it, so that the implications are clear.
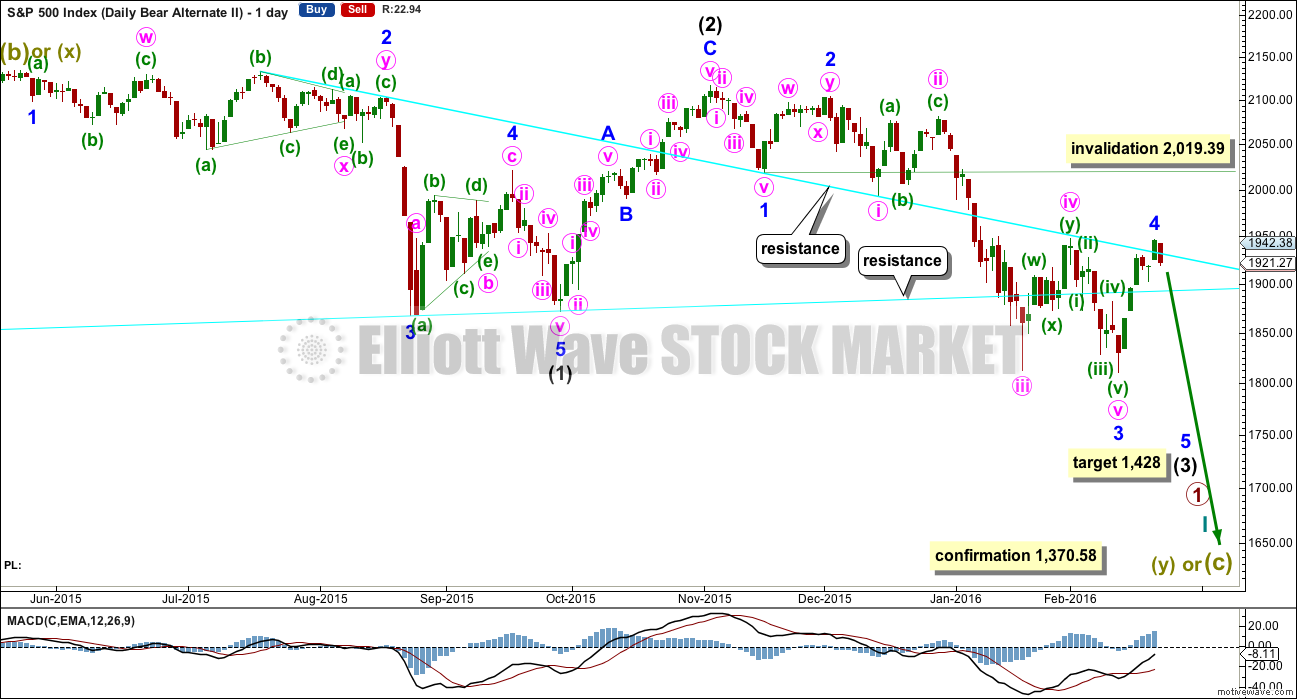
Within the downwards impulse unfolding, it may be that intermediate waves (1) and (2) are complete and now minor waves 1, 2 and 3 may also be complete within intermediate wave (3).
This wave count expects minor wave 5 to be extended within intermediate wave (3). Minor wave 5 should also show a strong increase in momentum, so that at its end intermediate wave (3) has clearly stronger momentum than intermediate wave (1).
There is no difference to the target for intermediate wave (3). This wave count makes a difference to the invalidation point. Minor wave 4 may not move into minor wave 1 price territory above 2,019.39.
This wave count also has a lower probability than the main bear wave count. This wave count would be more typical of commodities than the S&P.
Minor wave 2 lasted 11 days. Minor wave 4 may be over in 6 days, which is not a Fibonacci number.
TECHNICAL ANALYSIS
DAILY CHART
Click chart to enlarge. Chart courtesy of StockCharts.com.
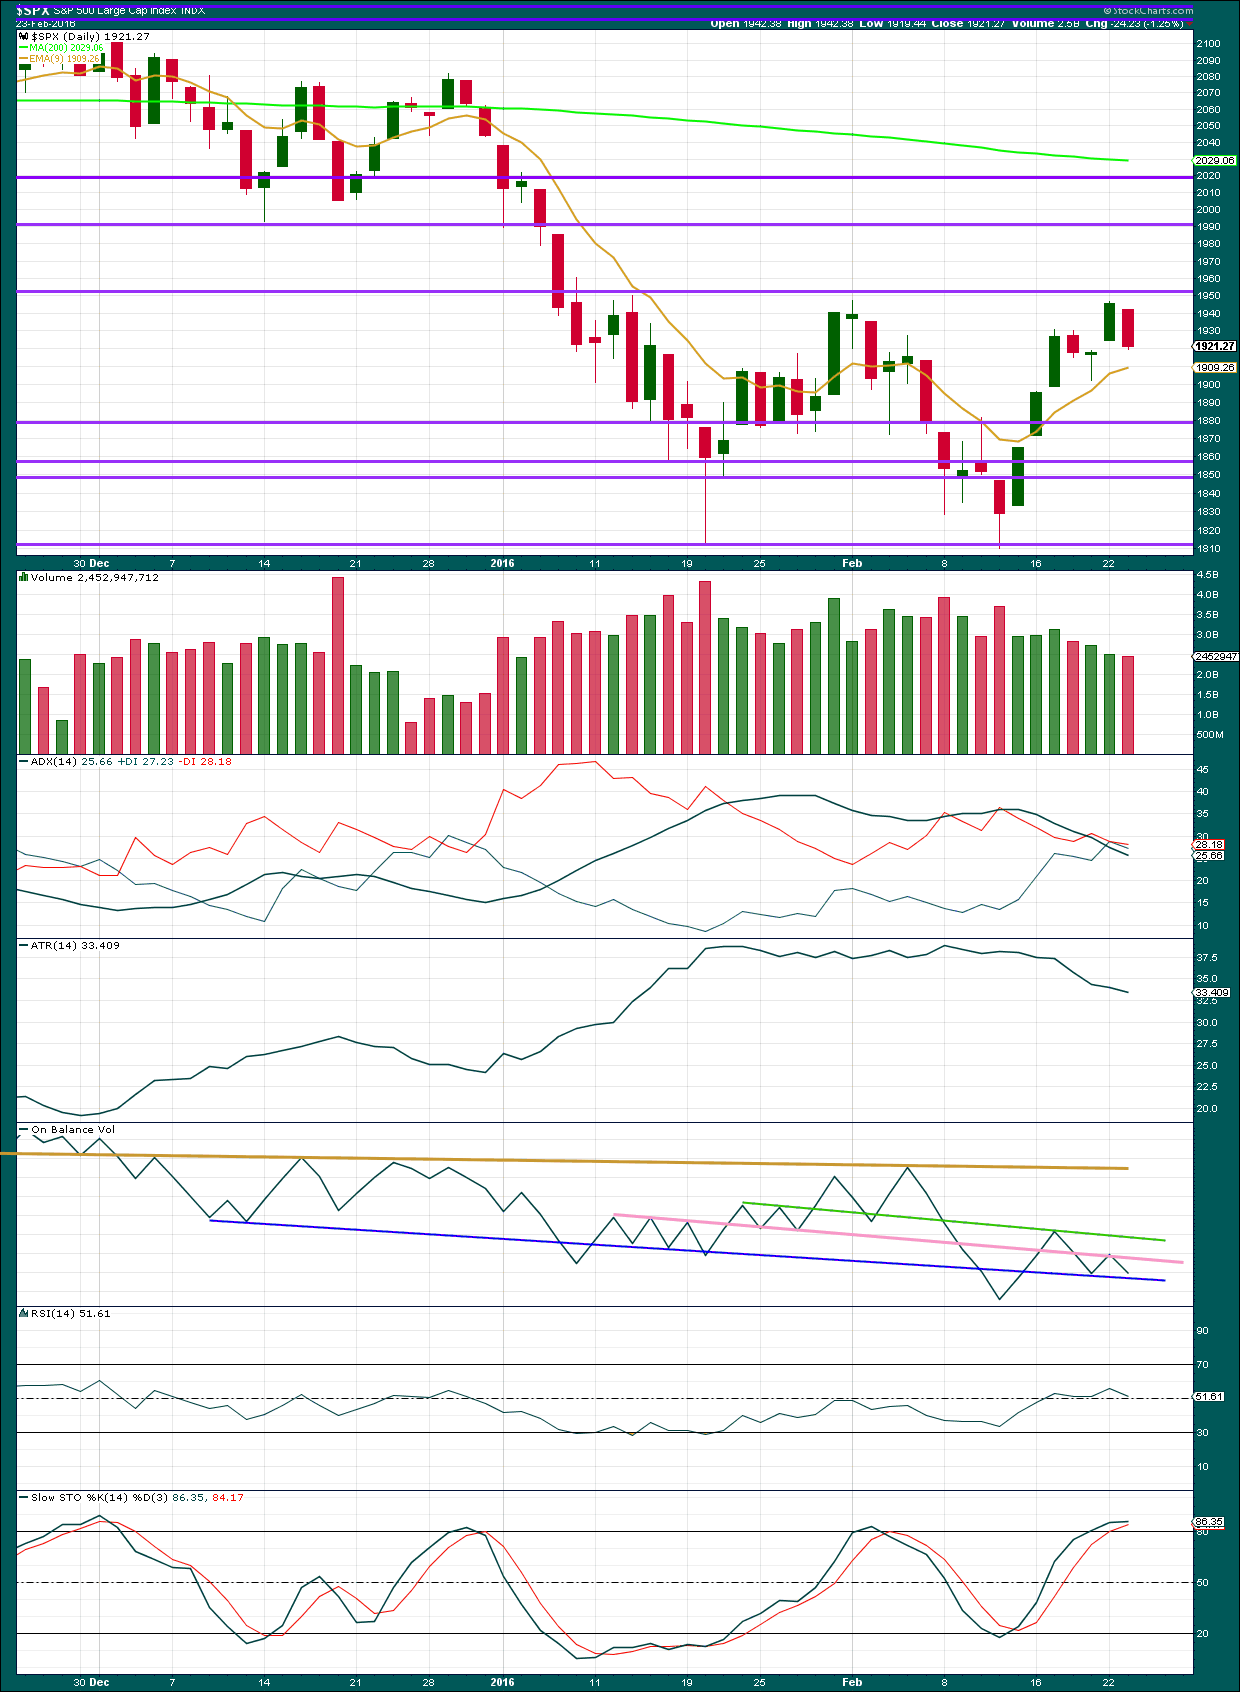
Today’s downwards movement completes a bearish engulfing candlestick pattern (the important part of a bearish engulfing pattern is the close of the second candle, which must be below the open of the first candle) even though the upper edge of the real body of the second candle is below the upper limit to the real body of the first candle. A bearish engulfing candlestick pattern is the strongest bearish reversal pattern. This supports the Elliott wave count.
Today’s downwards movement comes with slightly lighter volume. The fall in price was not supported by volume. This is only some small cause for concern. The start of the last big fall in price from 29th December to 20th January also began with the first downwards day on lighter volume than the prior upwards day. A market can fall of its own weight. An absence of buyers will force down price and a market does not need an increase in sellers to achieve the same outcome.
As price rose to the last high, it came on declining volume. A rise in price does need an increase in volume to be sustainable. The market cannot rise sustainably without increasing activity from buyers. A rise in price with a decline in volume is suspicious and indicates the movement is more likely corrective.
ADX is still declining indicating the market is consolidating and not trending. ADX has not indicated a trend change: the -DX line remains above the +DX line. At this stage, the trend should still be down when ADX catches up (it is a lagging indicator).
ATR is also still declining indicating the market is consolidating and not trending. This too is a lagging indicator.
On Balance Volume has not led the way and remains bound within the pink and dark blue trend lines. A break above or below either of these lines should be followed by price moving in the same direction. A break below the dark blue line would support the Elliott wave count.
There is no divergence today between price and RSI. Both turned lower. RSI is neutral. There is plenty of room now for this market to fall again.
Stochastics is returning from overbought.
INVERTED VIX
Click chart to enlarge. Chart courtesy of StockCharts.com.
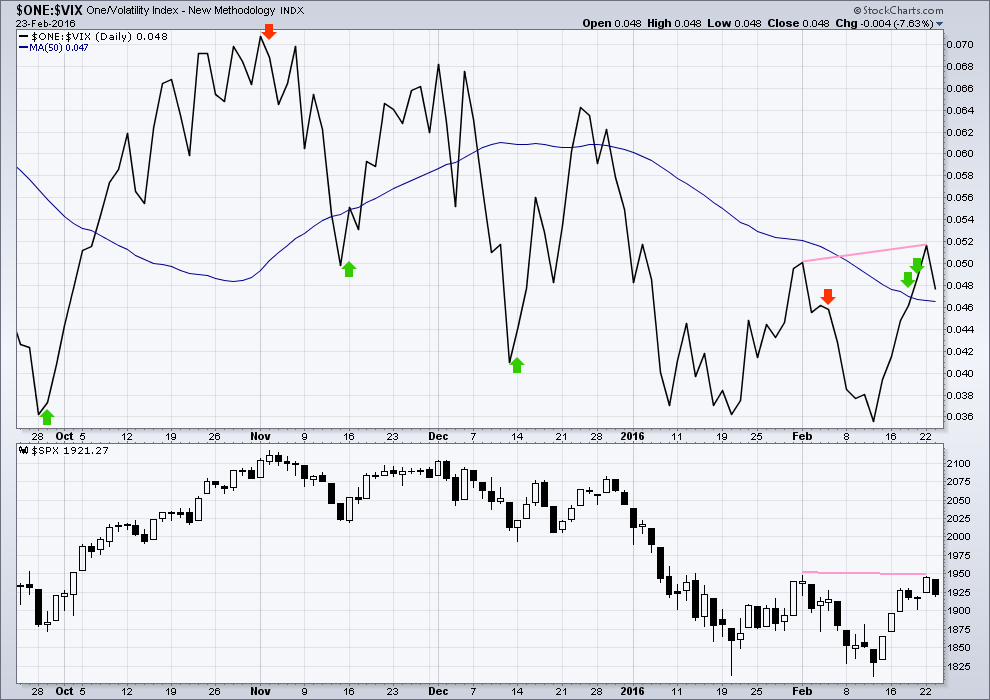
There is a longer term (still short, but not day to day) slight divergence with the last two swing highs in price and VIX (pink lines). Price has not yet made a new high yet VIX (inverted) has made a new high. This indicates weakness in price and is bearish. This may be an indication that the bear market rally is about to end here.
DOW THEORY
For the bear wave count I am waiting for Dow Theory to confirm a market crash. I am choosing to use the S&P500, Dow Industrials, Dow Transportation, Nasdaq and I’ll add the Russell 2000 index. Major swing lows are noted below. So far the Industrials, Transportation and Russell 2000 have made new major swing lows. None of these indices have made new highs.
I am aware that this approach is extremely conservative. Original Dow Theory has already confirmed a major trend change as both the industrials and transportation indexes have made new major lows.
At this stage, if the S&P500 and Nasdaq also make new major swing lows, then my modified Dow Theory would confirm a major new bear market. At that stage, my only wave count would be the bear wave count.
The lows below are from October 2014. These lows were the last secondary correction within the primary trend which was the bull market from 2009.
These lows must be breached by a daily close below each point. So far the S&P has made a new low below 1,821.61, but it has not closed below 1,821.61.
S&P500: 1,821.61
Nasdaq: 4,117.84
DJT: 7,700.49 – this price point was breached.
DJIA: 15,855.12 – this price point was breached.
Russell 2000: 1,343.51 – this price point was breached.
This analysis is published @ 10:27 p.m. EST.
Price bounced up off the lower cyan line today, and ended back at the upper cyan line.
It needs to break below the lower cyan line before we can have a decent amount of confidence in the next move down being upon us.
That upwards wave still looks more like a correction than an impulse. A zigzag. A cursory count on the 5 minute chart would be a nine… but then how many of the smaller bits do you count? It could be a zigzag. A and C would be about equal. It could be an impulse with an extended fifth wave…
I would say a zigzag would be more likely for the S&P than an impulse with an extended fifth.
Or it could be incomplete.
It is absolutely impossible to tell at this stage. Draw a trend line along the bottom of it. When its breached then its over.
The prior wave down does look like a five best. It doesn’t really look like a three very well.
If we see a new high tomorrow then it’s a double zigzag. That’s the only structure which makes sense now for minute wave ii.
Someone posted a chart showing the progress of SPX and the bloating of the FED balance sheet. With a capital ratio of less than 1%, I wonder what happens to the FED when those asset values decline by even just a teensy, weensy bit? It’s the worst kept secret that they are insolvent.
Not to worry. FED just changes the numbers and the game continues.
Sort of like unemployment numbers in the USA, 95 million citizens of working age do not have jobs but unemployment rates continue to drop (yeah right).
They are certainly going to try. The world will eventually figure it out, and they will blow up the dollar through hyperinflation. The US is going to be an economic banana republic in five years.
The Fed will keep the balance sheet as is and it will naturally run off to zero and for Bonds, wait for maturity.
What they hold are mortgage backed securities and US Treasury Bonds & Bills. The risk of default is extremely low.
Plus the Fed doesn’t have to mark to market. The Fed has made and will continue to make Hundreds of Billions of Dollars off of that portfolio.
So I don’t understand your point on the capital ratio.
Its very simple. Who pays them the billions they are making? What determines the ability of bond issuers (chief of which is the Treasury) to service their debt?
What happens to the debt when it can no longer be serviced?
Mortgage Holders fund the MBS that the Fed Owns… So us citizens who have mortgages that are part of the MBS that they own.
The US Treasury pays the interest on the US Treasury Bonds and Bills… those funds come from Tax Payers. But since the US operates with deficits… The bulk is funded with the issuance of new debt… so whoever buys the newly issued debt. That is everybody and entity worldwide.
Since the world is awash in Dollars… that day will NOT be anytime soon.
US Treasury Debt will be the last debt standing and still in high demand as a safe haven trade. If everything unfolds as this big 3rd wave predicts… money world wide will initially go into US Treasury Debt. Now, down the road that will change.
Joesph–Yes, as Europe continues to fall apart, big money flows to safety of US dollar and treasuries.
Those money flows make me skeptical that SPX can be in a Primary Bear, won’t those large money flows also push up US stock?
Would a SPX Primary Bull correction then a strong move up be more probable given big money run to safety of USA?
Why would it go to stocks?
It would go to safety. US Treasuries.
Wow! I had to leave my desk this morning at 12:30 EST which is 9:30 AM my time. When I just got back, after the close, all I could say is, ‘Wow.” I certainly was not expecting to see a 40 point near 2% rally off today’s low. I am not sure what to make of it. I am still in a profitable position but have to rethink all this tonight. Of course I am looking forward to Lara’s analysis and commentary to help. I am, like many, tiring of the drag. All of 2015 was sideways and we are still trying to get things going down. Frustrating.
Thanks to all for your intra-day commentary. It is always helpful even when read after the close. Maybe one of you can help me see why today’s rally is a stinker or head fake.
I am in the same situation as you are. I shorted the market late Monday evening when S&P was around 1941 and 1943. I was thinking about ringing the register on that profit..
Tom DeMark was on CNBC couple of hours ago talking about one more up move to go above last Monday’s top, and for the market to go down on Friday. He is not calling to go up above Monday’s top by much.
My two cents, most likely we just did a wave two up of the current wave that we are in. Third wave is to follow soon…
I am going to set up my stops and see how the price action plays out just in case if we play out an extended wave up to a new local top by a lot…
I suspect that if we are going up we will see a gap up first thing. Then the question is will it go back to fill the gap or keep going. There have been quite a few opening this past two weeks.
This could be another degree lower 1-2. I am most interested to hear what Lara writes tonight.
Same here. I missed her closing commentary today…
hmm, was that the cyan support line we bounced off of,, and now we are hugging the upper cyan resistance line? on the hourly bear chart
I noticed an article on zero hedge,, to explain the rally, apparently some shenanigans regarding POMO,,, could be why this rally stunk to high heaven as Verne said.
I know the talking heads talked about oil amongst other things…a second wave had to show up at some point. If this next wave is a third wave to the downside, it should be explosive. The current setup goes well with what could come next. It is possible that this move up cleared up a lot of weak bears, and set the stage for an outsized move…
This is why is so important to be in these moves before they actually start. Barney five coming late this morning buying up stuff close negative today after all these nice volatility out there…this next move should be interesting…nuff said…
Lower High, Lower Low.
Unbelievable SHAKE THE TREE DAY… I agree with this statement!
I still believe move is a head fake…. It would be par for the course for a gap down over night to below 1891. Look forward to all who got in today selling all day Thursday and Friday to cut losses.
I don’t think that is anyone here.
If we go back in the red, this would have been the mother of all “Shake the Trees” I have seen in quite some time…what the…%$#@#??!!!! 🙂
Very unusual nine move up today off the bottom. Lara will have to correct me if I am wrong but I think they are also considered impulsive…
A flat would be 9 waves (3 then 5). This move up could be another W2 with yesterday W1 (with extended 5th wave down to todays lows).
We are currently coming up to 76.4 fib. Move is currently being stalled by the upper trendline of this up moves channel.
Irrespective – taking out 1902 was important (imo) – even if we go higher this move up is likely corrective imho
New highs would poss make this mornings low an X wave with another zig zag in the cards to take us a bit higher.
Never a dull moment 🙂
X rated X wave, very nasty
X-actly! 🙂
There is no way I’m chasing this “rally”. It stinks to high heaven. I am ordinarily not at all averse to a quick upside trade under these circumstances but something about this move today has the aroma of Limburger…crackers anyone?! 🙂
Tens of billions dumped in today…literally!! Wow!!!
Short RIGHT NOW!
If Marlon Brando were here he would say,, “The Horror”
Talk about schizoid markets. I really feel sorry for the short term bear cubbies who are clearly being smacked around pretty good. It does seem as if even in an anticipated third wave down, the rule about leaving profits sitting in the market still applies. One cannot successfully trade this market in the short and medium term unless you are exceptionally nimble. It can be exhausting.
It sure looks like any upside move is going to be muted. UVXY should be printing a red candlestick with the size of today’s cash dump but is suggesting it may be a head fake by staying in the green. Very tricksy price action, probably smart for short and medium term traders to SOH….reliable signals in these markets harder to come by…
Vern– Is “Dent” Harry Dent? Would you direct me to his market bounce / correction comments?
Yes. And I was actually commenting on Joseph’s post this morning regarding an alert he had received from his subscription to Dent Research. Joseph gets the full monty; I only get the spartan “Boom & Bust” newsletter and no e-mail alerts. 🙂
Thanks, I like to follow Dent’s comments, had not heard he was expecting a correction.
Here are Joseph’s comments from this morning:
Joseph
February 24, 2016 at 11:56 am
The final head fake… IMO.
That started at 11:40AM… at exactly the time I received an email from Dent Research saying one last rally attempt to… (Amazing… Spike up matches Email receipt time).
“This is likely the last rally attempt to new highs, but it will fail. The S&P 500 could rally to anywhere between 1,975 and 2,040. Then we could see stocks take the most dramatic fall yet between late March and early July or so, down to 1,600 or lower. ” per Dent.
To complete the actual posting:
Now, I am sure you all know how bad this guy is with specific timing.
He does go on to hedge his bets and say…
“If stocks were to instead break back down decisively below 1,810, that would suggest this next down cycle is already occurring.” per Dent,
Does his view sound familiar?
Anyway… Comments on this welcome.
Yes, I always appreciated Dent more as a “big picture” than near term guy.
This morning’s SPY gap down is filled, and then some.
Now free to fall without looking back.
With green candle cannot be a second wave. I think we continue to wait for that elusive third down. We’re going up.
could today have been B down, now in C up?
Or double a zig-zag with a ridiculously deep X wave…
You gotta love the tenacity of the banksters! Not entirely a surprise. 🙂
Oh so strange for a third wave down. These things do not normallylook back so not sure what’s going on here…this COULD be a third wave crazy like a fox…
Blast up again, maybe we will get a March Rally to trap as many people as possible. The frustration levels will be getting incredibly high
Yep! Complete out of short term trades…again!
This market is trading very heavy and I think the bulls are out of steam Dent’s call for a significant bounce just a’int happening imo. I am now looking for a rout into the close and summary surrender of BOTH pivots. Hammer’s low needs to be taken out…
I guess not… Dent may have been right! 🙂
No pivot surrenders today. The question now is how much of a move higher…
Far to close to printing a green candle stick than I would like. Back to the sidelines
Bearish engulfing pattern on the ES 10 min. chart at the top of this 11:30AM move to now. Just missed on SPX.
Not sure how to read the difference between the two… meaning which will control move from here?
I do not think the meandering will be protracted. Either we print a green candle today, or we take out this morning’s lows.
I am not sure why they are so important but over the years I have learned the importance of paying attention to, and respecting the action around these round numbers. That attention has kept me out of many a loosing trade and helped me keep losses small when I am wrong. The fact that DJI was still a bit off from its pivot may have been an early clue to the possible bounce. Third waves down do not take prisoners and tend to forcefully slice through these kinds of resistance points with nary a backward gaze. Either it is taking its sweet time today or we are being waved a cautionary flag.
Hi Lara,
Is it breach below 1902 or a close below on the SPX to confirm a resumption of the downtrend? Please advise…Thanks.
Her answer to that question has been breach.
Thank you Joseph.
Any movement at any time by any amount below 1,902.17 adds confidence that the correction is over and the next wave down is underway.
This is because the rule I am using is no part of a second wave correction may make a new price extreme beyond the start of the first wave. So this downwards move can’t be a second wave correction within minuette (c).
Elliott wave rules like that second wave rule are based on price extremes, not closes.
If UVXY fills gap from this morning, we’re are going to get one hell of a manic move to the upside. Dumping my short term calls and will wait for the trigger. I guess I was too much of an eager beaver! 🙂
Vern,
Are you implying the upside move on to the SPX ?
Only if they hold onto the 1900 pivot. It would mean the correction would be continuing as a double zig-zag. The move down today seemed a bit deep but I am not sure if or how EW rules constrain the X wave.
It is starting to look like the bears are having none of this rally nonsense. A re-surrender of the SPX pivot into the close means I am back in my volatility calls cause we’re going DOWN!! 🙂
There’s no rule for X waves within double zigzags but I think there should be.
The second zigzag exists to deepen a correction when the first didn’t move price deep enough. To achieve this purpose the X wave is brief and shallow, with shallow the most important.
Double zigzags have a clear slope against the prior trend.
I think there should be a rule for X waves in double zigzags which should be the same as B waves within single zigzags. They shouldn’t be able to move beyond the start of the first zigzag.
This could be a double zigzag. We need a five down to eliminate that.
So I thought. Thanks for clarifying Lara!
Yep! I know the hammer at 1891 looks real impressive but I think it’s a sucker play. Let’s see if they can hold onto 1900 through the close. If they do, at least several more days of wrangling above both pivots lie ahead.
If they fill the gap from this morning I would definitely suggest taking short term profits if you have them….
A gap fill today would likely mean a gap up for the next open…
For SPX? If yes, that and probably more in the short term.
I posted the following message to the community at Portfolio123. Hopefully it will result in some new subscribers here.
I think automated trading systems are great for helping to stay disciplined and trading with a proven edge based on simulation results. I have been able to trade for a living for the past 3 years using systems I have designed here at Portfolio123 and I am grateful to Marco and this community.
My systems as well as the majority here at Portfolio123 work best in a bull market. I use the Elliott Wave Principle and traditional technical analysis to determine when the probability favours a bull or bear market. I only use my automated systems when we are in a confirmed bull market based on this subjective analysis. Right now I think we are in a confirmed bear market, so I am not trading my automated systems. Instead I am using subjective analysis to profit from this bear market. I like using 2x inverse ETFs such as SDS and TWM.
So, how bad can it get? I think we hit a major top in 2000 and have been in a secular bear ever since. The S&P500 has traced out the a and b wave of an expanded flat correction. We are now in a possible c wave down which is most likely to take out the lows of the 2008 bear market. Note how volume declined during the bull market from 2009 to 2015. This is a big warning! Volume should expand in a bull market.
I trade with the guidance of Elliott Wave Stock Market (http://elliottwavestockmarket.com). The technical analyst here is the best I have come across, and has attracted some very gifted traders to that community IMHO. I suggest checking this resource out. I have already recommended Portfolio123 to that group.
Trade Safe!
That’s very kind. And the best advertising I could ever hope for.
Thank you very much Thomas 🙂
After treading water for many weeks, my GORO calls have blossomed quite nicely; plan is take assignment of shares and take my dividend in the metal, sent for safe-keeping on some distant shore… 🙂
I feel a nasty acceleration to the decline… will begin at any moment. 1894.40 at the moment.
Poor banksters! They now have to spend more time worrying about their own balance sheets than engaging in their whack-a- bear pastime. An awful lot of folk are absolutely convinced (including some very smart people) that SPX will find very strong support in the 1750.00 area. I think they are wrong, and for the reason you cited- ACCELERATION! with all due respect to Newton’s first law…I do think they will make a desperate attempt to hold the DJI 16,000.00 pivot in a futile attempt to delay the inevitable…. 🙂 🙂
I agree… that will be the SLAP IN THE FACE point.
SMACK!! 😀
I am thinking we are completing wave four of this first five waves down. If five equals one, the target would be about 1865-1870. It could happen today because if four alternates with two, a combination, it should be a simple zigzag. I would suspect it to be faster that two as well. So today could see that and if you add extensions, perhaps more before any significant bounce. Of course, just my thoughts on possibilities.
But the good news for sure is this looks like a genuine breakdown in a bear trend so far and it very well could have legs or should I say, “hit some air pockets”! The daily MACD is rolling over and now has plenty of room to the downside. In fact, almost equal to the last big leg down from the end of Dec. to mid January. I think certainly enough to get us in the the 1700’s. Just a guess.
S&P starting to rally. Just broke thru 1902.
Yes – the rally started right at the close of the European markets, with a push off the lower bollinger band. Interesting to say the least.
At this rate, I have to wonder if a gap fill is in the cards for today.
The final head fake… IMO.
That started at 11:40AM… at exactly the time I received an email from Dent Research saying one last rally attempt to… (Amazing… Spike up matches Email receipt time).
“This is likely the last rally attempt to new highs, but it will fail. The S&P 500 could rally to anywhere between 1,975 and 2,040. Then we could see stocks take the most dramatic fall yet between late March and early July or so, down to 1,600 or lower. ” per Dent.
Now, I am sure you all know how bad this guy is with specific timing.
He does go on to hedge his bets and say…
“If stocks were to instead break back down decisively below 1,810, that would suggest this next down cycle is already occurring.” per Dent,
Does his view sound familiar?
Anyway… Comments on this welcome.
I like Harry. He does a great job calling macro-trends and a few years back when he stated his mega-phone pattern predicted the DJI would exceed 17,000.00 I was quite skeptical but he was right as we now know. His colorful language regarding the Wall Street insiders is really entertaining! SPX 2000? Maybe, but I really doubt it if the third wave down has indeed arrived…
I like him as well… but his specific timing has been bad.
Of late (last couple of years) he keeps pushing out when the move is going to begin. I cancelled his service for this reason. Today, he did it again. + One guy in his service has the direction going one way and Harry has the other direction. Very confusing with no workable charts provided.
Yep. Somebody is making a gigantic cash dump. This ought to be real interesting. If they cannot get in back into the green after blowing that kind of capital, we are going down 70 handles in SPX. This really is going to be fun to watch. It is also really weird watching leaps fluctuate by 100% over a few hours…yikes! 🙂
As during the last tussle over the round number pivots, SPX is again first to fall and there will be another dog-fight (bull fight?) around DJI 1600.00. I expect it will probably hold at the close today and the bears will demolish it with a futures trouncing overnight.
I generally like to wait for UVXY to retrace at least 50% of previous high as trigger for new spike run but I am jumping early based on EW count. Buying March 18 50 strike calls @ 5.75 or better… 🙂
ES 1896 low ~ 7:AM… the 1902.17 in the SPX will be breached in SPX as it was in effect this morning.
WTI (Apr.) Down 3.48% or $1.11
SPX 1898.25
Thanks for the update! Further confirmation that the correction is over.
SPX 1893.41
We finally have a “gap and go” on UVXY! The 10X trade is on both ways. This time I plan to take BOTH of ’em. 🙂
Whoever was sitting on that huge short position at 41.95 from last Friday is going to get smoked. Can we FINALLY ride this thing down to Lara’s target without bankster shenanigans? Or are they going to fight the decline tooth and nail all the way down. JPM is not going to be able to do as much as usual as they may need to shore up their reserves according to their own admission. I think it is worse than we know.
I know Joseph is not worried as he is (smartly) not leveraged. Neither am I 🙂
Thanks for the volatility update! What do you mean by the 10X trade is on both ways?
An insider secret for older board members Tom. We can’t let you in on it until you have been a member for at least a year…! 😀 😀 😀 😀 😀
Just kidding of course. I’ll post details when I execute on UVXY> 50.00
Haha! I guess I will have to stick around then.
Technically I have been a member well more than a year… if you add up my initial membership + my recent renewal.
Morning! Great start!
Currently working off fibs for the FTSE.
Does anyone have an hourly count?
Fib support = 5820 (1.6) and 5667 (2.6)
Here’s my best guess for the hourly count on the FTSE.
I receive from Lara adjustment each time I “descending from the road”, this is what I feel. Thank you
Idiomatic “straying from the path” perhaps? 🙂
Thanks, Lara.
Is it possible for below scenario?
In your main Bear Wave count, Minuette Wave a ended at yesterday’s top (1947). Today’s down is beginning of Minuette Wave b, and will pullback 0.382*Wave a (1895). Today’s volume is quite light, so today’s down looks like correction/pullback instead of impulse.
I’m sure you could make it fit, but minuette (a) would look like a three. It should be a five.
What would still fit though is if the zigzag I have labelled minute ii continues higher as a double zigzag. Reduce the degree of labelling one, and the completed zigzag is just the first in a double zigzag.
hello,, its 1 again
lol…
I gave that to you!
sure you did,, thanks