
Upwards movement continued as expected from the last analysis.
Summary: Upwards movement may be over here, or tomorrow may begin with a slight new high to 1,948 – 1,950. Today, it looks like the target at 1,987 was too optimistic and may not be reached. The middle of a big third wave down should begin, but sometimes these begin slowly and test our patience. Look out for surprises to the downside though; the middle is getting closer, and when it arrives it should be explosive. The target remains at 1,428.
To see how each of the bull and bear wave counts fit within a larger time frame see the Grand Supercycle Analysis.
To see detail of the bull market from 2009 to the all time high on weekly charts, click here.
Last published monthly charts can be seen here.
If I was asked to pick a winner (which I am reluctant to do) I would say the bear wave count has a higher probability. It is better supported by regular technical analysis at the monthly chart level, it fits the Grand Supercycle analysis better, and it has overall the “right look”.
New updates to this analysis are in bold.
BULL ELLIOTT WAVE COUNT
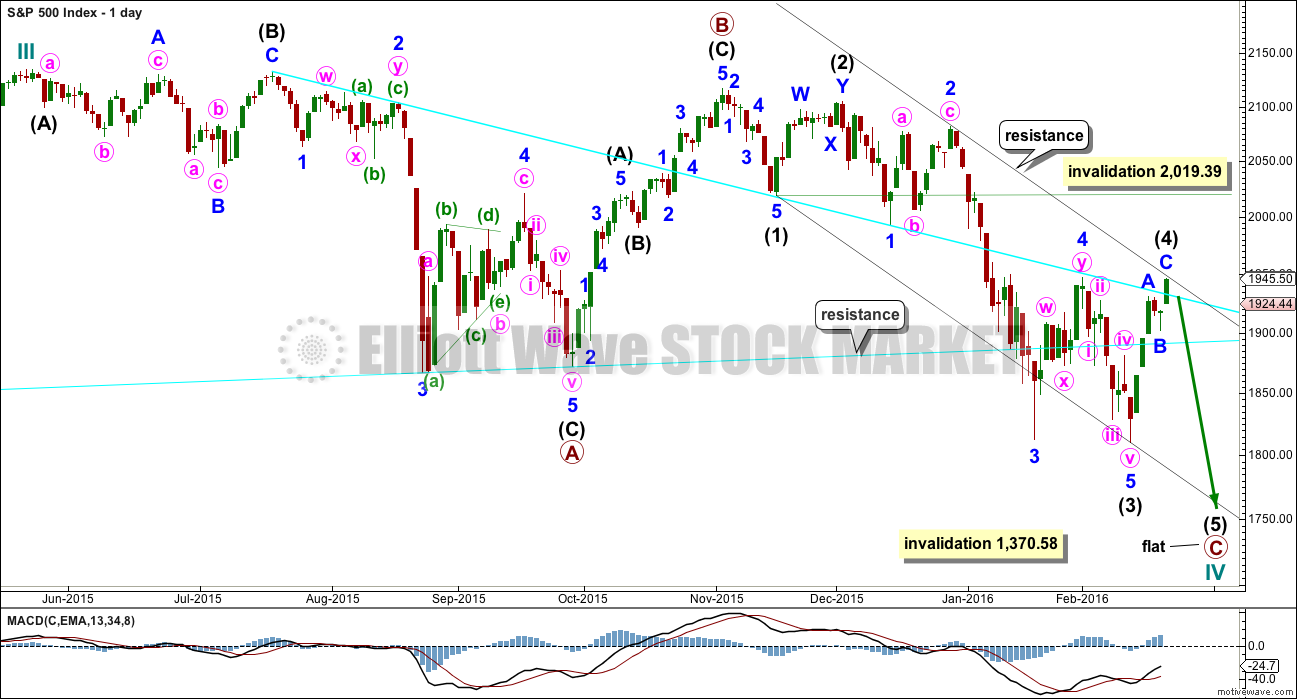
DAILY CHART – FLAT
Click chart to enlarge.
This wave count is bullish at Super Cycle degree.
Cycle wave IV may not move into cycle wave I price territory below 1,370.58. If this bull wave count is invalidated by downwards movement, then the bear wave count shall be fully confirmed.
Cycle wave II was a shallow 0.41 zigzag lasting three months. Cycle wave IV should exhibit alternation in structure and maybe also alternation in depth. Cycle wave IV may be a flat, or combination. This first daily chart looks at a flat correction.
Cycle wave IV may end within the price range of the fourth wave of one lesser degree. Because of the good Fibonacci ratio for primary wave 3 and the perfect subdivisions within it, I am confident that primary wave 4 has its range from 1,730 to 1,647.
Primary wave C should subdivide as a five.
Within the new downwards wave of primary wave C, intermediate waves (1), (2) and now (3) may be complete. Intermediate wave (4) may now be over, finding resistance at the upper edge of the black channel. It is just within the fourth wave of one lesser degree still, which is a common place for a fourth wave to end.
Intermediate wave (2) was a deep double zigzag. Intermediate wave (4) may be a complete shallow 0.46 zigzag. There is alternation in depth and a little in structure.
The idea of a flat correction for cycle wave IV has the best look for the bull wave count. The structure would be nearly complete and at the monthly level cycle wave IV would be relatively in proportion to cycle wave II.
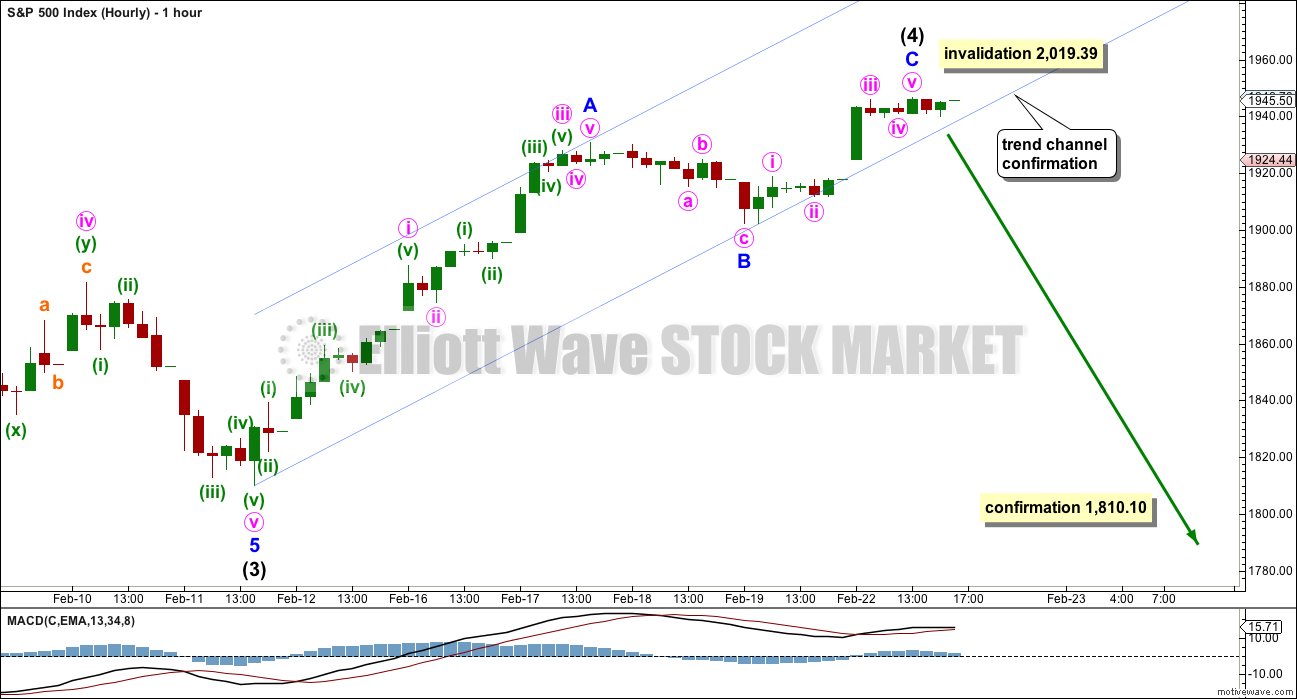
HOURLY CHART
Click chart to enlarge.
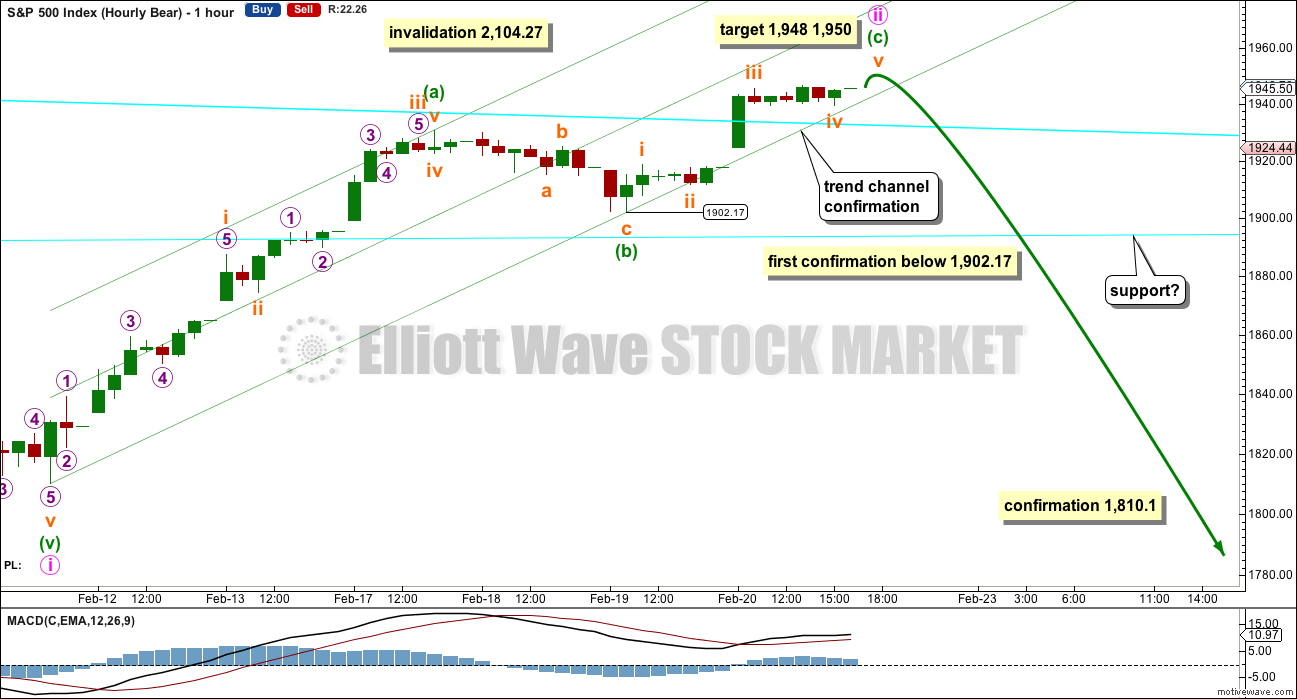
Both hourly charts are again mostly the same, so comment will be with the preferred bear wave count. This first hourly chart indicates the correction may be over, but if so the final fifth wave would be very short.
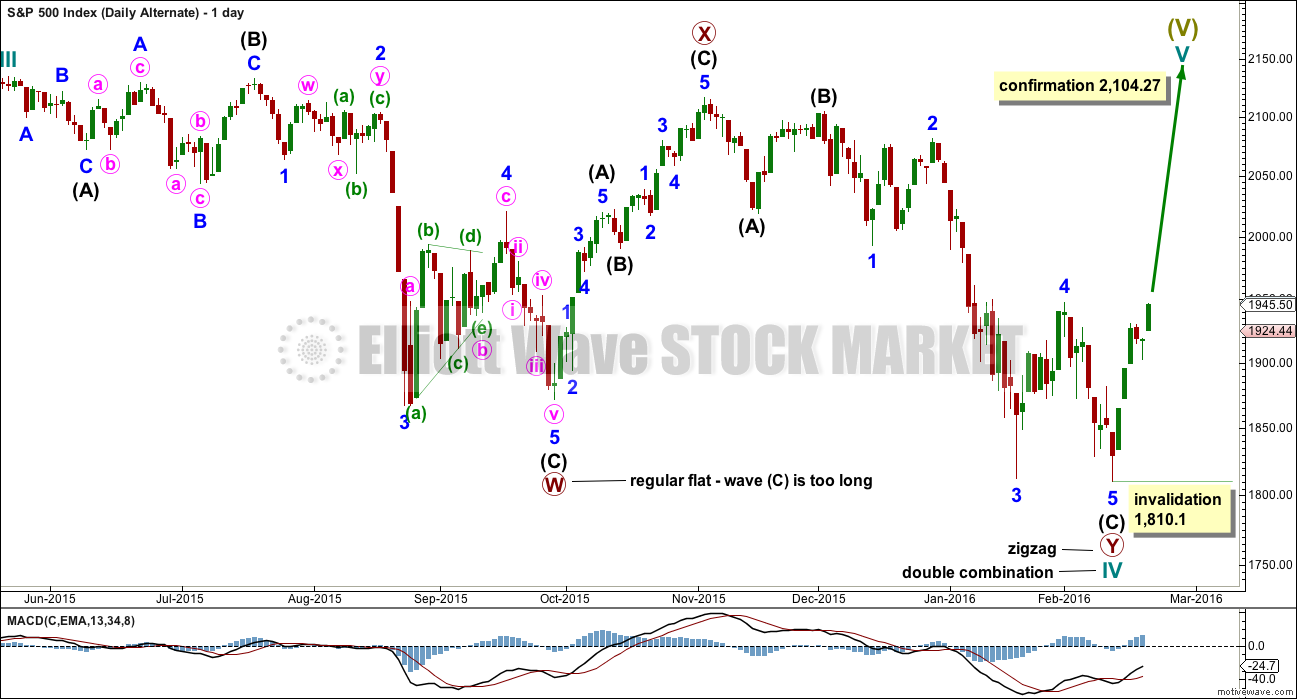
DAILY CHART – COMBINATION
Click chart to enlarge.
This idea is technically possible, but it does not have the right look. It is presented only to consider all possibilities.
If cycle wave IV is a combination, then the first structure may have been a flat correction. But within primary wave W, the type of flat is a regular flat because intermediate wave (B) is less than 105% of intermediate wave (A). Regular flats are sideways movements. Their C waves normally are about even in length with their A waves and normally end only a little beyond the end of the A wave. This possible regular flat has a C wave which ends well beyond the end of the A wave, which gives this possible flat correction a very atypical look.
If cycle wave IV is a combination, then the first structure must be seen as a flat, despite its problems. The second structure of primary wave Y can only be seen as a zigzag because it does not meet the rules for a flat correction.
If cycle wave IV is a combination, then it would be complete. The combination would be a flat – X – zigzag.
Within the new bull market of cycle wave V, no second wave correction may move beyond the start of its first wave below 1,810.10.
I do not have any confidence in this wave count. It should only be used if price confirms it by invalidating all other options above 2,104.27.
BEAR ELLIOTT WAVE COUNT
DAILY CHART
Click chart to enlarge.
This bear wave count fits better than the bull with the even larger picture, super cycle analysis found here. It is also well supported by regular technical analysis at the monthly chart level.
Importantly, there is no lower invalidation point for this wave count. That means there is no lower limit to this bear market.
Downwards movement so far within January still looks like a third wave. This third wave for intermediate wave (3) still has a long way to go. It has to move far enough below the price territory of intermediate wave (1), which has its extreme at 1,867.01, to allow room for a following fourth wave correction to unfold which must remain below intermediate wave (1) price territory.
Intermediate wave (2) was a very deep 0.93 zigzag. Because intermediate wave (2) was so deep the best Fibonacci ratio to apply for the target of intermediate wave (3) is 2.618 which gives a target at 1,428. If intermediate wave (3) ends below this target, then the degree of labelling within this downwards movement may be moved up one degree; this may be primary wave 3 now unfolding and in its early stages.
Intermediate wave (2) lasted 25 sessions (no Fibonacci number) and minor wave 2 lasted 11 sessions (no Fibonacci number). If current upwards movement is a correction for minute wave ii, then it is likely to be more brief than minor wave 2 one degree higher. So far it has lasted six sessions. It may be over now or tomorrow; it may not total a Fibonacci eight.
Minute wave ii may not move beyond the start of minute wave i above 2,104.27.
The most likely structure for minute wave ii is a zigzag. While the most likely normal target would be the 0.618 Fibonacci ratio at 1,987 (which may still be met), this second wave may be more shallow than normal. The strong downwards pull of a big third wave may force this second wave correction to be a little more brief and shallow than second waves normally are.
HOURLY CHART
Click chart to enlarge.
So far on the hourly chart it looks like minuette wave (c) may be either a complete five up or an almost complete five up. So far price is sitting in the lower half of the channel which contains this correction. A mid line is added to the channel, which may be useful to show where upward movement, if it continues, may find resistance just below the mid line.
On the five minute chart, there is not yet a compete five up for a fifth wave and not a complete five down to begin a new trend. This indicates that the last wave up for submineutte wave v may unfold tomorrow. Analysis of the five minute chart is not always useful though; to get mired in too much detail sometimes confuses (which is why I don’t publish it anymore).
The channel about minute wave ii will be important tomorrow. When the channel is breached by clear downwards movement (not sideways) that shall be earliest indication that minute wave ii is most likely over. It will not be definitive though because at the end of movements the S&P does not always fit nicely within its channels. Sometimes it forms slow curving tops which breach channels, before the next wave begins.
If the structure of minuette wave (c) is correctly labelled and if the final fifth wave up is yet to unfold, then the 0.618 Fibonacci ratio at 1,987 looks to be too high now. That would require a long extended fifth wave. This is still possible, but the probability of it is low for the S&P. So what is more likely is that subminuette wave v will be shorter than subminuette iii because for the S&P it is most common for its third waves to extend.
At 1,948 minuette wave (c) would reach 0.382 the length of minuette wave (a). At 1,950 subminuette wave v would reach 0.618 the length of subminuete wave i. This gives a 2 point target zone calculated at two wave degrees. It is not essential that this target is met. It is just my judgement that it is most likely based on structure at the five minute chart level.
A new low below 1,902.17 could not be a second wave correction within minuette wave (c), so at that stage minuette wave (c) would have to be over. This would provide first price confirmation of a trend change.
A new low below 1,810.10 on a downwards day with an increase in volume would provide full and final confirmation of a trend change. That would be a classic breakout pattern. At that stage, strong confidence may be had that a third wave down is most likely.
FIRST ALTERNATE DAILY CHART
This wave count is not invalidated but it no longer has the right look. I am making the judgement today that the probability is too low for publication.
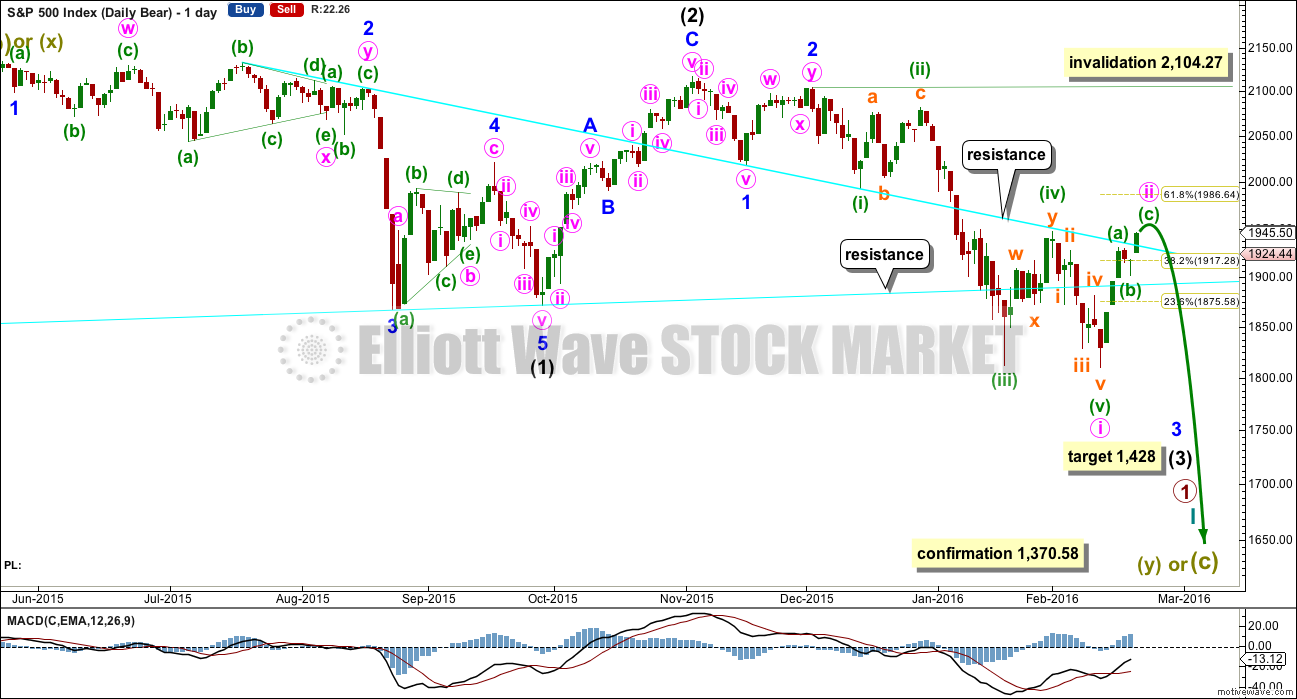
SECOND ALTERNATE DAILY CHART
Click chart to enlarge.
I have previously noted this idea in the text and now it is time to chart it, so that the implications are clear.
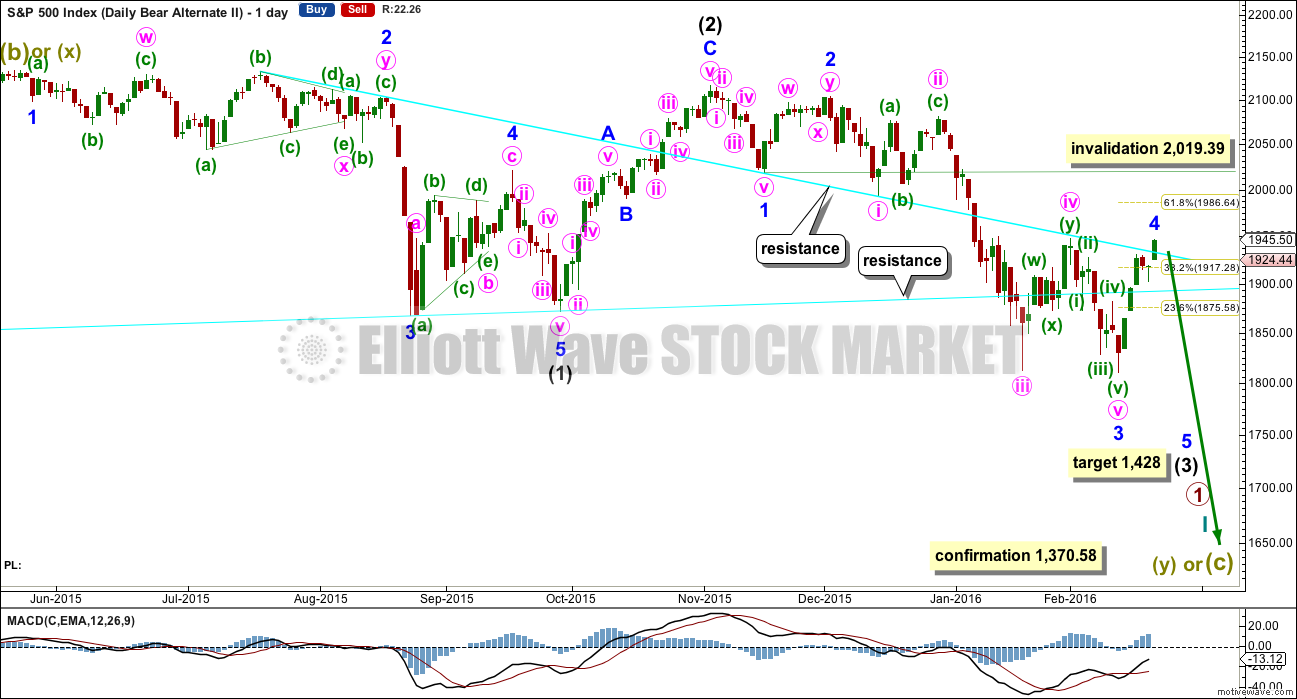
Within the downwards impulse unfolding, it may be that intermediate waves (1) and (2) are complete and now minor waves 1, 2 and 3 may also be complete within intermediate wave (3).
This wave count expects minor wave 5 to be extended within intermediate wave (3). Minor wave 5 should also show a strong increase in momentum, so that at its end intermediate wave (3) has clearly stronger momentum than intermediate wave (1).
There is no difference to the target for intermediate wave (3). This wave count makes a difference to the invalidation point. Minor wave 4 may not move into minor wave 1 price territory above 2,019.39.
This wave count also has a lower probability than the main bear wave count. This wave count would be more typical of commodities than the S&P.
Minor wave 2 lasted 11 days. Minor wave 4 may be over in 6 days, which is not a Fibonacci number.
TECHNICAL ANALYSIS
DAILY CHART
Click chart to enlarge. Chart courtesy of StockCharts.com.
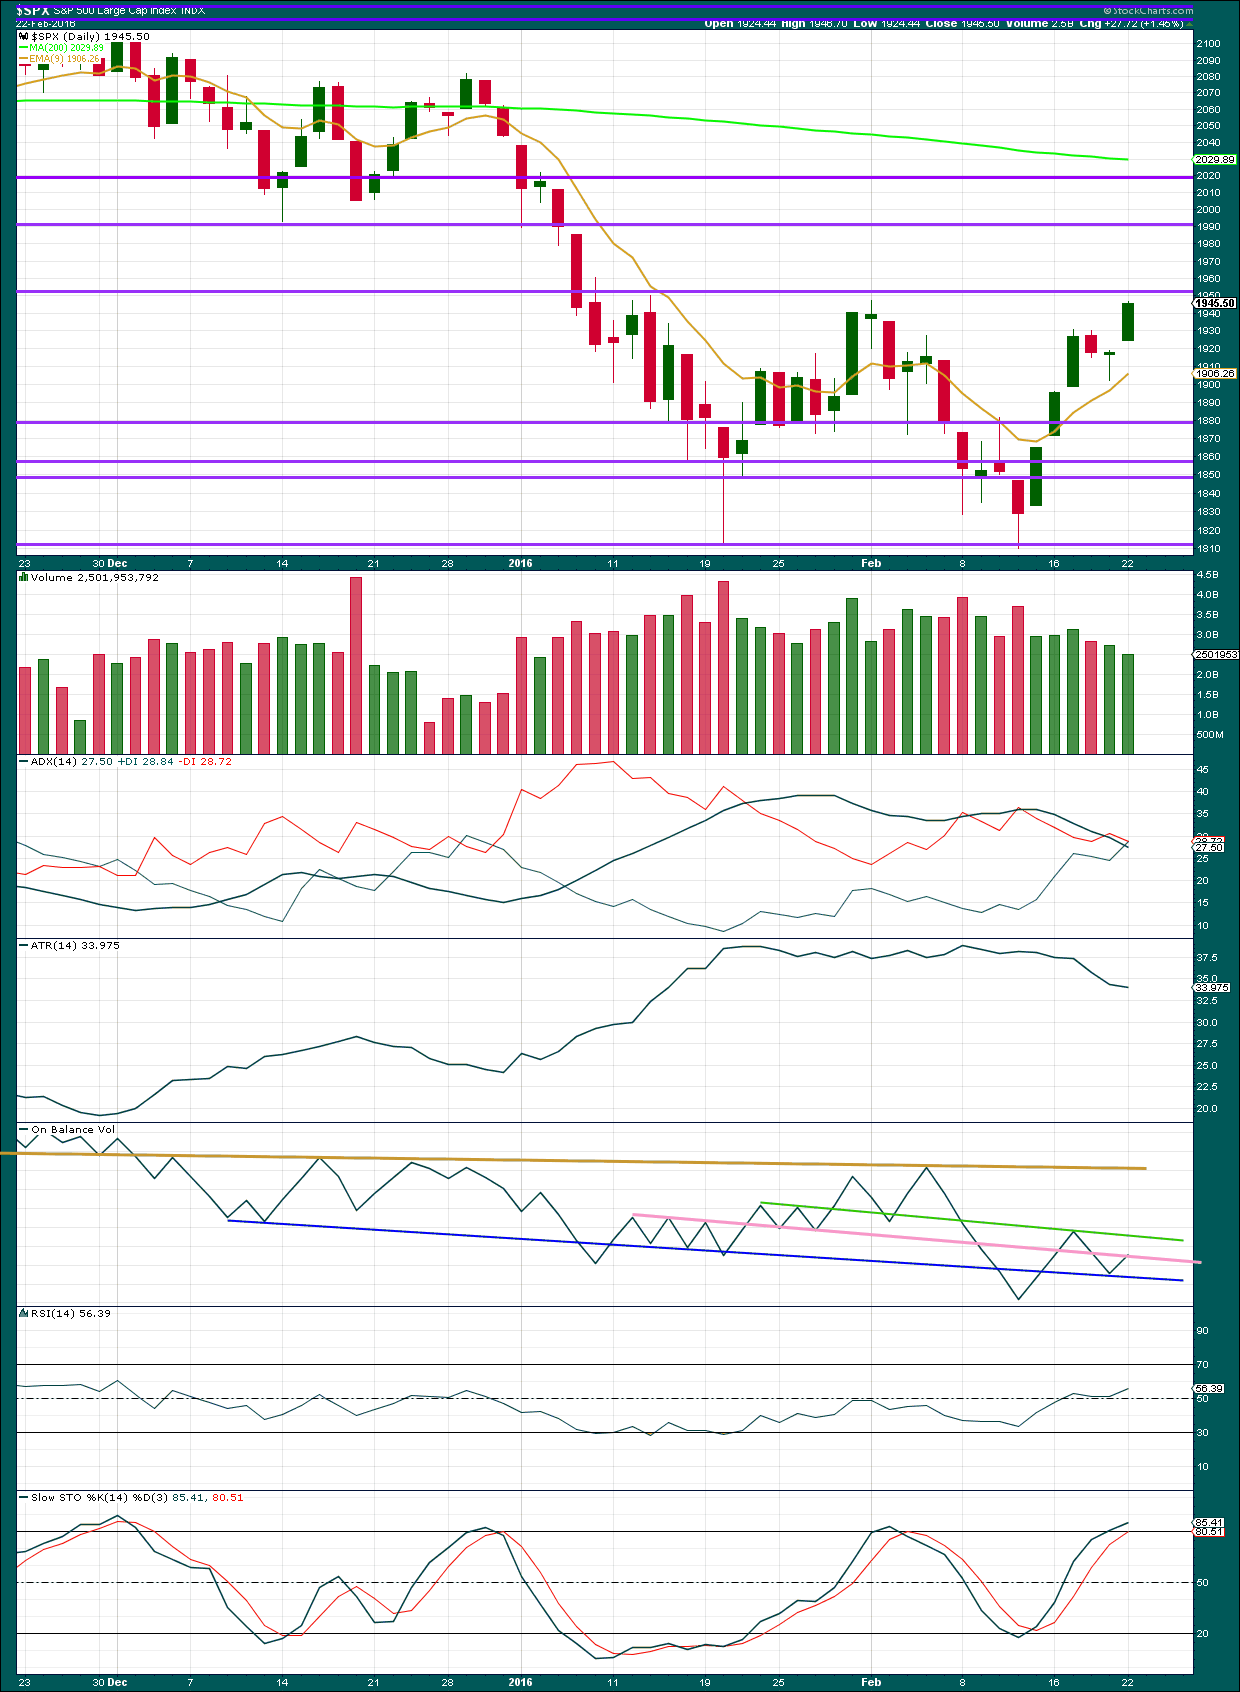
Two daily green candlesticks on declining volume is bearish. The upwards move in price was not supported by volume. This move looks more like a bear market rally than a new trend. Overall, the volume profile remains almost consistently bearish with the odd small outlier. As price falls, volume has risen. Now, as price rises, volume falls.
ADX indicates the market is consolidating. The +DX and -DX lines have come to touch today. If they cross over tomorrow, that would be a signal of a possible impending trend change. At the end of a correction though this is not necessarily reliable. Last time the +DX line crossed above the -DX line was 29th December, right before the last big downwards movement.
A cross of the DX lines is a possible indication of a trend change, but it still requires the ADX line to confirm a trend before that signal is complete. That is not the case here.
ATR is still declining which supports the idea that this upwards movement is a correction and not a new trend.
On Balance Volume has come up to touch the pink trend line. It may find resistance here, but this line has been breached before. A new green line is added to OBV. If it comes to touch this green line, I would expect it to find final resistance there and turn down. To the downside, if OBV breaks below the blue line, that should indicate more downwards movement in price.
RSI is now above neutral. There is plenty of room for the market to fall again.
Stochastics is overbought. Upwards movement should end here or very soon.
INVERTED VIX
Click chart to enlarge. Chart courtesy of StockCharts.com.
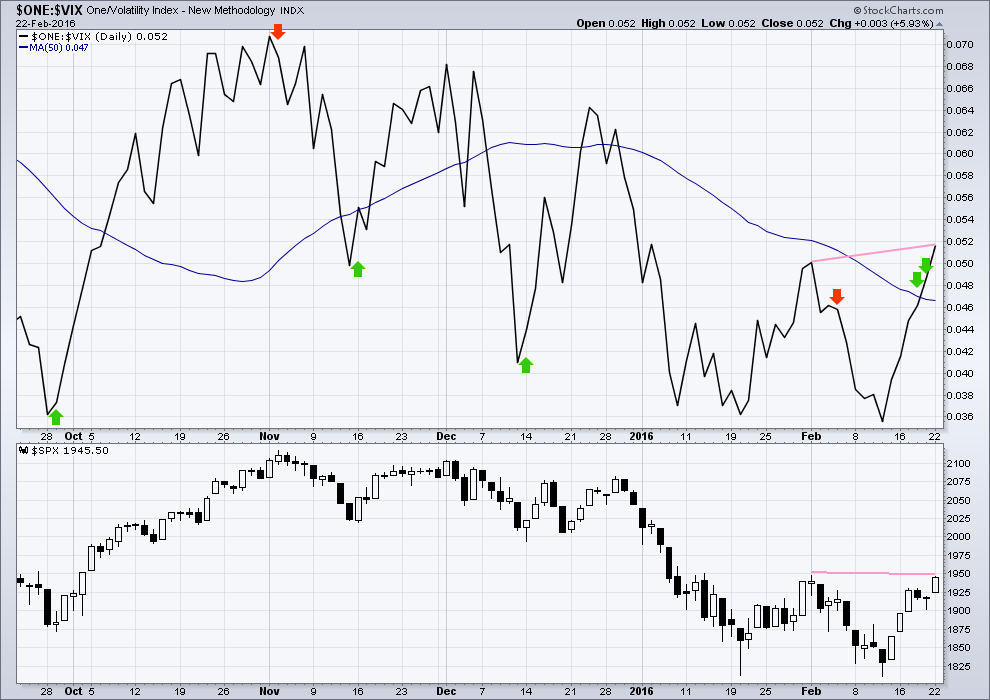
I have found slight divergence between price and VIX from one day to the next a reasonably reliable indicator of an end to a movement.
The last day to day divergence from VIX worked well. Price moved higher as expected.
Now there is a longer term (still short, but not day to day) slight divergence with the last two swing highs in price and VIX. Price has not yet made a new high yet VIX (inverted) has made a new high. This indicates weakness in price and is bearish. This may be an indication that the bear market rally is about to end here.
DOW THEORY
For the bear wave count I am waiting for Dow Theory to confirm a market crash. I am choosing to use the S&P500, Dow Industrials, Dow Transportation, Nasdaq and I’ll add the Russell 2000 index. Major swing lows are noted below. So far the Industrials, Transportation and Russell 2000 have made new major swing lows. None of these indices have made new highs.
I am aware that this approach is extremely conservative. Original Dow Theory has already confirmed a major trend change as both the industrials and transportation indexes have made new major lows.
At this stage, if the S&P500 and Nasdaq also make new major swing lows, then my modified Dow Theory would confirm a major new bear market. At that stage, my only wave count would be the bear wave count.
The lows below are from October 2014. These lows were the last secondary correction within the primary trend which was the bull market from 2009.
These lows must be breached by a daily close below each point. So far the S&P has made a new low below 1,821.61, but it has not closed below 1,821.61.
S&P500: 1,821.61
Nasdaq: 4,117.84
DJT: 7,700.49 – this price point was breached.
DJIA: 15,855.12 – this price point was breached.
Russell 2000: 1,343.51 – this price point was breached.
This analysis is published @ 10:37 p.m. EST.
Any thoughts on yesterday being the end of minuette (a) and the start of minuette (b)? This would imply that the correction is continuing and minuette (c) is still to come.
I want for the S&P’s futures market to take out 1898 for us.
ES 1899.25 low so far this morning.
If we take out 1898 in the futures market decisively, then in the cash market the next resistance levels we are going to face are 1878 and 1862.
oh my,, huge build of crude, 7 m vs expectation of 3m
Have you all read what Tom DeMark is saying today…
a top in the S&P 500 would also be confirmed should the S&P 500 finish below 1,926.82 on Tuesday, or close less than 1,917 on Wednesday or Thursday, DeMark said.
http://www.zerohedge.com/news/2016-02-23/tom-demark-warns-if-sp-closes-below-level-it-could-wreak-havoc-downside
Thank you Joseph. Good to know.
You know Joseph, Tom Demark is a very sharp guy who has made some incredibly accurate calls over the years so I hold him in very high regard. Nonetheless, the idea that we need some guru to tell us what is going on in the markets is kind of amusing to me personally. Clearly the implication is that if we don’t meet those levels on the days specified, that the bull market is alive and well! People being willing grasp at such straws tells you and awful lot about the level of stupor afflicting market participants these days. The overwhelming amount of evidence- technical, cyclical, economic, geo-political etc. etc. loudly screaming at us about what is directly ahead, absolutely makes me shake my head in wonder hearing pundits talking about “IF”…Mark Spitznagel is right on the money when he says there are no such things as black swans. The fact is that we simply stubbornly refuse to see the evidence of what is coming that has all along been in plain sight. Debates IMHO about whether this market has topped are stranger than fiction. What is it going to take… DJI futures down by one thousand?! I am quite sure that can be arranged for the benefit of chronically bullish cohorts…’ I could care not less what the market does tomorrow….nuff said 🙂
While I agree with your comments here Verne, I think the value of DeMark’s call is in its very short term timing. It provides some added assurance for Lara’s call using completely different analysis. It adds confidence.
Tom you are probably right. There are however a lot of talking heads STILL telling clueless folk to “buy the dip” and that “the correction is over”. Now I am confident that none of our members are necessarily going to fall for that toxic advice but there are many who will and take the opportunity of any short term bounces to throw away their capital. My point is that even if the market does continue higher in the short term, there are some people who will misinterpret Demark’s comments as signalling that the danger is past. So far as I can tell, Lara is one of the few analysts giving price targets suggesting just far this market can fall. I fear a lot of investors are going to be badly hurt who do not take necessary steps to protect themselves from what is very likely going to be unprecedented price action in clearly broken markets.
I do want to add my comments was in no way a criticism of Joseph’s post. I read Tom Demark’s work and have for a long time so I really do appreciate Joseph’s sharing that link. I think as you indicated, it is great corroborating info for our members. I feel badly for those who do not have the benefit of the great analysis that we do.
I don’t have access to his work and I also have been reading for years what he releases… I do find it interesting the timing of when he decides to release some of his work in interviews /publically.
One thing I have noticed is how sometimes even when he gives a cautionary not about the markets, the wall-street types will often try to give it a bullish spin . Some were trying to lull the crowd to sleep by commenting about his recent remarks “Demark says bull run may not be over yet”. For those of you who read Joseph’s link you of course know he said no such thing. His stuff is a bit pricey, but very good.
Some brave soul or souls are making a pretty big bet that the market is going higher. UVXY’s failure to fill gap at 41.95 from Friday’s close means there is still a fairly fat short position out there. (Must be somebody at IB 🙂 ) I suspect that whoever they are, they’re going to be feeling some P-A-I-N! 🙂
Ace,
A song for you:
http://youtu.be/uSD4vsh1zDA
Thank you Jack!
I was at the gym
http://youtu.be/yT1x7EbtS3g
Laters!
Cool dude.
ES hits a new low for the day at 4:15PM… 1915.25
Re-opens at 4.30PM
Analysis today will be the same as yesterday, nothing has changed.
Looking for divergence, a candlestick pattern, any support that we have had a trend change.
Volume today will be a good guide. If it increases on todays downwards day that would be strong support for the wave count.
Lara,
So far volume is quite weak. I am wondering if the move up to yesterday’s high was only 1 of c.
Peter
Yep – I’m watching for 1918 (poss 4th wave inval) and then 1902 (poss 2nd wave inval) to be taken out for that very reason.
On the chart kindly posted by Barry below, volume on first day of drop was light, so that is not definitive. Makes sense (to me) that there is no real panic just yet (until some support starts to give).
Just my thoughts – baby steps….
That’s true. Sometimes it starts out slowly.
This market is very tricky. Not sitting perfectly in channels…. sometimes threes that look like fives and vice versa….. slow rounded tops….
I’m waiting for price confirmation below 1,902.17 before I have reasonable confidence in this new downwards move.
How much we betting that the market keeps all (low degree) alternates on the table by staying above 1918.86 into the close!!
Same old, same old.
This is usually my favourite trade (but in other direction) – wait until a possible wave 4 comes up to ‘sniff’ the wave 1 – like a dog sniffing a rattlesnake – right before darting off in the opposite direction. 🙂
Very close Olga….hoping for a dump into the close.
If we can at least close below 1924.44 – I’d happily take the engulfing candlestick.
I’ve cut my short to the bone and taken profits – very close to my re-buy point here if we go down further.
I even shorted UVXY (very small position) close to the last low – but decided to close it. Pretty reckless trade here – I should know better!
My internet just went off at exacty 15:59 – talk about timing!
Based upon the engulfing candlestick pattern, I re-bought a short position, but in VIXY (was in UVXY), as half expecting a small bounce here.
Certainly don’t want to be out of the game right now just in case we gap down through all invalidation points tomorrow (the usual trick!).
Today was a good day – tomorrow will hopefully be even better.
Have great evening everyone 🙂
Indeed, it could be.
That’s why 1,902.17 is first price confirmation of a trend change.
Volume will be really important today!
If S&P can move back below 1,924.44 and close at or below that point we’ll have a bearish engulfing candlestick pattern on the daily chart. That would be some really nice indication that this wave count is on the right track.
Bearish engulfing candlestick patterns are the strongest reversal pattern.
Quite remarkable how the candle pattern from last December is being repeated. Ace was the first one to notice the similarity a few days ago and posted the chart. If the iteration continues, we should see increasing downward momentum the next two days, and a pause on Friday.
Here is the chart….and volume pattern looks similar too
That late December high was also the point we last saw a very low put to call ratio. Yesterday it was 0.58. Bearish!
While this snooze fest is playing out….
The cash I withdrew from EP Bank, I have put into PSLV (about 70%) and PHYS. They are physical allocated funds so don’t have the same issues as GLD etc (from what I have read). You can also take delivery in physical (standard good delivery bars).
Reason for bringing it up is just in case any members know of anything dodgy with these funds that I am unaware of?
Eric Sprott is among the best in the business, and probably as safe as you are going to get apart from having physical possession. When I start dealing with a new custodian of allocated assets (the only way to do it) I like to do a trial run or two and see how quickly they honor redemption requests. It should be pretty painless and very close to the written comittment.
That’s what I thought – but you never know. Always worth asking the question.
I thought the same about Schiffs bank!
(for anyone wanting to know what my issue was (and still is) with Schiffs bank I have commented on it below)
I think Peter for the most part is also a pretty good guy. It just sounds like a got a bit careless with the way he limited his counter-party risk and that is a bit surprising considering his client’s money is also at stake. I sure hope he gets that potential problem taken care of and soon. It is later than even he apparently realizes.
I think we may currently be in wave 4 of a 5 wave down from yesterdays high. W2 was sharp so this W4 will prob go sideways. If so then we should get one more stab lower before a possibly slightly deeper upwards retrace of todays move.
If we don’t go below 1918.86 before that happens then I’ll be watching structure of the move up closely. Even a 5 down from yesterdays highs *could* be a c wave down, which would mean new highs on the cards.
Imho that’s one of the main reasons for awaiting a ‘5 down 3 up’ confirmation.
Caution is indeed warranted. I am positioned far enough out so it does not matter to me, but for short and medium term traders, you really want to see a stronger gap up open on UVXY to be confident the strongest leg of the impulse down has begun. Despite today’s strong move down, it may not have arrived quite yet. A partial retrace does not imply a signal to abandon shorts positions, just an opportunity to get re-positioned at slightly better entry points. The very strong gap up open on UVXY is key.
Yeah – I would add that we are now well out of the upwards channel – so we are currently looking good.
I’ve just had bad experiences previously with S&P – it likes to break out of channels then tag along its underside to new highs (which is ultimately very bearish) or even worse – jump right back into the channel.
I think most members know by now but just in case – my comments are on a very short term horizon so should be taken with a pinch of salt particularly when it comes to anything but (very) short term trades (and then I would still paint it with a wide brush!).
And then, there are those pesky banksters. I know they are not going to alter the market’s major direction but if you are not wary, they can certainly make the life of short term traders miserable…especially if you are using leverage… 🙂
I agree Olga. That’s why I say the S&P just does not always sit nicely in channels.
It forms those slow rounded tops. Breaks out of the channel… but goes to make a new high…. you redraw the channel and it does it again. But the top is forming while it’s doing that.
Picking highs and lows on the S&P is bound to lose you money. Confirmation is key for this market IMO
Nice. Appreciate your comments.
Confirmed channel break!
And breaking the upper aqua trend line.
Now 100% short.
I’ve just lightened up a bit – will go back fully short when we go below 1918.86.
No technical reason for doing so atm – perhaps being over cautious.
We should pick up a bit of speed once a few supports are taken out.
Finally… the market move is occurring during normal trading hours.
The big up or big down overnight ends for 1 day at least.
Lets see how those that entered on the Long side since the low react today.
This will be excellent data to study.
Yeah – makes me a bit suspicious tbh.
Market usually tries to catch you off guard – this is a bit too orderly for my liking.
Albeit I’ll let price do the talking.
Might lighten up a bit very close to 1918.86 and re-short when we go back under that point (unless there is clear downwards momentum).
Move down is still a bit tame atm though UVXY is finally perking up a bit
Look for divergence between UVXY and SPX to confirm breakdown. If market attempts to retrace and UVXY keeps heading North, that is a good indication to hold short positions.
Sentiment seems to swing from extreme fear to neutral very quickly in bear markets.
Yep – That’s good old Wave 2 doing its job…
(that and frightening the life out of us)
WTI (Apr.) Down 3.68% or $1.23
WTI (Apr.) Down 4.49% or $1.50
Short position #2 filled.
Olga, it looks like you are right after all.
It looks like we will break down through the upper of two aqua trend lines.
My chickens not being counted (quite) yet Rodney 🙂
We ‘could’ be in c down of wave 4, with wave 5 up still to go. Below 1918 will put that idea to bed.
Gla trading ,let’s see what the markets have to say.
We’ve now dropped out of the upward channel – next price confirmation comes at 1902.
Structure of this move down will be important (to me) – going above 1945.26 now would make this move down look like a 3, so mean we are poss still in a wave 4 with final pop higher above yesterdays highs still to come.
I kinda expect a move back up to retest the channel (and close some of todays gap) today – that might be a good place to enter short if it ‘kiss and runs’.
I’m fully short (and IB short sale ban on UVXY now back Verne 🙂 )
Olga, I am guessing you are seeing the channel line break on the 5 minute chart. Is this correct?
Hi Rodney – yes sorry. I’m almost always looking at 5 min and lower during trading hours. I realise many here may want to be a bit more conservative and at least wait for hourly breaks.
With the wave count so likely to be at (or near) an end, my risk profile is a bit higher than usual here. If we go above 1945.26 I’ll lighten my short up a bit – hopefully temporarily.
One of my favourite setups is getting in after a clear 3 waves down so there is a clear invalidation.
Should really wait for 5 down 3 up (we might have now had that at very small degree – but still hard to tell for sure on the 1min) but itching to get that short back on the table!
1918.86 might also be important if that was end of wave 1 of yesterdays final 5 up.
Below that this move cannot be a 4th wave – albeit we have a fair way to go before we get there yet.
Really? That is the strangest thing I have ever heard. Who in this world would be interested in shorting volatility after the decline of the last several days, particularly UVXY?! The ban is probably doing the would-be short sellers a favor whether they know it or not. I guess IB already flush with cash! 🙂
Shorting UVXY now seems like a good way to trash your trading account for sure – though it needs to pick up some steam soon.
I quite like IB because it appears their risk profile is quite good for a broker so that might be something to do with the short sale bans that pop up? (I had presumed it was a market wide ban, but guess it makes sense that it is their own – not at all expert on such things!)
Might be a false sense of security, but looking at their ‘risks’ page (website) they seem quite conservative (only keep 5% of cash with any one bank, no risky derivatives, good buffer of cash, directors have big financial interest in the business etc).
I heard they allow you to trade on global markets so are they open 24/7?
I have thought about opening an account with them with a BVI address so as to avoid additional US entanglements.
Yes they are open 24/7 – pretty much every market is there I think (stocks, futures, futures options, structured products, bonds etc)
One thing I do love about IB is that their Forex trade is a real trade not just contracts. Not sure if this is standard, but tried trading Forex at Euro Pacific Bank broker platform and you had to close positions back in the original currency (i.e. was not a ‘real’ currency trade).
Once you trade for another currency you have that currency in your account and can withdraw funds in that currency.
Exchanging $100,000 USD costs about $5 commision (and you get spot market rate!). Slightly better deal than your average bank!
I’ve had an account with them for over 6 years – no issues. You also get a physical security device (or now an app on cell phone) for significant balances
I really like the sound of that! I have been thinking about a way to hold some Swiss Francs and that sounds like an ideal solution. Do you know if they will issue a bank card that can drawn against your trading account?
Does the physical device permit mobile trading?
You are right; that is less than my bank charges…a lot less! 🙂
No there is no card available – if I needed that I would probably use IB to topup a pre-pay or an account with a low CHF balance (EPB allow cards).
Yes you can trade mobile (the mobile app kind of rolls the security device and platform into one). Physical device (if you go that route rather than app) is used to login to both mobile and standard platforms.
I hold CHF with them but beware – they charge negative interest rates on all balances over 100,000 CHF (needless to say I keep 99,999 in my IB account – rest I have in physical cash 🙂 ).
Actually it was the CHF situation that blew a hole in Euro Pacific Banks credibility with me. I did not understand why they didn’t charge negative interest if (as they claimed verbally), their deposits were held directly with SNB.
Well… it turns out that their CHF deposits are actually held with NatWest, who use ‘a major Swiss bank’ to hold their CHF, who in turn hold it at SNB.
At that point I had to catch my breath….
Incredible….. Call me old fashioned, but if I wanted to gamble away my hard earned with a UK government bailed basket case bank I would cut out the middle man! Further, they didn’t even know who the ‘major Swiss bank’ was!!
I’m betting it was one of the 2 ‘time bombs’ – Credit Suisse or UBS.
One thing is for sure in my mind – as SNB are charging the ‘big Swiss bank’ to hold my CHF deposit, and as I was not being charged anything by Euro Pacific Bank to hold my CHF deposit – the ‘big Swiss bank’ (and very likely NatWest) must be making more money on my deposit that it is costing them (and probably significantly more – these are banks!) – by (very likely) doing something dodgy with it.
Needless to say I would not trust this ‘big Swiss bank’ nor NatWest with safe return of my Gran’s false teeth.
Thanks Olga! Waiting for a full hourly bar to close below the channel without touching.
Very wise! 🙂
We’re not out of the woods yet but my risk is quite limited here.
Odds are that I am wrong – it’s not often I get in that close to the end of a move and make it stick so we’ll see. Stranger things have happened.
Not that wise. Haha. I’m short as well, and have been for months. I’m holding for the big swing. I added to my short position yesterday. Good luck to both of us.
For those who might have interest: Yesterday we made a new high for this correction. However, MACD on the 60 minute chart did not make a new high. Thus, we have a negative divergence indicating a possible end to the correction. It looks like RSI may have provided the same negative divergence. It is very close and minute that is why I say “may have” provided negative divergence.
I have gone short with my first of three positions. Second position will come on break of channel lines on the 60 minute charts. Third position on break of 1925 or so. I will not be surprised if all three fill today.
Thanks for pointing out this divergence!
Thanks Rodney
Co-ordinated bankster buying in overnight futures market. They are are clearly targeting all the little bear cubbies that went short yesterday. I expect more short term wrangling as this has got to be the most fiercely contested third wave decline I have seen in quite some time. The round number pivots are again the key. I am not going to rely on only a break of the channel. Until those pivots are decisively taken out, expect the banksters to keep trying to rattle the bears by spiking price to the upside, albeit temporarily. Of course seasoned bear traders will remain totally unfazed by the near term thrashing around and will patiently wait for the market to fulfill its destiny. A bearish engulfing candle today would be a great start. Happy trading!
My strategy in the future – long up to the end of yesterday, – short a little bit more from above.
Count the strategy is compatible with Lara short preferable
You waited until the end?! Brave man! 🙂
Excellent analysis Lara. Thanks for being very clear.
I hope it plays out as expected to include the middle of a big third wave down at long last.
I have been fully positioned and waiting… seeing profits grow & shrink. I also took on an option bet with a March expiration leveraging up in direction that I was getting very worried about. Tonight my worries are easing a bit.
I am going to try and not read this board on Tuesday.
number one,, One is the loneliest number,, another Three Dog Night classic
dang,, beat out by Jumpin Jack Flash
lol Jackson in the house…
ROFL
The membership of this website never fails to amuse me 🙂
Hi Lara my name is Ivy just joined a week ago very helpful analysis as I struggle to master elliotwave.
From the S&P blue hourly count I erroneously labeled the Feb 17th Minor A wave as a W thus labeling the Minute i, ii and v as Minute A,B and C. Was it incorrect to label as a flat because the intermediate (1) and (2) from the daily blue count was a flat–obeying the guideline of alternation–I should have expected intermediate (3) and (4) on the blue hourly to be a zig-zag?
The Minor A wave was difficult because I could have labeled it a 5 or a three. If we did not reach a C wave would you have labeled the 5 count an ABC to complete the intermediate (4)?
Lastly is it always best to start with a single three count before assuming a combination is unfolding?
Welcome Ivy.
A flat in this position is not possible because the B wave has not retraced the minimum requirement of 90% of the A wave.
This upwards wave is either a single or double zigzag. Those are the only structures that would fit (exception a very rare triple).
I agree. Minor A will fit as either a three or a five. Yes, if we had not moved higher I would have labelled minor wave A as a complete zigzag.
Yes, it is always best to start with a single three first. When that is complete if it looks too brief then consider a combination.
Thanks Lara that clears things up. A flat was highly unlikely once the price held and bounced off the 23% fib line and lower channel line.
Yea, and when the SPX hits 1428 we are all going to be singing “Celebrate”
Rollin rollin rollin…