
Upwards movement for Friday was expected.
Summary: The trend is down. This upwards movement is a correction against the trend. In the short term, a Dead Cat Bounce may end in another two or four days (most likely – but this is not definitive) and should find very strong resistance at the lower cyan trend line on the daily charts. Look out for surprises to the downside; the middle of a big third wave is still very likely approaching.
To see how each of the bull and bear wave counts fit within a larger time frame see the Grand Supercycle Analysis.
To see detail of the bull market from 2009 to the all time high on weekly charts, click here.
Last published monthly charts can be seen here.
If I was asked to pick a winner (which I am reluctant to do) I would say the bear wave count has a higher probability. It is better supported by regular technical analysis at the monthly chart level, it fits the Grand Supercycle analysis better, and it has overall the “right look”.
New updates to this analysis are in bold.
BULL ELLIOTT WAVE COUNT
DAILY CHART – FLAT
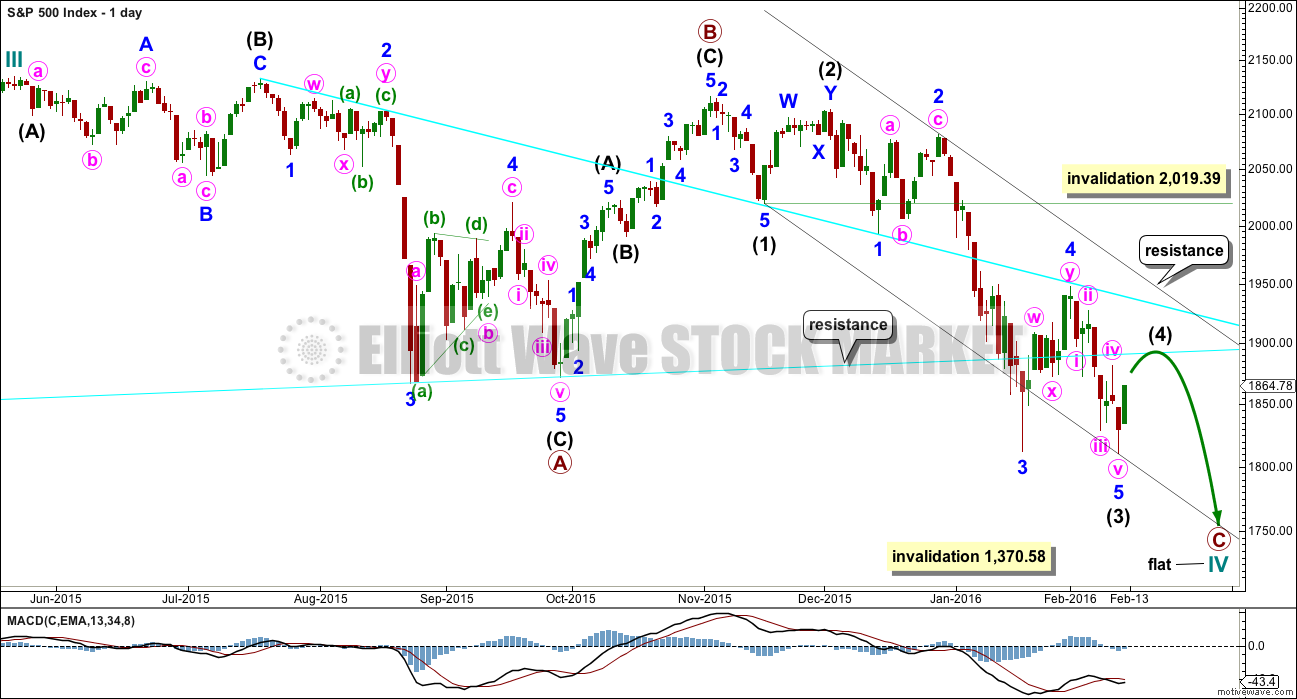
Click chart to enlarge.
This wave count is bullish at Super Cycle degree.
Cycle wave IV may not move into cycle wave I price territory below 1,370.58. If this bull wave count is invalidated by downwards movement, then the bear wave count shall be fully confirmed.
Cycle wave II was a shallow 0.41 zigzag lasting three months. Cycle wave IV should exhibit alternation in structure and maybe also alternation in depth. Cycle wave IV may be a flat, or combination. This first daily chart looks at a flat correction.
Cycle wave IV may end within the price range of the fourth wave of one lesser degree. Because of the good Fibonacci ratio for primary wave 3 and the perfect subdivisions within it, I am confident that primary wave 4 has its range from 1,730 to 1,647.
Primary wave C should subdivide as a five.
Within the new downwards wave of primary wave C, intermediate waves (1), (2) and now (3) may be complete. Intermediate wave (4) would probably find resistance at the lower cyan trend line. This would see it end within the price territory of the fourth wave of one lesser degree.
Intermediate wave (2) was a deep double zigzag. Intermediate wave (4) may exhibit alternation, so it may be shallow. It would most likely be a flat, combination or triangle.
The idea of a flat correction for cycle wave IV has the best look for the bull wave count. The structure would be nearly complete and at the monthly level cycle wave IV would be relatively in proportion to cycle wave II.
HOURLY CHART
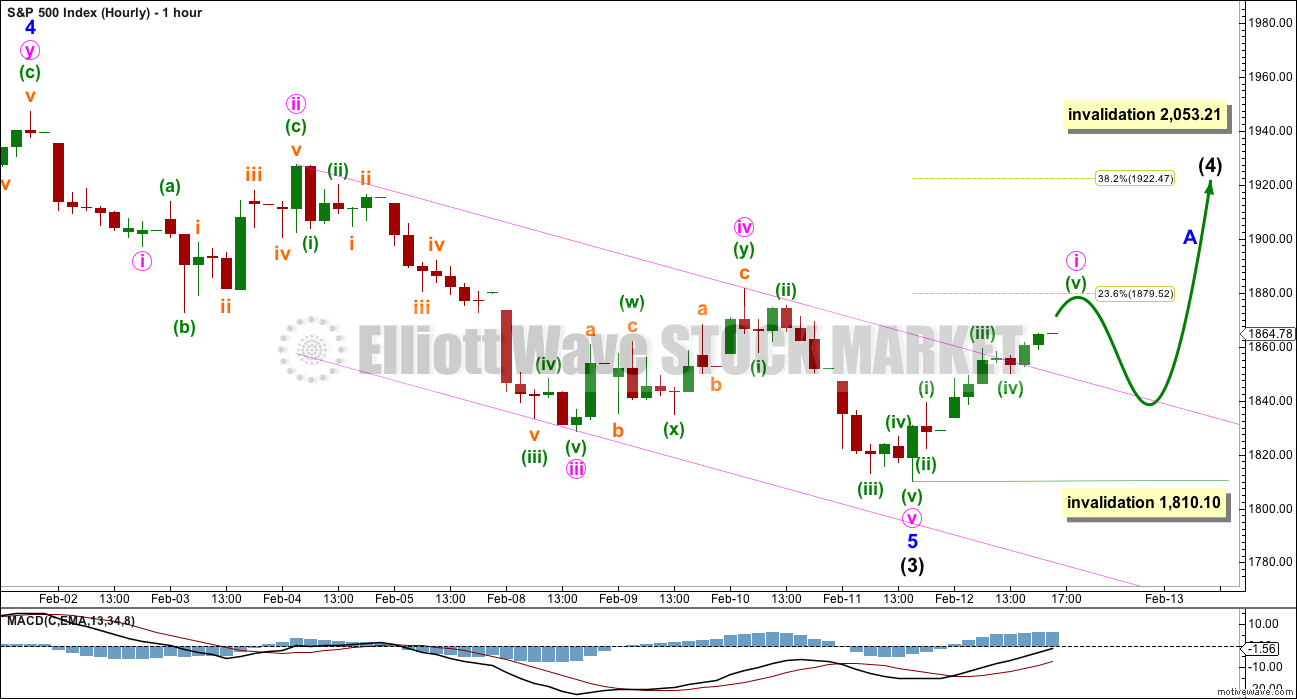
Click chart to enlarge.
Intermediate wave (3) is likely now to be over for the bull wave count. If intermediate wave (4) has begun, then within it no second wave correction may move beyond the start of its first wave. A new wave at intermediate degree should begin with a clear five up at the hourly chart level.
So far the first five up looks to be incomplete. Whether this be a first wave or an A wave the following correction may not move below its start at 1,810.10.
DAILY CHART – COMBINATION
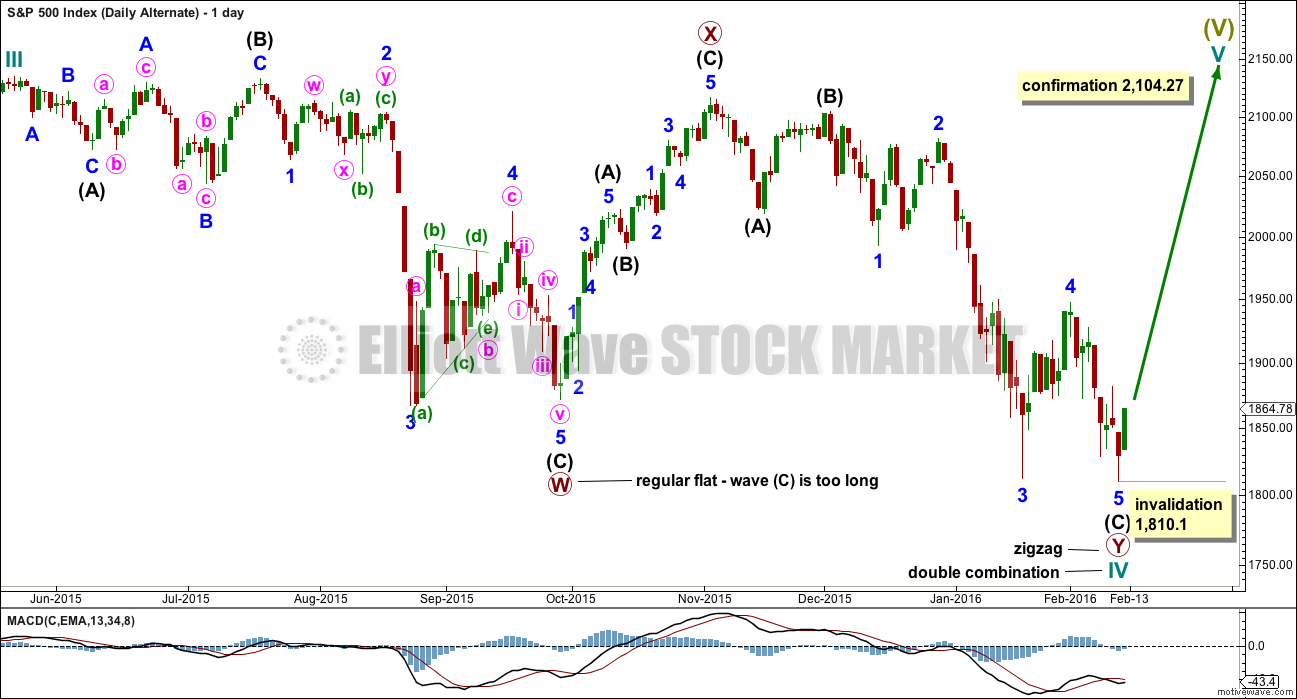
Click chart to enlarge.
This idea is technically possible, but it does not have the right look. It is presented only to consider all possibilities.
If cycle wave IV is a combination, then the first structure may have been a flat correction. But within primary wave W, the type of flat is a regular flat because intermediate wave (B) is less than 105% of intermediate wave (A). Regular flats are sideways movements. Their C waves normally are about even in length with their A waves and normally end only a little beyond the end of the A wave. This possible regular flat has a C wave which ends well beyond the end of the A wave, which gives this possible flat correction a very atypical look.
If cycle wave IV is a combination, then the first structure must be seen as a flat, despite its problems. The second structure of primary wave Y can only be seen as a zigzag because it does not meet the rules for a flat correction.
If cycle wave IV is a combination, then it would be complete. The combination would be a flat – X – zigzag.
Within the new bull market of cycle wave V, no second wave correction may move beyond the start of its first wave below 1,810.10.
I do not have any confidence in this wave count. It should only be used if price confirms it by invalidating all other options above 2,104.27.
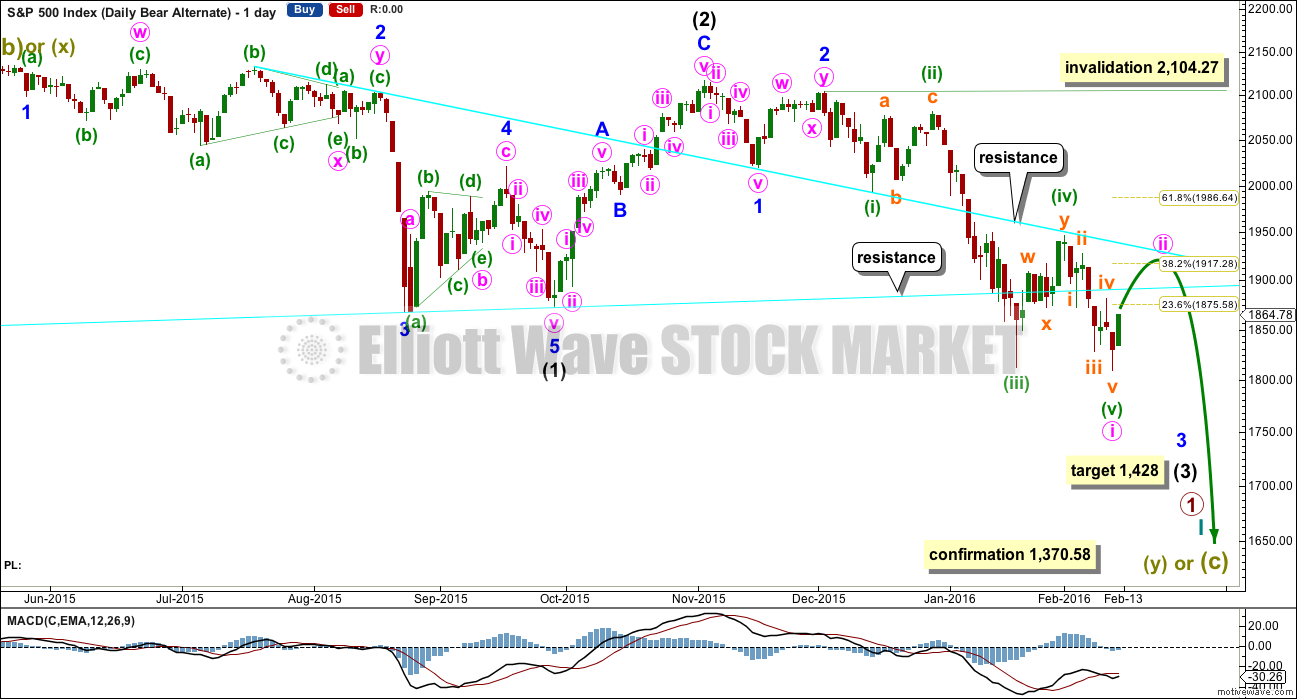
BEAR ELLIOTT WAVE COUNT
DAILY CHART
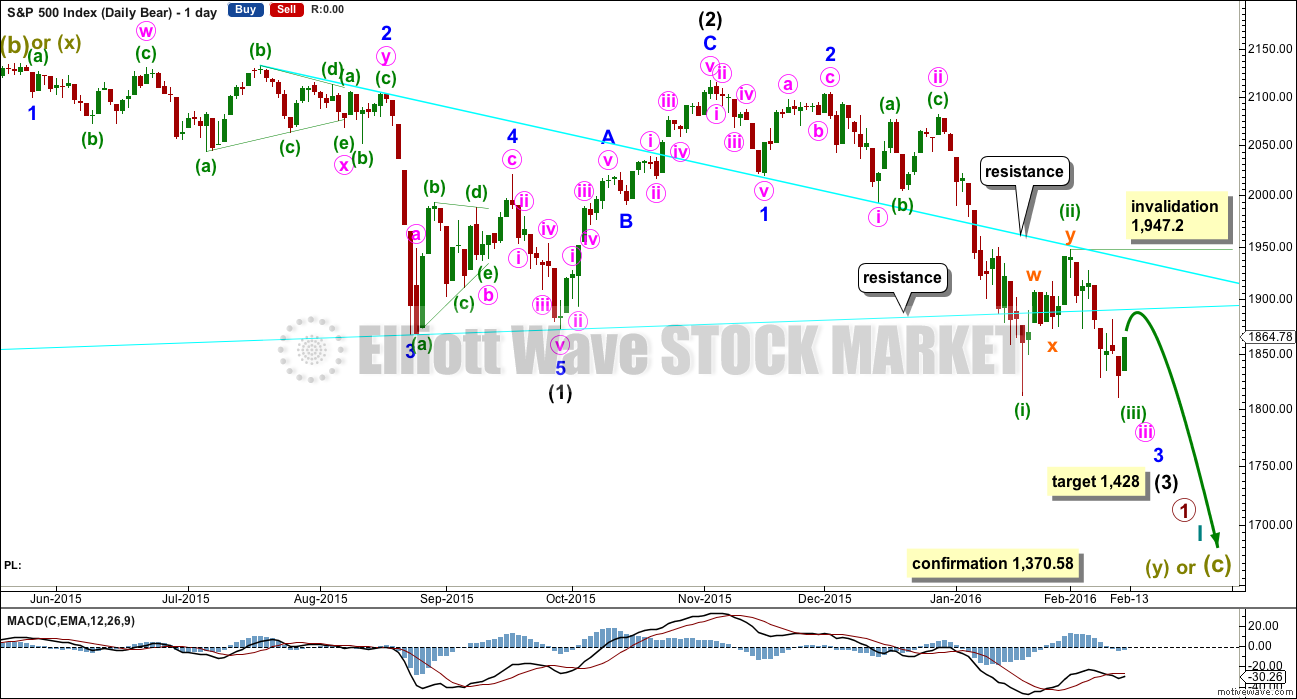
Click chart to enlarge.
This bear wave count fits better than the bull with the even larger picture, super cycle analysis found here. It is also well supported by regular technical analysis at the monthly chart level.
Importantly, there is no lower invalidation point for this wave count. That means there is no lower limit to this bear market.
Downwards movement so far within January still looks like a third wave. This third wave for intermediate wave (3) still has a long way to go. It has to move far enough below the price territory of intermediate wave (1), which has its extreme at 1,867.01, to allow room for a following fourth wave correction to unfold which must remain below intermediate wave (1) price territory.
Intermediate wave (2) was a very deep 0.93 zigzag. Because intermediate wave (2) was so deep the best Fibonacci ratio to apply for the target of intermediate wave (3) is 2.618 which gives a target at 1,428. If intermediate wave (3) ends below this target, then the degree of labelling within this downwards movement may be moved up one degree; this may be primary wave 3 now unfolding and in its early stages.
Intermediate wave (2) lasted 25 sessions (no Fibonacci number), minor wave 2 lasted 11 sessions (no Fibonacci number), minute wave ii lasted 10 sessions (no Fibonacci number), minuette wave (ii) lasted a Fibonacci 8 sessions. Each successive second wave correction of a lower degree has a shorter duration which gives the wave count the right look, so far.
Within minuette wave (iii), no second wave correction may move beyond the start of its first wave above 1,947.20.
This first idea for the bear count at the daily chart level expects to see a very strong increase in downwards momentum as the middle of a big third wave unfolds. This first idea (of three) has the highest probability because it expects that within intermediate wave (3) the middle of the third wave will be the longest extension, which is the most common pattern for the S&P.
Third waves are most often extended for the S&P. They often feel like they begin slowly as a series of first and second waves unfold. The middle accelerates and they often end with strong movement and a spike. There is a good example on this daily chart: minor wave 3 within intermediate wave (1) began slowly (many members were concerned the wave count was wrong) and then had strong acceleration at its middle and then ended strongly.
HOURLY CHART
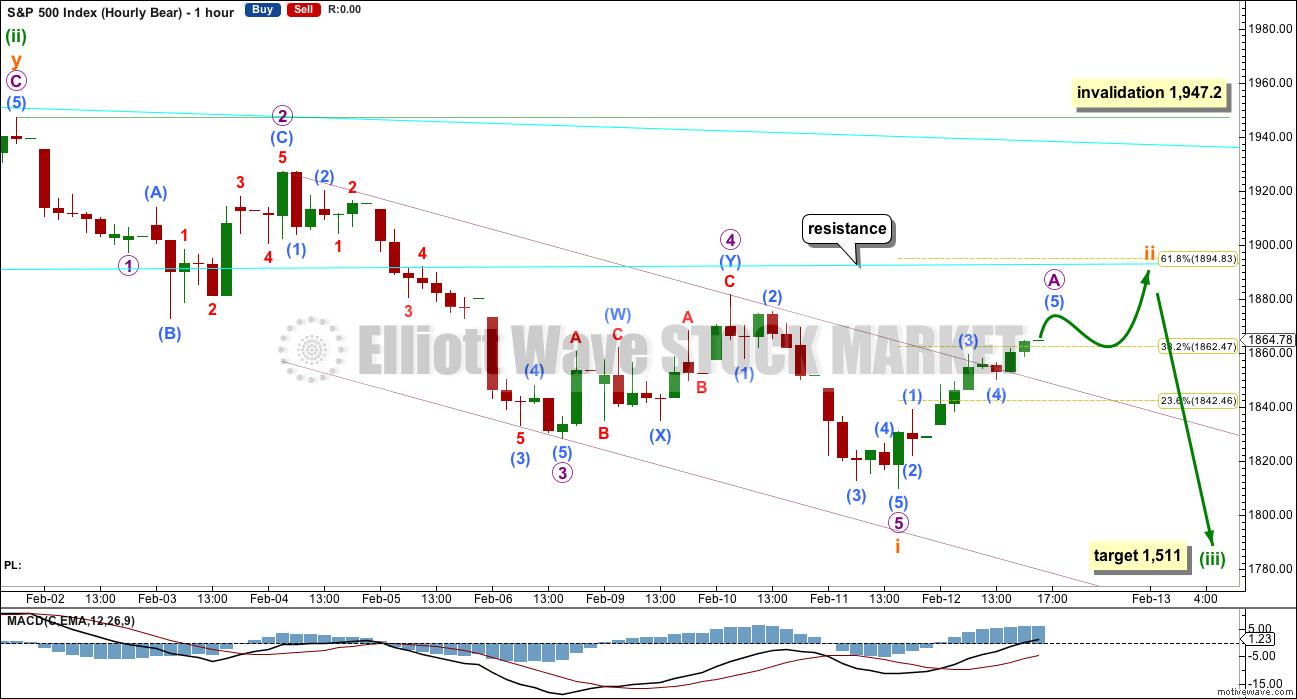
Click chart to enlarge.
There will be just one hourly wave count for the bear today. The hourly bear alternate presented in last analysis is still technically possible but the probability is too low for serious consideration.
If submineutte wave ii corrects up to the 0.618 Fibonacci ratio of submineutte wave i at 1,895, then it may find resistance at the lower cyan line which is copied over from the daily chart. Draw this line from the lows of October 2014 to August 2015.
Minuette wave (ii) lasted a Fibonacci eight days. Subminuette wave ii should be quicker. The expectation is of a Fibonacci three or five days, with five more likely.
The target for minuette wave (iii) remains the same. At 1,511 it would reach 1.618 the length of minuette wave (i).
When subminuette wave ii is complete, then a target may again be calculated for subminuette wave iii to end. At this stage, with subminuette wave ii still unfolding, it cannot be known where subminuette wave iii begins and a target for it cannot be calculated.
At this stage, it looks like subminuette wave ii may be unfolding as a zigzag. Within subminuette wave ii, micro wave A looks like a five wave structure on the hourly chart. Micro wave B may not move beyond the start of micro wave A below 1,810.10. The invalidation point is not noted on the chart because this correction may possibly come to a swifter end than expected. Still expect surprises for this market to be to the downside because with the middle of a big third wave approaching it may force corrections to be swift and shallow.
FIRST ALTERNATE DAILY CHART
Click chart to enlarge.
It is time to separate out the different possibilities for the bear wave count for clarity.
Within minor wave 3, it is possible that minute wave i was extended and is now a complete five wave impulse.
This wave count sees three first and second waves within an impulse unfolding downwards: intermediate waves (1) and (2), minor waves 1 and 2, and now minute wave i. Minute wave ii should be more brief than minor wave 2 which lasted 11 days. Minute wave ii may be expected to last a Fibonacci 3, 5 or 8 days. If it finds resistance at the lower cyan trend line, then it may only last 3 days. It if lasts longer and is deeper, maybe ending at the 0.382 Fibonacci ratio at 1,917, then it may last a Fibonacci 5 days.
Minute wave ii would be very likely to end at either of the cyan trend lines.
Minute wave ii may not move beyond the start of minute wave i above 2,104.27. However, it should not get anywhere near that point and it should not last much longer if any than 11 days.
This first alternate bear wave count has a lower probability than the main bear wave count. It is less likely that a first wave would be this extended.
SECOND ALTERNATE DAILY CHART
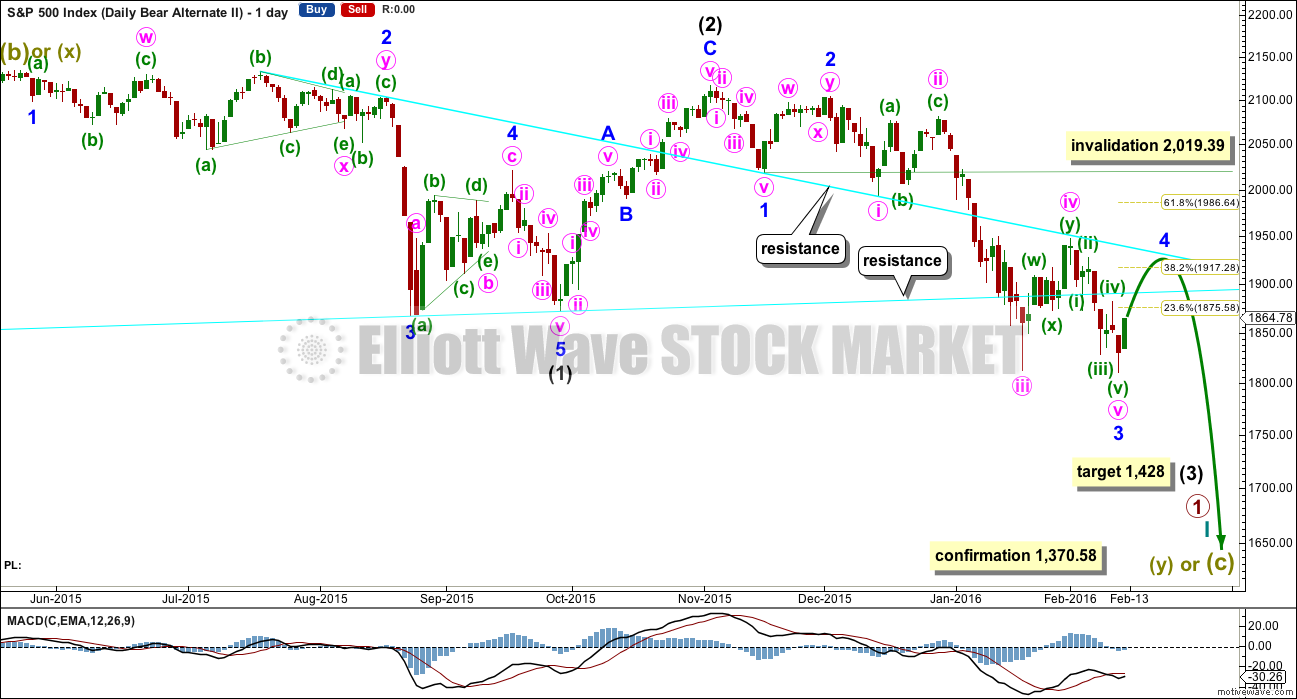
Click chart to enlarge.
I have previously noted this idea in the text and now it is time to chart it, so that the implications are clear.
Within the downwards impulse unfolding, it may be that intermediate waves (1) and (2) are complete and now minor waves 1, 2 and 3 may also be complete within intermediate wave (3).
This wave count expects minor wave 5 to be extended within intermediate wave (3). Minor wave 5 should also show a strong increase in momentum, so that at its end intermediate wave (3) has clearly stronger momentum than intermediate wave (1).
There is no difference to the target for intermediate wave (3). This wave count makes a difference to the invalidation point. Minor wave 4 may not move into minor wave 1 price territory above 2,053.21.
This wave count also has a lower probability than the main bear wave count. It is possible that a fifth wave is the strongest extension within a third wave impulse, but this is less common for the S&P than the third wave being the strongest extension. This wave count would be more typical of commodities than the S&P.
Minor wave 2 lasted 11 days. Minor wave 4 may last a Fibonacci 8 or 13 days, so that the proportion between these two corrections is similar and the wave count has the right look.
Minor wave 4 would most likely be shallow and would be very likely to find strong resistance at one of the cyan trend lines.
TECHNICAL ANALYSIS
DAILY CHART
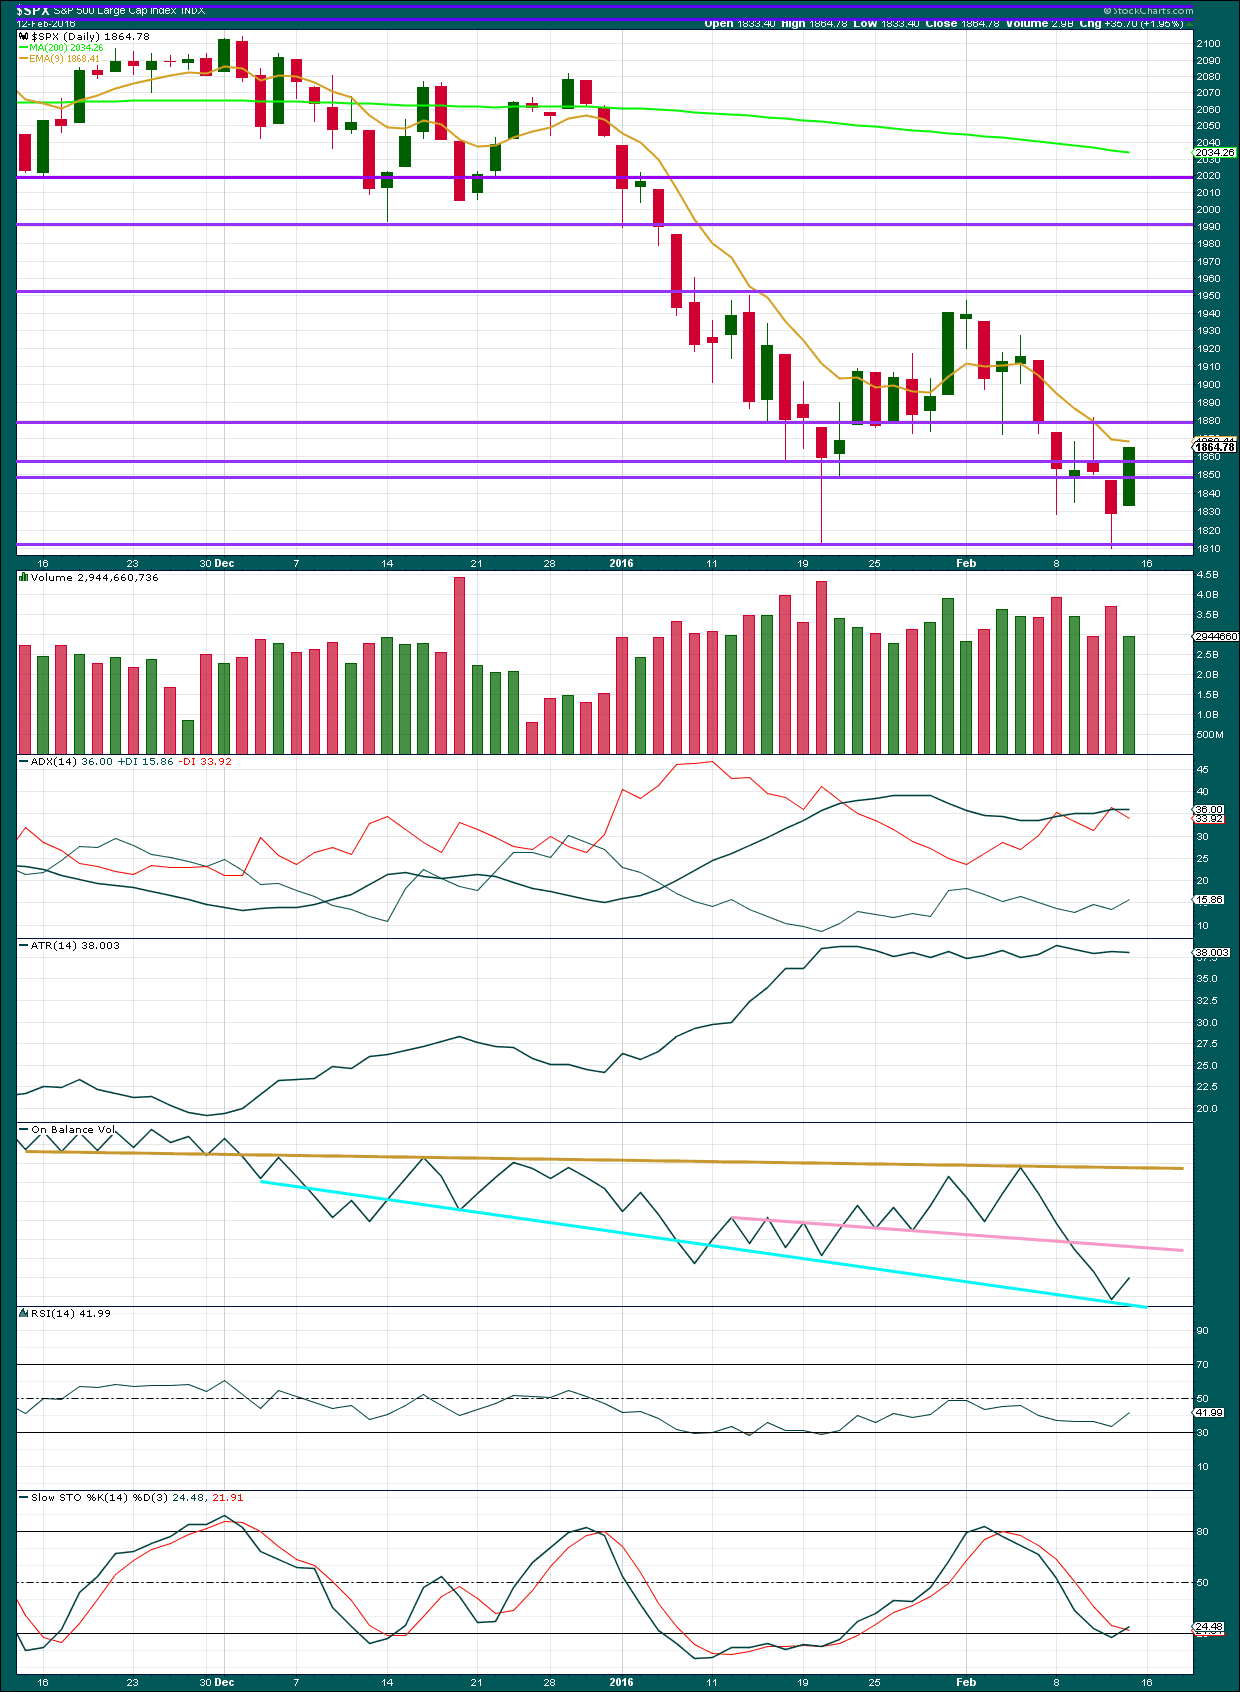
Click chart to enlarge. Chart courtesy of StockCharts.com.
This week the S&P made a new low below the prior swing low of 1,812.29 on 20th January. Overall, the pattern of lower highs and lower lows continues. As price declines, volume increases; as price rises, volume declines. The volume profile remains almost completely bearish. This supports the bear Elliott wave count.
Again, as price moved higher for Friday, it came with lighter volume. The rise in price was not supported by volume and is suspicious. This upwards movement is extremely likely to be a correction against the trend, so it is extremely likely to be fully retraced.
The next horizontal trend line to offer resistance is about 1,880.
ADX is beginning to turn upwards indicating the market may again be trending. The trend is down.
ATR still disagrees as it is flat. This is more normal for a consolidating than trending market.
On Balance Volume slightly breached the cyan trend line as it was drawn in last analysis and then turned back up through that line. The cyan trend line is redrawn to better show where OBV found support at the last turn. This line is long held and repeatedly tested, but not very shallow. It offers reasonable technical significance.
The pink line on OBV is also redrawn. This line is reasonably shallow and repeatedly tested, and it too offers reasonable technical significance. This line may assist to show when upwards movement in price comes to end. If OBV touches this pink line and if price is at a resistance line at the same time, that may be when this correction is over.
RSI is returning to neutral. If price continues higher next week, it may return RSI closer to neutral and then allow plenty of room for the market to make its next fall.
I have switched to slow Stochastics. Stochastics is returning from oversold. This may too allow room for the market to fall again.
DOW THEORY
For the bear wave count I am waiting for Dow Theory to confirm a market crash. I am choosing to use the S&P500, Dow Industrials, Dow Transportation, Nasdaq and I’ll add the Russell 2000 index. Major swing lows are noted below. So far the Industrials, Transportation and Russell 2000 have made new major swing lows. None of these indices have made new highs.
I am aware that this approach is extremely conservative. Original Dow Theory has already confirmed a major trend change as both the industrials and transportation indexes have made new major lows.
At this stage, if the S&P500 and Nasdaq also make new major swing lows, then my modified Dow Theory would confirm a major new bear market. At that stage, my only wave count would be the bear wave count.
The lows below are from October 2014. These lows were the last secondary correction within the primary trend which was the bull market from 2009.
These lows must be breached by a daily close below each point. So far the S&P has made a new low below 1,821.61, but it has not closed below 1,821.61.
S&P500: 1,821.61
Nasdaq: 4,117.84
DJT: 7,700.49 – this price point was breached.
DJIA: 15,855.12 – this price point was breached.
Russell 2000: 1,343.51 – this price point was breached.
This analysis is published @ 06:57 p.m. EST on 13th February, 2016.
Joseph
Futures up again .5% now.
The US market is on a tear unstoppable and doesn’t seem to be stopping to the upside even now.
Have you seen that on 3rd waves in all your years of trading?
I’m reserved on judgement to be honest!
I will admit I have no clue or any idea of what is really going on. But one thing I can say as of the past 2 days it doesn’t look like we are going down at all at the moment. Not even -1 point will be given back here…
Last two days (two & half actually) are classic bear market rally’s… the moves in the opposite direction will be just as swift.
Oh ok.
Even though technically a bear market is 20%
We only did 15% on the spx and down only 10% now today from 2116
So I am still learning about rallies.
Will
Wait and see I guess.
I read your previous post. You said lock step 3 weeks to decline. Was that your other Elliot wave subscription views for the next few weeks into March for a huge decline ?
I guess what if that doesn’t happen ?
In your experience how do you deal with that ?
Half my position has been in placed since May.
The other in and out of and in again a few weeks ago.
Again you have to find your own method that works for you. What I do works for me and EW paints the bigger pictures for me which I firmly believe are the Bear Counts.
This past move, at this point, will not change my view.
I was doing 6 months out but that won’t work either in this run up.
If we get to 1970-2000 the
Third wave probably hits in 2017. I’m practically defeated here. At that point I’m going say 6 years of bull market can be more.
The only options I do are Leaps.
No way 2017… The debt default waves are trickling in and about to accelerate.
Look to the debt for the fundamental clues.
Oh ok
Joseph
It seems like 1500 is out of the cards now. I noticed you had some levels in mind today ?
Are you of the opionion to wait for the week to close out ???
No, it is NOT out of the question. Can turn any day… probably overnight like all the big moves of late.
Really? To be honest I have never seen an over night dump that big other than the aug 2015 flash crash.
I wonder how you have so much faith. I guess that is what years of experience is.
Been getting 150 to 300 pt moves on the DOW in the overnight on a regular basis. I did not imply down to 1500 in the S&P in one overnight move.
Correct but still I’m
Honestly worried as a short holder.
I am actually not sure and I have no idea what’s going on here to the upside.
I am afraid the worst possibly bullish case is here which is what I thought was a low probability but I don’t know. I’m still a student of the market….
That’s not going to happen! IMO… The main Daily, Weekly & Monthly Bear Counts are in play and very supported by other factors at this point in time.
You have to do what’s right for you.
I for one am not worried… I am firm and can not be shaken out.
Ok that’s great to here.
I’m learning still!
Some days I notice it’s best not to do anything at all. Would you agree to that based on all your years of experience ?
I don’t day trade. My trades are longer term 3 weeks to months.
What is your price target expectation into March for the spx?
I don’t day trade either..
Are you reading Lara’s analysis?
Yes but I don’t understand the actual target. Is it 1511 or 1428?
Really, what’s the difference at this point between those two targets vs where we are now?
Good point!
Thanks Joseph
Another big overnight move… +130 is DOW’s projected open. This is where all the action is and will continue to be.
How can you trade daily when the bulk of the move up and down occurs over night???
Hi
All
Anyone with any good ideas can help me understand markets better ?
I’m trying to think out loud here as some people have some bright ideas in todays post.
Are we still going to continue a bounce ? If so do you just keep watching for invalidation points ?
If the short term trend is up ? Are we looking at 1 month upto spx 2000?
Futures keep grinding higher. I’ve never seen anything like this. No pull back just up non stop. Maybe OPEX week has something to do with this ?
At what point is the downtrend idea invalidated ? Spx 2040 ?
Thanks!
Jack
What is your guess on the price action limits here ?
Took profit by selling my long S&P position at S&P 1890
Still long oil and short gold
My guess is that we’ll have a small B wave correction, then S&P goes to 1940s++ for a C wave. Due to short squeeze we might have a very small B wave.
Tremendous amount of potential to the downside, hence why I didn’t hold my long S&P position. Will short market when I see a setup (feel comfortable).
Thanks Jack.
I really am conflicted here to remain short to be honest!
Probably a 100% retrace back to 2080 – I just don’t know what to think.
Ace you’ve got to take profits…when you have a chance. Let’s see what is Lara’s recommendation tonight.
I had it but we talked Friday and I was conflicted and now negative!
I’m
Learning still but this game of bounces is making me confused!
I don’t know anymore!
Thanks Ace
Closed right at 21 day ema; above by less than one point.
OK I am going to bite. I’ll take those calls for 3.00 Alex…. 🙂
So far the upwards movement has a count of seven, that’s corrective.
Sometimes zigzags look like this…. they have an impulsive look to them because the B wave is so shallow. But more often they are clearer than this. So I’m a bit concerned about the look of this upwards move on the hourly chart.
Draw a channel about this move on the hourly chart. It sits in a very narrow steep channel. If that is breached then a little confidence may be had that it is over. Just a little.
The 0.618 ratio is met and the cyan line is holding… so far. So far it all looks reasonably good.
Tomorrow will be very important. If price moves lower I’ll be very happy indeed. If it doesn’t I’ll be rather concerned.
Would the implication be that we are still in a possible A wave up of an ABC?
I guess that would also imply a move down for a clearer wave B prior to going higher…
More rotating with zero risk
Yefeyfe
Asir Todah
Hi ace
Volume somewhat higher than last Friday but less than Thursday…
StockCharts so far has volume for the 16th at 2,855 million, and for the 12th at 2,944 million. So today is lighter.
That fits with seeing this upwards move as a correction. Upwards movement in price isn’t supported by volume so is bearish.
That’s what I wanted to see 🙂
BUT… it’s not yet 6:30pm EST. StockCharts data may yet change up to that time.
And now its just after 6:30pm and StockCharts data is changed.
Today has slightly higher volume than Friday.
That’s not what I wanted to see 🙁
In Robert precthers book Elliot wave.
I’m going back to it for reference to look for information and technical analysis
The Macd positive divergence on the daily is not a character of third waves is it ?
Does this push more weight on the bullish count now today ? Or is waiting another day for price action required to make that assessment ?
Hi ace
Lara… what specific volume number are you using? A specific index or what?
Thank You
The DIA and the SPY ETFs, unlike the indices (which have strong real bodies for their candles) have candles that suggest topping distribution. That is weird…
Is that something I can confirm in a technical analysis book?
Futures ripping higher now. Are you still bearish even now ?
Thanks Ace
Stockcharts Volume is identical now for both dates mentioned above.
What are the implications for expectations for this third wave probability lie now ?
What would the wave count look like if we terminate at 1993 or 2000?
Since we now have 2 days of up strong upward movement. Does this delay the overall 3rd wave structure potentially to the 3rd or 4th quarter in 2016 as an estimate ? How do we as market investors or traders analyze the wave structure to get a better clue of how high we can go ? The next cyan trend line is so close.
All other global markets have entered into a bear market but not the US spx. Could that be because the US is such a well developed market it doesn’t drop as the rest of the global markets. Also – Since the rest of the globe is now bouncing now the US will ?
You mention the right look on the bear count? How would it potentially look if we fall lower in 2016 – does that change the over look ?
My concern is at some point how do we distinguish if we are still in a third wave or not ?
What are the characheristics if a third wave is completed or about to begin ?
FYI… Since you quoted the book, one of the authors look at this as middle of 3rd as well and expect down to resume any day. Also, they see this as the bear count.
The USA will follow at any time. Quite frankly it is long overdue.
Thanks – please see my comments above
Thanks ace
Ordinarily a second close below upper B band is a reliable short sell trigger for UVXY. There may indeed be some upside in the markets and downside for volatility but considering where we are in the wave count, I am taking a pass . Still holding a few old UVXY 45 puts just in case but I don’t think they are going anywhere…
Well that was a brief shallow B wave if this is a zigzag.
If todays volume profile is bearish (lighter volume for todays upwards day) and if that lower cyan line holds then I will be confident that this is very likely to be it for upwards movement.
As always, please understand I could be wrong. If members are entering short here please manage risk carefully. I have set my stop just above 1,947.2. If I am wrong I am risking just less than 5% of the equity in my account. My target is 1,428. I may adjust that downwards as the next wave unfolds.
If tomorrow price moves lower and has found resistance at the cyan line then I may add to my short position. If that happens I’d have more confidence in resistance at that line.
If tomorrow that line is breached by upwards movement I’ll be rather unhappy… I’d expect then for price to continue higher to the next cyan line. My position would be negative for a few days.
obvious, as clear as daylight
Rats! Bid for for those calls never got cheaper than 2.76 and now they have started higher back to 2.90. I was just a tad too miserly! Oh Well, you can’t always get what you want… 🙂
bid/ask range is also tightening.
Yeah…that means other wise guys are buying ’em….
Top is in at 1894.94 on the main hourly bear count. Right on target with that candle stick.
If we head lower from this point the analysis would be almost exactly spot on….i’ve added some shorts
Possibly. The pattern has been a final thrust up from these wedge-like formations followed by an immediate reversal. Looking for one final pop.
MM not biting on my 2.50 offer yet…still hoping to get filled…1900 should initially provide strong RN resistance…
The 1:00PM to 2 :00PM candle is a perfect top candle stick on the main bear hourly chart with a high of 1894.94.
Just need the balance of the 2:00PM to 3:00PM candle to confirm lower by moving lower.
The 1:00PM to 3 :00PM candle is a perfect top candle stick on the main bear 120 min. chart with a high of 1895.40.
Just need the balance of the 3:00PM to 4:00PM candle to confirm lower by moving lower below 1890.95
Entered bto order for UVXY March wk 1 60 calls for 2.50 Current bid/ask 2.90/3.15. Final move up should get positions filled.
I’m watching the level 2 on those contracts….very little volume today on those (27)…?
Hi Lara
Thought I saw you suggest you would be updating the FTSE charts as you trade this. Would it be possible to have to when you are done?
Currently holding a short position and checking daily. This is underwater at the moment and unsure whether recent market strength means we should be exiting shorts and potentially looking long?
Hi Alison,
I have a short position in the FTSE also. I am a longer term trader, holding positions for months. My stop is at the top of minuette wave (ii). The current rally looks like subminuette ii. Hope this helps until Lara posts an update.
Thanks Thomas – 5950 looks to be the top of ii?
Not far to go.
Really appreciate your chart
Ali
I have a position which is still positive and I’m holding on to FTSE.
I will publish an update for FTSE today.
For both FTSE and S&P I expect the probability that the upwards move is over is high.
I also have a position on S&P which opened at 1,892 on my order. Yay.
So I’m putting my money where my mouth is 🙂
Thanks Lara – I look forward to seeing you your view on FTSE. Very much appreciated.
Pleased your position was filled 🙂
Ali
Hi Thomas – I am new to EWT but understand the basics.
Why have you labelled the move down at i,ii x 3 rather than a a completed 5 wave down?
It can’t be a five because the fourth waves would overlap into first wave price territory.
FTSE is the clearest bear, which is why I’m trading it.
It can only be a series of first and second waves so far. If this is an impulse unfolding lower that is.
Maybe A not quite done yet? Rather brief for a B wave correction I think…adding short term shorts to lower cost basis…double top with doji??!
Looking like B wave of current correction. Once again, a probable sharp upward thrust from some sort if triangle/wedge formation to end the move…
Filled on speculative March wk1 UVXY 45 strike calls at 8.75…
A close back above or hugging upper B band and correction may be done early…
Vern, good, make a million$. Thanks for putting expiration date, strike price and option price in your comments–much easier to follow your tactics.
No problem. A bit underwater at the moment on the trade. SPX will very likely move up to touch 21 day ema so still holding some dry powder. Also holding some UVXY 45 strike puts as a hedge that are not doing too much on this decline…watching closely….
Speaking of banksters, it may be an unfortunate co-incidence for US bulls that Draghi held his press conference on a US holiday market. European markets really popped today. If the recent pattern of interim market tops coinciding with various CB pronouncements holds, US bulls may find themselves a bit late to the party. Either way, I suspect the window of opportunity to get positioned for the dark side may be very limited indeed! For the first in a long time questions fired at Drahghi by those in attendance were quite pointed and could indicate for the wider audience of observers of the CB song and dance, the jig may be up! 🙂
The way down to the subminuette iii is open, so I realized the analysis of Lara. I hope that has been and successfully all of us
Atah Tzodek
lo btuach bchll . yech stop loos baruch hchem.
layla tov .
Lidchof SPX 2000?
Chaver Shelach Asir Todah!
lo yale mal 1900.
1900 Me’ah Achuz?
The manic move to the upside indicated by futures is an unbelievable gift to the bears. Volatility in the short term is going to be pushed under water like an inflated balloon. Puts that were sold scant days ago are going to be available for , in some cases, a tenth of what they brought then. I am changing my strategy. I have open stink bids to buy back all my short term short positions at 10% of what I sold them for a few days ago. I know I may not get filled, but this is a low risk, low cost way to get positioned ahead of a more definite downside trigger. Knowing these banksters, I would not be in the least bit surprised to see every order filled. Rather than chasing the upside or increasing hedges, I intend to use the pop to lock and load, albeit VERY cheaply! Happy Hunting! 🙂
Hi Vernecarty,
Which index are your shorting through puts? Any particular series/expiration o consider?
Regards,
I bought some long term UVXY calls back in December after a break-away gap from a 25.71 close Dec 29 that long term indicators suggested would not be filled for a very long time. All the major indices SPX, DJI, NDX are good candidates imo as they are all being held up by relatively few members. For option traders, their corresponding ETFs all have good volume and spreads at the moment- SPY, DIA, QQQ. The related inverse funds also work reasonably well – SDS, DXD, QID. The awful breadth in the market the last many months is the most un-reported fact controlling the markets’ future. I have almost no short term positions currently but intend to use the current “rally” to get fully re-positioned. I am currently short a fair sized mid term position in SSO.
I think for options a wise approach is mid term trades at least three months out.
I posted on another thread what I think is an anomalous pricing situation on volatility at the moment. Hope that helps a bit! 🙂
Thanks for sharing!
My, my, my! The banksters sure are getting quite excited! Poor Draghi. It used to be that just a mere suggestion that further stimulus was in the works would be enough to send world markets on a tear. Now he is having to keep repeating the easing mantra in ever more stentorian tone to elicit the same results. Poor Abe. Japan is back in contraction mode, despite his valiant efforts. The enthusiasm of the current pump seems to be entirely commensurate with the intensity of the anticipated decline. Poor Cryan. He claims DB is “rock solid”. The harder they pump, the harder (and longer!)they fall…
Second close of UVXY below upper BB may signal at least short term trade to the downside. The party will probably continue for a few more days so I will probably grab a few more UVXY puts to balance my pairs trade ledger…get the cannons ready…! 😀
Lara,
Thanks for the updates, I find this blog very helpful in developing and fine tuning my understanding/application of the EW. Just wanted to check with you if you are using the wave labels generated by the software or marking them manually or a mix of both to re mediate miscalculation by the software ?
If you have some time and are able to put together analysis of NASDAQ it will be appreciated.
Ris,
Welcome to the blog / forum. Lara did an update to the Nasdaq on Feb 8th. I am not sure if that was current enough for you or not. Check the indicies data section and you will find it. Or select the Nasdaq button at the top menu.
Welcome Ris.
Your question is answered in the FAQ. The labelling is my own.
I actually never use the auto wave feature of Motive Wave.
I need to update FTSE first (because I’m trading it). When that is done I’ll update NASDAQ if I have time.
Lara, when you say that this correction may come to a swifter end than expected, does that mean you see a good possibility for it ending sooner than 3 days, possibly on Monday?
It is possible. I don’t know how likely, but the possibility certainly exists.
With a big third wave approaching when it begins to show itself clearly then price may just fall very hard.
That is what I mean by expect surprises to the downside.
For now I expect that the cyan trend line may well be tested again.
if we are looking at a B wave soon, would it be anticipated to retrace significantly, like 90% ?
Not necessarily.
0.382 or 0.618 would be the two most likely targets.
B waves within zigzags can be shallow.
woo hoo, you know who 1st. Happy Valentines Day tomorrow