
Strong downwards movement was expected for Wednesday.
Price began by moving higher and then completed the session by moving lower and printing a red candlestick.
Summary: The trend is still down. A very strong third wave is most likely still building. Price should move lower tomorrow. Movement may be a fifth wave to end a small impulse or it may be the start of the middle of a big third wave. The mid term target for the preferred bear wave count is still 1,428.
To see how each of the bull and bear wave counts fit within a larger time frame see the Grand Supercycle Analysis.
To see detail of the bull market from 2009 to the all time high on weekly charts, click here.
Last published monthly charts can be seen here.
If I was asked to pick a winner (which I am reluctant to do) I would say the bear wave count has a higher probability. It is better supported by regular technical analysis at the monthly chart level, it fits the Grand Supercycle analysis better, and it has overall the “right look”.
New updates to this analysis are in bold.
BULL ELLIOTT WAVE COUNT
DAILY CHART – COMBINATION OR FLAT
Click chart to enlarge.
This wave count is bullish at Super Cycle degree.
Cycle wave IV may not move into cycle wave I price territory below 1,370.58. If this bull wave count is invalidated by downwards movement, then the bear wave count shall be fully confirmed.
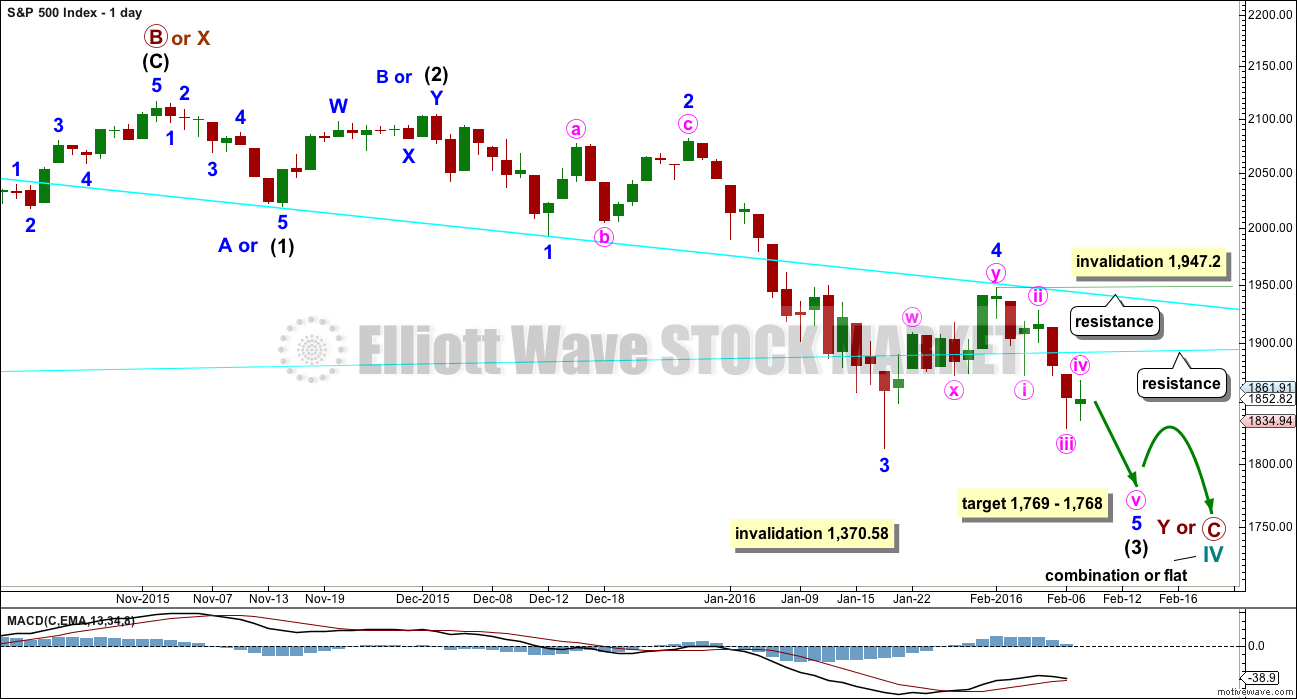
Cycle wave II was a shallow 0.41 zigzag lasting three months. Cycle wave IV should exhibit alternation in structure and maybe also alternation in depth. Cycle wave IV may be a flat, or combination.
Cycle wave IV may end within the price range of the fourth wave of one lesser degree. Because of the good Fibonacci ratio for primary wave 3 and the perfect subdivisions within it, I am confident that primary wave 4 has its range from 1,730 to 1,647.
Primary wave C should subdivide as a five and primary wave Y should begin with a zigzag downwards. This downwards movement is either intermediate waves (1)-(2)-(3) of an impulse for primary wave C or minor waves A-B-C of a zigzag for intermediate wave (A). Both these ideas need to see a five down complete towards the target, so at this stage there is no divergence in expectations regarding targets or direction. When and if these two ideas diverge, I will separate them out into two separate charts. For now I will keep the number of charts to a minimum.
Primary wave A or W lasted three months. Primary wave C or Y may be expected to also last about three months. It is now in its second month at this stage and may not be able to complete in just one more. It may be longer in duration, perhaps a Fibonacci five months. That would still give a combination the right look at higher time frames.
Within the new downwards wave of primary wave C or Y, a first and second wave, or A and B wave, is now complete. Intermediate wave (2) or minor wave B lasted a Fibonacci 13 days exactly. The target for intermediate wave (3) again changed today. With minute wave iv within minor wave 5 moving higher, the one point target zone calculated yesterday is no longer accurate. At 1,800 minute wave v would reach 1.618 the length of minute wave i. This would still see minor wave 5 move below the end of minor wave 3 and avoid a truncation. This target makes sense for this bull wave count, but it does not for the bear.
This daily chart and the hourly chart below both label minor wave 3 as complete. It is also possible that the degree of labelling within minor wave 3 could be moved down one degree, because only minute wave i within it may be complete. Within minor wave 5, no second wave correction may move beyond its start above 1,947.2.
Price has now broken below the lower cyan line. It looks like a downwards breakout is underway; the next wave down is unfolding. The lower cyan trend line today has provided resistance for a throwback.
HOURLY CHART
Click chart to enlarge.
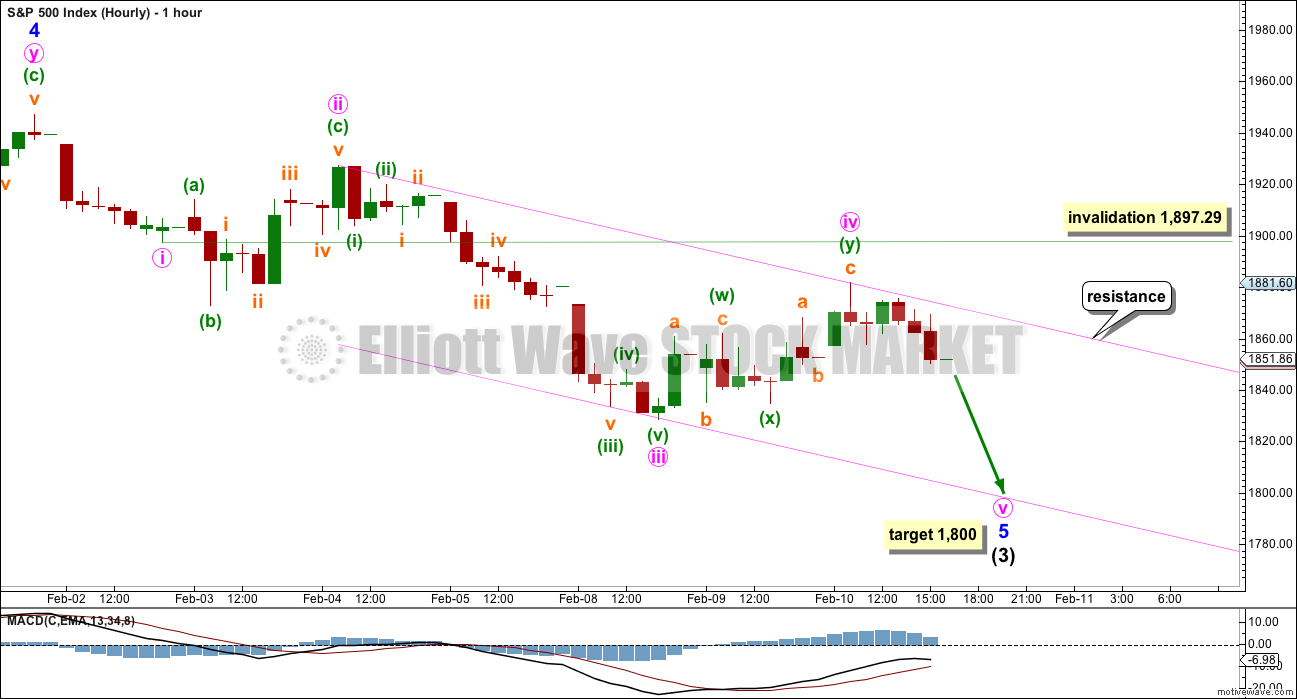
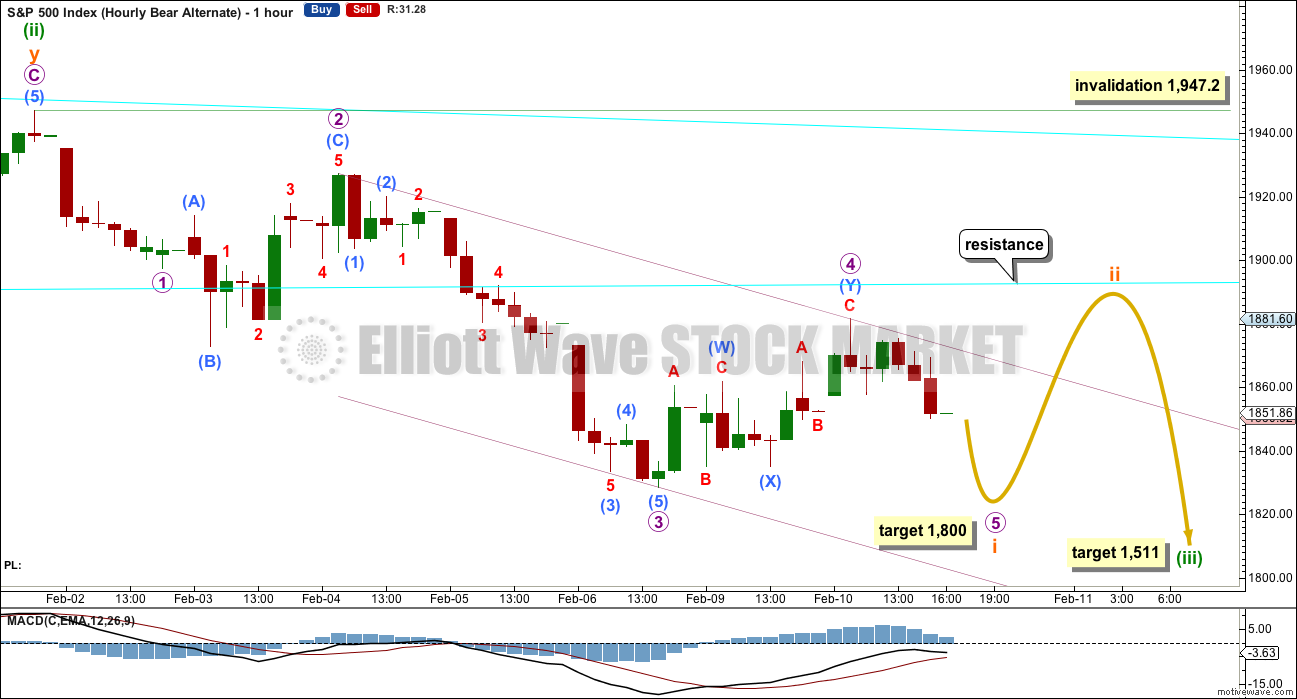
There are two ways to see the downwards movement from the high of minor wave 4. This may be an almost complete impulse as labelled here. It may also be two first and second waves as per the labelling on the hourly bear wave count today.
Both ideas work for this movement for both bull and bear wave counts.
Minute wave iv moved higher to start Wednesday’s session. The structure now subdivides neatly as a double zigzag. There is alternation between the deep 0.60 expanded flat of minute wave ii and the deep 0.54 double zigzag of minute wave iv; they are quite different structures even if they are of a similar depth.
Because minute wave iv breached the channel, which was drawn yesterday using Elliott’s first technique, the channel must be redrawn using the second technique. Draw the first trend line from the highs of minute waves ii to iv, then place a parallel copy on the low of minute wave iii. The lower edge of this channel may provide support and may be where minute wave v ends.
There is no Fibonacci ratio between minute waves i and iii. This makes it more likely that minute wave v would exhibit a Fibonacci ratio to either of minute waves i or iii. The most common is equality in length with the first wave, but in this case that would see minor wave 5 truncated. At 1,800 minute wave v would reach 1.618 the length of minute wave i.
BEAR ELLIOTT WAVE COUNT
DAILY CHART
Click chart to enlarge.
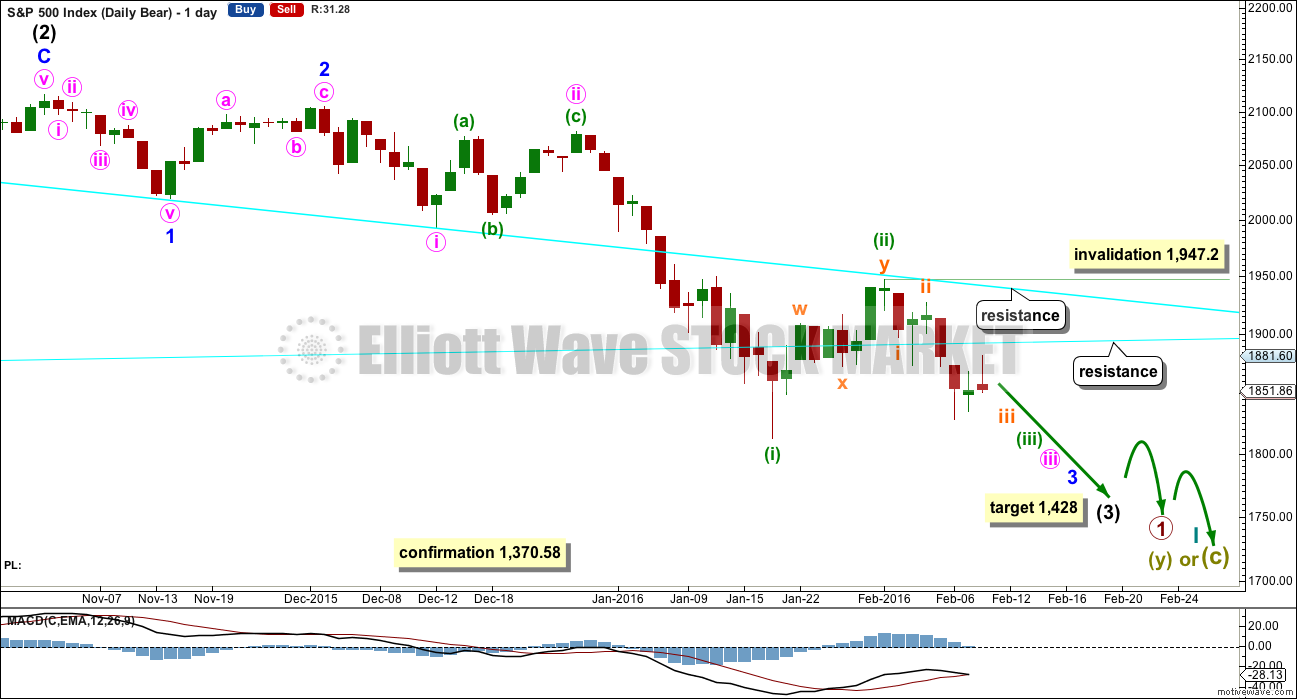
This bear wave count fits better than the bull with the even larger picture, super cycle analysis found here. It is also well supported by regular technical analysis at the monthly chart level.
Importantly, there is no lower invalidation point for this wave count. That means there is no lower limit to this bear market.
Downwards movement so far within January still looks like a third wave. This third wave for intermediate wave (3) still has a long way to go. It has to move far enough below the price territory of intermediate wave (1), which has its extreme at 1,867.01, to allow room for a following fourth wave correction to unfold which must remain below intermediate wave (1) price territory.
Intermediate wave (2) was a very deep 0.93 zigzag. Because intermediate wave (2) was so deep the best Fibonacci ratio to apply for the target of intermediate wave (3) is 2.618 which gives a target at 1,428. If intermediate wave (3) ends below this target, then the degree of labelling within this downwards movement may be moved up one degree; this may be primary wave 3 now unfolding and in its early stages.
Intermediate wave (2) lasted 25 sessions (no Fibonacci number), minor wave 2 lasted 11 sessions (no Fibonacci number), minute wave ii lasted 10 sessions (no Fibonacci number), minuette wave (ii) lasted a Fibonacci 8 sessions, and subminuette wave ii lasted just two sessions. Each successive second wave correction of a lower degree has a shorter duration which gives the wave count the right look, so far.
If subminuette wave ii continues any higher, it may not move above the start of subminuette wave i at 1,947.20.
The degree of labelling within minute wave iii may also be moved up one degree. This correction may be minute wave iv. I will wait to see how momentum behaves for the next wave down to make a final decision on which degree of labelling is correct. For now I will leave the labelling as the most likely for a second wave due to the duration and the structure of a double zigzag.
If the next wave down shows a strong increase in momentum, then it would be the middle of a big third wave.
If the next wave down shows weaker momentum than minuette wave (i), then it would be a fifth wave to end minor wave 3.
HOURLY CHART
Click chart to enlarge.
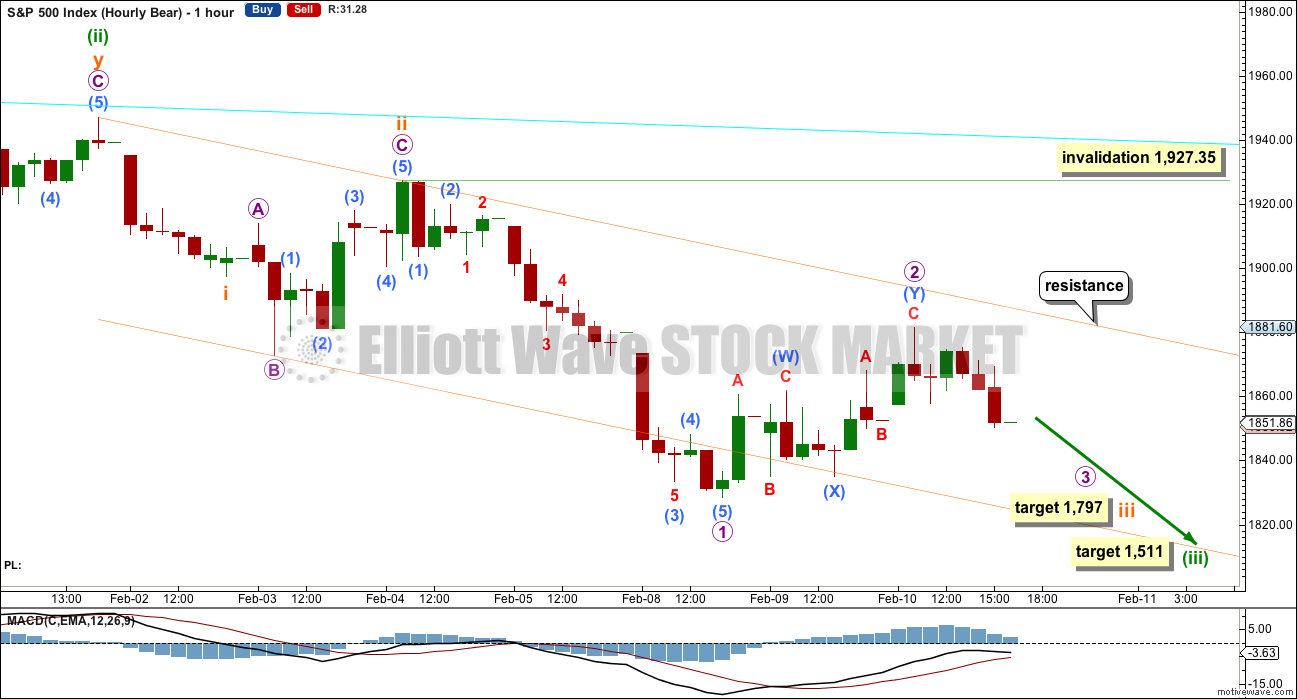
Subminuette waves i and ii may be complete within minuette wave (iii).
Subminuette wave ii was a deep 0.60 expanded flat lasting just 11 hours.
Micro wave 2 may have continued higher during Wednesday’s session. It now has lasted 12 hours, one more than subminuette wave ii one degree higher. The pattern of each successive second wave correction being quicker is no longer perfect, but the proportions are still very good and the wave count still has the right look at the daily chart level.
Micro wave 2 may not move beyond the start of micro wave 1 above 1,927.35. The orange channel is an adjusted base channel about subminuette waves i and ii. The upper edge should provide strong resistance for any more corrections. A lower degree second wave should not breach a base channel drawn about a first and second wave one or more degrees higher.
At 1,797 subminuette wave iii would reach 2.618 the length of subminuette wave i.
Subminuette wave i lasted one session and subminuette wave ii lasted two sessions. If subminuette wave iii is extended in price, it would also extend in time. A reasonable expectation would be for it to last a total Fibonacci 8 sessions. So far it has lasted 4.
At 1,511 minuette wave (iii) would reach 1.618 the length of minuette wave (i).
Minuette wave (i) lasted 14 sessions, one more than a Fibonacci 13. Minuette wave (ii) lasted a Fibonacci 8 sessions. If minuette wave (iii) is extended in price, it would also be extended in time. A reasonable expectation would be for it to last a total Fibonacci 21 sessions, give or take one or two either side of this number. So far it has lasted 7 sessions.
These expectations regarding time are rough estimates only. The S&P sometimes exhibits waves which have Fibonacci numbers for how many days / sessions they last, but not always.
ALTERNATE HOURLY CHART
Click chart to enlarge.
I will separate out this idea today because it is now beginning to have a better look.
Subminuette wave i may be incomplete and unfolding as a relatively short impulse. There is no Fibonacci ratio between micro waves 3 and 1 within subminuette wave i. At 1,800 micro wave 5 would reach 1.618 the length of micro wave 1. Micro wave 5 may end midway within the channel, or about the lower edge.
When micro wave 5 completes an impulse downwards, then a correction upwards should follow. The lower cyan line from the daily chart is copied over here today. Subminuette wave ii should find strong resistance at the cyan trend line, that may be where it ends.
Micro waves 2 and 4 are of a similar duration. This wave count has a better pattern in terms of duration of the corrections.
It is my judgement that this alternate and the main hourly wave counts (for the bear) have about an even probability.
The target for minuette wave (iii) is the same.
TECHNICAL ANALYSIS
DAILY CHART
Click chart to enlarge. Chart courtesy of StockCharts.com.
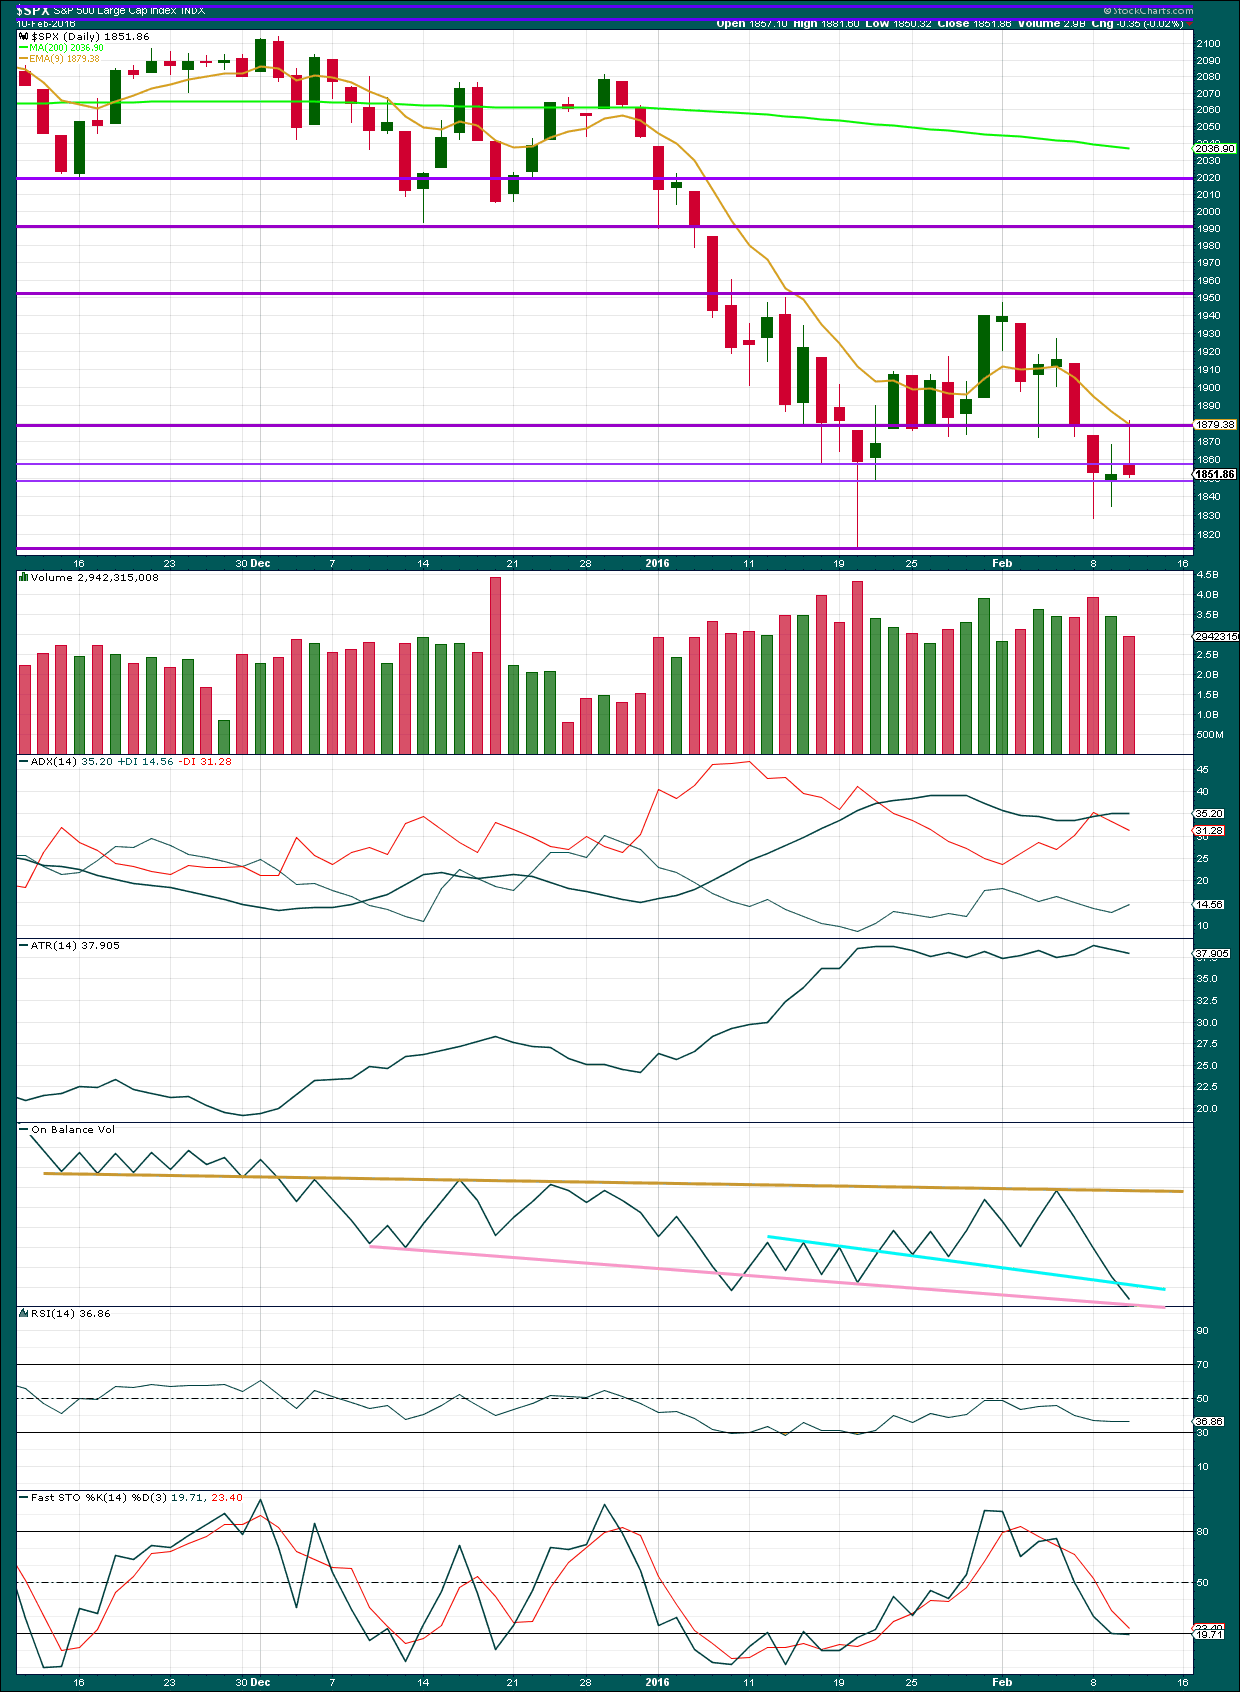
Today’s candlestick with a small red body completes a shooting star pattern. This comes after a small upwards trend which lasted only two days in total, but it was an upwards movement. This supports the Elliott wave count.
Volume for today’s downwards day is lighter though. The fall in price overall for the day was not supported by volume. However, the candlestick looks more corrective than impulsive, so lighter volume for today is not a serious concern. Overall, the volume profile remains mostly bearish. If today completes a small correction, then it would be expected to show lighter volume as a new high was made to end the correction.
Price may have found resistance at the red horizontal trend line about 1,875 and the 9 day EMA.
ADX is flat today indicating a possible short term correction. The trend, if it returns here, would still be down. ATR is still flat, so no trend is yet indicated. ADX and ATR are both lagging indicators as they are based upon 14 day averages.
On Balance Volume has broken below the cyan trend line. This line is not very long held, but it is reasonably shallow and has been repeatedly tested. This is a reasonable bearish indication today from OBV.
RSI is flat and not extreme. There is room for price to fall.
Stochastics is moving into oversold, but this indicator may remain extreme for periods of time during a trending market.
If the trend has not resumed as is indicated by ADX and ATR, then a range bound trading approach would now expect an upwards swing from here because price has found support and Stocastics is oversold. This approach is contrary to the Elliott wave analysis today.
DOW THEORY
For the bear wave count I am waiting for Dow Theory to confirm a market crash. I am choosing to use the S&P500, Dow Industrials, Dow Transportation, Nasdaq and I’ll add the Russell 2000 index. Major swing lows are noted below. So far the Industrials, Transportation and Russell 2000 have made new major swing lows. None of these indices have made new highs.
I am aware that this approach is extremely conservative. Original Dow Theory has already confirmed a major trend change as both the industrials and transportation indexes have made new major lows.
At this stage, if the S&P500 and Nasdaq also make new major swing lows, then my modified Dow Theory would confirm a major new bear market. At that stage, my only wave count would be the bear wave count.
The lows below are from October 2014. These lows were the last secondary correction within the primary trend which was the bull market from 2009.
These lows must be breached by a daily close below each point. So far the S&P has made a new low below 1,821.61, but it has not closed below 1,821.61.
S&P500: 1,821.61
Nasdaq: 4,117.84
DJT: 7,700.49 – this price point was breached.
DJIA: 15,855.12 – this price point was breached.
Russell 2000: 1,343.51 – this price point was breached.
This analysis is published @ 07:43 p.m. EST.
Jack
One more song til next time!
Goodbye horses – q Lazzarus
http://youtu.be/X_DVS_303kQ
Another great song…thank you.
Jack
You could listen to this song while the market moves – down – I don’t look for bounces.
http://youtu.be/RxabLA7UQ9k
Appreciate you Ace…
To Olga and all:
Well I lightened up a lot today but did keep some longer term lower risk shorts, mainly on KBE. While most of the market is highly correlated, the banking stocks are falling the fastest and are thus lower risk than the SPX, which is jumping around so much. I would say the same for IYT, although I sold my short there as well ’cause I didn’t like the action. But I expect to renew my shorts on these two as well as HYG when its clear that the market is heading back down.
Folks, what I do with the profits is that I pay myself first.
I usually take some profit out the trading world, and put it in a safe deposit box. Then, I buy the stuff I want or need. So, I take some of the profits out. It helps me by limiting me from taking too much risk. There is absolutely no reason to give the profit back to the market…
(IMHO) remember to pay yourself first.
Good points!
I agree – you should pay yourself…
Right on–critical advice
To Vernecarty, Rodney, Thomas, Olga, and Jack (and other of course):
I had to take profits today also, just like you guys. there just seems too much bullishness at 1812, and of course in the last 2 hours market bounced hard from 1810, bounced very hard. This dose not seem like THE middle of the third wave down we’re all looking for. If so, it would have cut through 1810 like butter…
I closed 100% of my short positions today, waiting for the bounce outlined on the “alternate daily bear”, and if the bounce doesn’t come, I’ll get back in on a bounce below 1800 somewhere.
I keep thinking about what happened in August/Sept of 2011, when worries of Asia and European banks made the market correct 20%, just to see it bounce and move up like a champ. Things are different now, but I can’t stop thinking about that… We might be seeing a repeat of 2011, and not 2008.
I’m also wondering: where are the trillions of dollars going from all this foreign market selloffs? A lot of cash has been raised over the past couple of months… I have a feeling they’re not being re-invested in foreign markets. What if all this foreign money (or even a small part of it) makes its way to the US stock markets? Investing in the “best of the worst” scenario… That would definitely give the US markets a big bounce…
I really don’t know… but all these thoughts made me close my short positions today near the session lows (with a very nice profit). Thanks to Lara’s great analysis and everyone’s input on a daily basis…
Good luck everyone!
2011 was in an uptrend so it can’t apply here since we are now in a major trend change pointing down-down and down!
I Guess, I am the “OTHER”!
Good Luck to you all as well.
I completely disagree with the above viewpoint. Nothing plays out exactly as the last times… I thought this was an EW service… I now have two EW’s that are lock step with the preferred daily, weekly & monthly bear counts here.
You all have to decide what risks to take for your own personal situations… so I will just watch quietly for the next few weeks. I said everything I wanted to say and have nothing new to add for now.
Good Luck all!
Come on Joseph, we all are riding these waves together…key point is to make money.
The big move is gonna show up at some point.
I for one enjoy reading your comments.
I also greatly appreciate your comments Joseph. Even though I said I was concerned about a bounce, I continue to state that the waterfall may materialize. There is a good chance we may see another new low before any bounce. There are so many ways to profit from this market and all strategies and analysis are helpful to me. Thanks for your past comments and I hope to hear from you again.
I’m watching the movie –
The big short again!
Good movie….
I lightened my short a bit today, but not totally out. We could easily gap down again tomorrow, so don’t want to be totally out of the game. If we bounce higher, I’ll consider it an absolute gift. It should also become clear as we bounce higher, whether the bounce is another correction, or something that needs to be taken a bit more seriously.
Unfortunately (imho) the only way to catch the large waves is to take a small amount of risk (ideally risking profit, not principle) and keep an acceptable amount of skin in the game. It doesn’t always do you any good even if you can follow the Elliot waves, as the market tends to stay just above invalidation points then gap through them just like it did today. The reaction of some members is absolutely normal (and good risk management) especially just after a bull market that lasted what seemed like an eternity.
This also indicates that the market has a long way to fall (at some point) in order to reverse current psychology. I would be more worried if everyone expected the market was never going to stop falling.
Olga, I was missing you today…
I’m usually lurking 🙂
Alright ari, way to go…
I have certainly learned the hard way to not leave profits sitting in the market unclaimed. The one exception is long term positions usually in the form of leap contracts if a strategic large position is being built.
The round number pivots are also being hotly contested so at least a pause around the 1800 level was not only foreseeable, it was also predicted by the wave count. The trend is still down, but liquidation of some profitable trades allows re-entry at a better price. This is really the only way to steadily build a trading account. Ari is also right on the money about taking profits out of the market- very important to consistently turn digital gains into something more tangible! 🙂
Sheesh,, I was watching her tick toward breaking the lows when all of a sudden whoosh up she went, Im looking at the chart and wondering what happened, who said what to again save the day. come to find out it could be a bogus report? how hair triggered is that? I say no fair, erase that abc up , it shouldnt be there.
If you get a do-over, I want one too!
Take the money and run…this thing might go down to about 1775 before a more meaningful bounce.
Looking forward to see what Lara has to say.
DJI is below the 200 DMA (15877.88) on the weekly and may close below with another down day or holding flat.
SPX within range of closing below the 200DMA (1789.98) on the weekly with another down day.
Those were short 5th waves, at both the minor and the minute levels. For a serious bear market, the 5th waves ought to look more like what you see in a commodity–the longest of the five. I’m thinking that there is no real fear in this market just yet, and expecting a fairly lengthy (time and distance wise) retracement.
Having said that, I will leave trading it to you more adventurous types–too dangerous for me. I am happy to wait for it to get up to 1900+ and grab a big short.
In the meantime, it appears to me that there could be a nice opportunity in DUST. Looks like it might be ready for some action. Anybody else have any thoughts on that?
You had the opportunity to do that in the 1915 to 1940 range last week and didn’t do it.
That ship has sailed IMO.
Are you talking about NUGT? Yep, I did miss it; it was too risky. But now I’m thinking that its time for a fall. DUST is the inverse, so it represents a retracement of gold stocks’ recent rise. Normally I don’t trade retracements either, but with gold stocks its never a normal ride.
Absolutely. The mayflower has left! We can get over night futures run up moves and slight daily up moves but the trend is down! The problem with early stages of bear markets. Most people expect bounces/retracement we had positive divergence for days on the spx daily with Macd but price kept falling even today and trying to figure out the exact moment out in a down trend is like finding a needle in a haystack! Albeiet – certain large percentage decline days of -3% could give a bounce the following day!
Not necessarily guys. I would not at all be surprised to see a sharp doubling back of both indices toward the previously contested round numbers. This not only opens the door for a quick profitable trade to the upside, it allows one to get positioned for the really big move, which I think is several days away at the very least. This is a situation in which credit spreads are simply awesome for trading both moves with greatly reduced risk.
Corrective waves and B waves specifically are notoriously difficult to trade. It can be done profitably but the reliability of that is low. If I recall there are at least 12 different corrective patterns each with corrective patterns within. Like you, I may be content to wait till we get the next over bought situation.
Or, it is still possible for the waterfall to begin.
Yes it could, and that’s one reason why I think its too risky to trade the rise. I’ll be watching it closely like everybody else.
I count 23. That includes all the different kinds of triangles, flats and combinations.
If you include all the different flats and triangles within a combination… then it would be more.
Thanks. You told us many times before but I could not remember exactly how many. 23! wow.
Sorry my earlier post seems to have got lost in the crowd. Lara can I ask, do you see a multi-year bottom for oil any time soon, and do you have any projections at all? Thanks
Lara posts oil analysis in her EW gold blog every so often. I think some updates have been free to view but not sure about recent ones
It’s now for members only on EWG.
I do not see a low in for Oil yet.
Lara posted the comment below on her EW gold blog by mistake (had a few of us over there looking seriously puzzled for a short while) 🙂 She likes to check we are paying attention every so often 😉
Lara
February 11, 2016 at 3:02 pm
And… now the current impulse is over.
The target at 1,800 was probably too low.
If we are going to see another Dead Cat Bounce then this is probably the start here.
How high can a Dead Cat Bounce?
(I’m thinking of making a T-Shirt with that on it 🙂 )
Me thinks I detect a bit of humor.
Did anybody hear my joke about how high can a dead cat bounce? 😀
Lara, your analysis in one word: impressive…I think it has to do with the surfing athletic capabilities :).
A big thank you from USA.
You’re welcome, and thank you.
leave it to OPEC….good lord
Another bogus Oil comment… nothing has changed or will change! All BS!
“” Even WSJ Admits OPEC Production Cut Story “May Be Bogus” “”
It’s getting old now,sell those rips 🙂
It will end. This is all a joke to be honest as it reminds me of 2008 when news hit then market pushed so fast so high – we did 1% in a blink of an eye today. Every rookie trader is calling this market now – that is when you know it is falling apart!
I agree 100%
Another overnight???… I rather it occur during the regular trading day.
At this point, whatever it takes to sink this market. The problem with overnight is they keep buying it during the day.
I tried to go back in history and look at over night 3rd waves. Hard to spot them…
Here comes that bounce
I have another short which is again profitable today. I am considering again cashing in that profit… because I expect another bounce. I don’t like to see profits disappear.
But I am also aware that a huge strong move down is still ahead, and it will probably materialise while I am fast asleep so I need to be positioned short while I can.
Most frustrating. I am still learning how to trade this market, so while I share with you all my moves please remember I have been analysing it for 9 years daily but only very recently trading it myself. The volatility put me off, and my last broker didn’t offer it. My new broker does.
Here is my alternate bear hourly. I do tend today to lean towards this wave count and I will probably swap it over to be the main bear hourly, my preferred count. There is divergence today with price and MACD at the hourly level.
Short term I expect a final low and I may choose to exit there. Then wait for a bounce to unfold, and enter short again. Target still 1,800.
The key now is that lower cyan line. If a bounce comes up to touch that I will enter short there. I expect that line to offer strong resistance, and end the next bounce.
But remember, this comes with the warning that a strong downwards move should be ahead…. and a bounce cannot be relied upon.
Before I sign off.
Does this bounce back up potentially to 1,870-1,900 you are looking for still fall within the 15 fib day rough estimate to the target 1,500 or 1428?
We should know what’s ahead later this evening. A decisive break of SPX 1800 in the futures market is my next downside trigger.
Any time frames for the aforementioned possibility?
Questions will be answered in next analysis.
could we be seeing an ABC correction of the morning lows. C=A at 1830.63?? Thoughts?
Yes, it was. And now a new low. The final fifth wave maybe? That would be my pick anyway.
Jack, Joseph and Rodney:
I am taking the rest of the day off maybe I will bounce in tomorrow….
laters….
Joesph, would you email me your best choice for other EW service (davey_andrew@yahoo.com)
EWSM is my top choice but occasionally in confusing markets I do like a 2nd opinion.
You can mention other EW sources here. I have no problem with that.
I don’t mind competition. If I want to keep members here then I have to be better than my competition. That’s okay. That’s my goal.
imo – there is no substitute for the ew on this site – and believe me I had most online trading subscriptions. I had switched my options and futures subscription for this when I realized all they had been doing is buying the dip for years! As soon as the market started breaking down the options services just went down hill!
Thanks Lara–your goal of excellence is well met. As you know, but others here may not, I subscribe to both EWSM and EWG so obviously have tremendous confidence in your analysis and integrity.
Thanks Davey. Then you will know that my Gold analysis today missed a big upwards move.
Still, Oil is behaving as expected. I can’t get them all right all the time 🙂
Enough to profit. That’s the idea.
Sorry, only posting here… no emails.
I rather not say…
On your alternate bear hourly chart you have a target for the end of micro wave 5 as 1800.
We touched 1812 today, is that close enough to complete subminuette 1?
Because if it is, it looks like subminuette 2 could be a pretty big rally.
thx
Norman,
I believe the micro wave 5 must go lower than the previous low of 1812.29 otherwise it is a truncated fifth wave. That is not likely. Of course, Lara must speak for herself but I think I have it correct. She does not like to use truncations regularly.
Jack and Joseph,
SPX 1,785 is the next target now imo…..
Options, I do agree with Vern’s opinion below…at least that is how I played it…
I was gonna post a similar thing yesterday, but I’ve notice some folks are way to emotional about this third wave… to the point that IMHO we’re missing all these 4th and 5th waves…
Again, I could be wrong…, but I got to tell you taking profits feels good…
I was looking for a bounce as well. However, I just can’t believe it here. To many times we came down here. That game is getting old. We should punch right through the floor and sink. This is not how markets functions based on what I know. Enough of the bounce imo. Time to sink fast!
All the technicals have a cross over. For it to bounce would negate them all. I just dont buy it sorry imo…
We’re going to, and it is going to be spectacular…way too many bulls out there right now…Verizon announced they are gonna borrow more money to buy more shares…
It just all of the down turn don’t happen at once…
Again I could be wrong…
Thanks, I do appreciate it. Being safe is good.
1,800 should be taken out right around here imo….
You need to ask yourself is 6 times total on a rising trend line then falling back not enough?
Thanks,
Ace
I sold 100% of my position when we bounced off of 1812…
It is possible that I have left some money on the table, and I am ok with that. I don’t try to be perfect. I’ll wait for a setup again. If I’ve one, I’ll take it. If I don’t, I am not gonna worry about it…
IMHO 1812 was very well defended…
I am looking for opportunities to go long equities and short gold…(very very very small positions). Again, I might not do it.
Ok cool. I am going to wait for the weeks to develop for clarification.
For my understanding. I believe the trend is down and I dont day trade so whatever bounce we get is whatever we get. Should be short lived imo…
I remain FULLY Positioned Short…. I believe in the Preferred Daily, Weekly & Monthly Bear Counts as laid out by Lara. That’s why I renewed my subscription recently to add this EW service to my other EW services.
I will stay this way for at least another 2 to 4 months… depending on how the counts play out for these periods.
I usually don’t do very short term trades.
Yeah, I would hate to miss a -200 point decline over night 😉
Joseph
I usually swing for the fences….
It is not for everyone imo…
Well I have been planning for this for 2+ years… the fundaments now match up with the Bear Count.
Debt worldwide is unsustainable…
Reached the point that more Debt will NOT burry the issue any longer…
Deflation is accelerating…
Fed out of ammo…
Negative interest rates are a fools game…
Corporate Buybacks maxed out and will not continue…
Corporate margins maxed out + no revenue growth possible…
High Yield Debt sends it’s signal…
It’s the perfect set-up…
Joseph
I traded this market day in day out intensely through out the entire topping process. Was a fascinating experience! Plenty of pain trades, plenty of lucky bets. All in all – like you I have been waiting years for this drop!
My timing may still be off… but I covered all my bases and I am willing to put my money on it and take the swing.
The bigger the risk… the BIGGER the reward!
Hello Joseph. I have been planning for this bear as well. I think this bear market is gonna be a good market for the bears…
1812 taken. Lets see the close!
SPX needs to break 1770 to the downside before we head for 1500.00 The next downside obstacle is 1800 and when it breaks, that’s it until primary one is done. I think we are going to get a good bounce before this happens.
UVXY putting in a doji above upper B band. It sure does look like this was a fifth wave and that we are probably going to get a bounce. I still favor the bearish count so I think it would be sub-min two up. Trade safe.
Anyone want to speculate on which hourly scenario we are in? I usually hold mid to long term but the alternate hourly upside is significant.
Davey, I have yet to meet someone that went broke taking profit…
Bears make money…
Bulls make money…
Pigs….
I don’t know which one. I am waiting for the market to tell.
And Jack’s comment above is a great one to remember, at least for me.
Rollin’, rollin’, rollin’ on the river…….
Rollin’, rollin’, rollin’ on the river……
Rollin’, rollin’, rollin’ on the river……
Rollin’, rollin’, rollin’ on the…. Niagara…. River…………….
Negative interest rates are a disaster!!!!
There will be a Revolt in the USA if tried here!!!!
A ban of CASH in USA will cause worse than a Revolt!!!
Senator’s and Congressmen…. we are watching very closely and taking notes + names on who is perceived in encouraging or supporting a negative interest rate policy. That will be the last thing you every do in office! You will be a goner or worse!
Nice!
Metallica – The Day That Never Comes
https://www.youtube.com/watch?v=mRitfbhITLM
Excellent
Options where have you been my man in all this action…this place hasn’t been the same…
Jack,
Just due diligence I had to work through.
Great…if you don’t see me post a whole lot is because I’ve a business that I need to run. It keeps me busy, but I really enjoy reading folks comments…especially yours because you keep things interesting
Thank you,
Jack,
I got an old habit trying to kick. I am doing this while the market drops….
lol I understand…
If what happened at DJI 16,000.00 was any indication, we could be in for another protracted dogfight over SPX 1800.00 I will stay 50% short medium and long term until that pivot is decisively broken. Adding a few upside hedges to those form last Friday although they may turn out to be nothing more than insurance premium. Have a great rest of the day everybody!
right at lower trend line again (orange line on hourly bear)
Ftse breaking short term trend ,waiting for confirmation
Impulse down completed. Size of upcoming bounce critical to market’s next move.
Squeeze under way
The Final Trap underway!
What is the next point of resistance?
we bounced right off of that lower orange channel line on the hourly bear chart..almost exactly
Rolling on the river… Rollen Yea….
Rolling on the river…
Whats everyones thoughts on the current set up. Best to stay back on the side lines or a good entry suggestions?
I took profits on most short term positions. UVXY did punch through upper B band but printing full candle, no long upper wick so far so it looks like more downside ahead…
Paresh,
If you followed the blog this week then you know I exited all my short positions on Tuesday afternoon. In reflection / hindsight here are some of my reasons;
1) I wanted to protect my profits which were substantial,
2) I needed a break from the frazzle I was experiencing which for me tends to lead to emotional decisions and I know that is to be avoided,
3) I was concerned with the patterns and wave counts not acting how I expected,
4) the SPX failed to break and close below 1812, and
5) the daily MACD is at a very low / oversold position. Monthly and weekly MACD are strongly down as should be in a bear market. But the daily MACD is still strong in itself and I see it soon bottoming.
I want to wait until I see the daily MACD in a position to fall hard. That is not from low levels. In the 3rd of a 3rd of a 3rd etc, the move should be very powerful and blast passed support lines etc. And I do not think daily MACD supports that event yet. Yet.
So my thoughts are that we will see a short term bottom with a move up possibly to 1900 or there about. If I had not exited Tuesday, I certainly would have even bigger profits now. And I guess I would be exiting now and then waiting to see the developments.
My problem as a trader short term and long term is not fear or fear of risk. Rather my issue is greed. In the past I wanted to get in a soon as I thought it was time because I wanted to catch the very turning point. I saw lots of times that I was too early and too big of a position. And on the sell side, I wanted to wait until the very last minute to maximize my profit only to see profits given back.
My account does much better when I am much more patient and much less greedy. So do my emotions. In addition, I have a full time day job that often requires me to be away from the markets for hours and days at a time. Sometimes these are unscheduled and beyond my control. All of this impacts how I work (not play) in these financial markets.
I am happy for those who stayed in when I got out if they were short, very happy. I am happy for myself and content. And now the frazzled state is less and less. And I love this blog and am grateful to Lara and all the commentators.
I am waiting to see what happens. A dead cat bounce towards 1900? or A waterfall as we pass through 1812 and then through 1775 where the bottom is falling out? When either is reached, I will reassess and see if good positions are available. Of course that is much more difficult in the waterfall.
Thank you for sharing an insight into how you manage your emotions Rodney.
Risk management is THE most important aspect of trading.
And I think that trading is mostly overcoming emotion to make calculated risks. So comments like yours are very valuable.
As I said before, you are too nice Lara. (Laugh. Life is short not to enjoy it and have fun.)
Thank you Rodney for spending the time to write back. Where do I find the Blog? I did see you post on the forum here. I really do appreciate everyones contribution its nice to not feel alone against the market
I started trading when I was 18 just with a few shares, but then when I turned 26 back in 2006, I started with CFDs and was lucky enough to ride the waves on the Dow and Dollar in the 2007-2009 waves down. I had set a target and in all honest smashed it and should have walked away. Should being the operative word, Greed got the better of me, it was easy money and I would run my business and trade and barely sleep. All the rules were broken, I over traded and just kept going, thinking I had the midas touch. Yeah we all know whats coming…..disaster, not only what I gained and a lot more went as I become stubborn thinking I was right and the market was wrong and for that I have a lot to pay for.
Fortunately I have my health and family though it has taken me countless mistakes to learn the lessons that I have needed. As I said last week I am out of powder really but managed to accumulate a few small positions that paid well today
The biggest lesson I need to learn is not to be greedy and to be able to walk away from the market. I know this is a great opportunity but opportunities do come and as you all say no one goes bust taking a profit
Once again thank you to all the members, I know I do not post lots of information but your analysis as helped me a great deal
You are welcome Paresh. When I use the term blog, it is really this forum.
The number of posts you make is of no consequence to me. You are here like me both learning and sharing.
By the way, regarding emotions, the market has a way of handing us our heads on a platter if we do not know ourselves. The market teaches us who we are if we listen. The lessons are similar to what I learn when I do a long trek in the wildernesses by myself having no human contact for days and days on end. You learn who you are.
NEW 6 month lows in the overnight…
NQ… 3862.25
TF… 936.20
ES… 1802.50
YM not quite there 15505.00
WTI… $26.78 at the moment.
WTI $26.43
I would love to hear from Olga, she perfectly called the low target last week before the brief correction.
Something of keen interest on the bear hourly count. According to Lara’s labeling, the interim low on January 20 actually occurred after submin one was over. That low, and hammer was actually the B wave of the ABC corrective move for submin 2. UVXY also put in a mini spike and had an interim top that day – in the middle of a corrective wave!!!!!!
Why is this important? It is EXACTLY what happened last August when UVXY spiked during the B leg of a CORRECTIVE wave four that lead to the truncated fifth. I know for some of you this may be a bit in the weeds, but for someone who has traded UVXY for some time now, realizing that spikes do not always NECESSARILY come at the end of motive waves is HUGE! I now understand why I got my head handed to me last August.
This is definitely a game changer and I would never have figured this out if it were not for Lara’s incredible analytical skills. The lady is truly amazing! Thanks Lara! As you know, this has bugged me for the last several months. I finally get it! 🙂
New battle lines being drawn around SPX 1800 pivot in futures. Holding so far with a nice hammer in that area. A break or rejection at that futures level would be insightful for how things go today I suspect…
I guess the investing community decided the DB banksters were not so brilliant after all. Yesterday they announced with great fanfare that they were “willing” to buy back all their outstanding bonds. They then pointed out that so many of these bonds were trading at a discount to par – 10, 15 even 20%, they would book an IMMEDIATE profit that would flow to their bottom line and boost their reserves. Yeah right!
VOILA! European banks stocks jump ten per cent!
I guess folk had a few hours to THINK about it…. 😀 😀 😀
That’s very kind, thank you.
I think you mean the micro B label on the hourly bear? That was on Feb 3rd.
And yes. Most annoying and confusing B waves can be, especially when they make new price extremes.
Is it me, or can the comments sometimes become very hard to follow here? Is there a way to have newest comments always at the top, or does it depend on whether someone is writing a new comment or replying to an old one? Thanks
StuartP!
Yep, where your comment appears depends on who you reply to. To get all the recent replies you have to scan the whole stack.
The board is designed to permit members to respond to a particular post via the reply button so naturally even later comments made to an earlier post will stay with that thread if that is the poster’s intention. Just putting the most recent post at the top may result in loss of context. Users have the option of how they want posts to appear and can opt for immediacy rather than context if they so choose. In fact I noticed members occasionally re-post earlier comments. Hope that helps a bit.
Ftse has the looks of an abc correction atm off the lows ,currently in b wave.i think we will see a upside breakout which I fully intend to add too.gla
I plan on taking profits on all short term positions and half of medium and long term ones as well at the open. I would not be surprised to see a vicious whipsaw as a possible five of submin one rapidly concludes and all the folk trying to get short intraday get their faces ripped off as submin two takes off on an intraday reversal. The market generally will do whatever it takes to fool the crowd.
UVXY will give an early warning of any impending reversal. If it closes at or close to the high of the day more immediate downside is more likely.
With ya. I completely agree. Betcha we’re doing the alternate, with a whipsaw all the way back over 1900.
Not this time IMO
One thing is sure – it is NOT going to be a boring trading day!
Never under-estimate the banksters. When I find a wave count that fits their slippery personality, I go with it! 😀
RE-POST:
Joseph
February 10, 2016 at 9:29 pm
The sh_t is about to hit the fan. Read the tea leaves.
THAT ONLY fits with the main Bear wave count. A breach and a close below 1800 turns on the Niagara River.
Unfortunately I believe it turns on overnight. I would prefer it turns on during the regular day… but my gut tells me overnight.
NEW 6 month lows in…
NQ… 3871.25
TF… 939.40
ES is close @ 1808.75
WTI… 26.68
BIG volume in the initial move lower from 3:00AM to 4:30AM
I will continue to stay fully positioned short… no matter what happens the next few days. I expect the Niagara River to be turned on at any time.
Negative interest rates are a disaster!!!!
Revolt is USA if tried here!!!!
That s/b…
There will be a Revolt in the USA if tried here!!!!
A ban of CASH in USA will cause worse than a Revolt!!!
The Fed Policy error was moving interest rates below a Fed Funds Rate of 3.00%… below 3.00% was and is like pushing on a string!
In a capitalist system the cleansing process MUST take place. Delaying that cleansing makes everything 10 times worse and for 20 times longer!
The devious EU ministers are now in quite a hurry to impose further restrictions on the use of cash, ostensibly to “combat terrorism”. I feel so sorry for the folk in Europe. They are like the proverbial frog in the slowly boiling pot. I am wondering what is going to take to make them wake up and rid themselves of that albatross around their necks. My BVI citizenship allows me to apply for an EU passport and I have thought about it for a few years in case we ever wanted to move there and do business in the EU. That place is starting to look more and more like a death trap for folk who value their liberty.
to “combat terrorism”…. That will be the sales pitch but nothing could be further from the truth!
Citizens from around the world should throw their representatives out of office for even considering such a move! That is what will happen in the USA.
I would like to see them enforce a ban on cash in the good old US of A. Not only will it fail miserably as people will just ignore it, more hoarding will take place and the bartering community will explode in size. Meanwhile, the banks will all collapse as people rush to withdraw their money. Talk about dumb ideas!
DJI will today finally join the other indices in taking out last year’s August lows in confirmation of DOW theory bear market…
DJI pivot demolished as expected. DOW futures down 500 and for some reason Bloomberg not showing the true carnage. They are still flying a 300 point decline. They are not usually that much time delayed. The previous jacked-up futures are clearly being unwound at the expense of all the gullible souls who chased the pump the last few days. It sure is starting to look, smell and feel like third wave territory. As I have often said, when a third wave arrives nobody looks around asking- “Are we there yet?!” 😀
Where do you see DOW down 500??? I am seeing what blom. is seeing.
My mistake. Was looking at DOW 30 futures on my screen…
Banks getting destroyed, hope you guys/gals manage to get some shorts in 🙂
Surprise to the Downside. Will start clearing some positions as we get towards 1812. Need to save the power just in case and better to take a profit and get back if needed
There is another reason why the alternate may be correct. I am starting to think that one effect of bankster intervention in the market is to cause EW extension. It has to be clear to even a casual observer that they are dumping huge amounts of cash into this stalling market in an attempt to forestall the inevitable. Their conduct so far makes it abundantly clear that rather than letting the market take its natural course, they are hell-bent on proving that central banks are the ultimate power in the universe, never mind the lessons of history. They did indeed have a great run the past seven years – but all things must come to an end!The price action makes a very strong case for an extending sub-min one, and fits perfectly with observed bankster activity. I think we will indeed see a multi-day bounce around the 1800 round number level, and not see truly strong downward momentum until sub-min three arrives. As the waves progress, the ability of the banksters to arrest the downward drive will no doubt be steadily diminished, but I think that one certain consequence of their folly will be a third wave that travels farther, and wreaks more havoc than even Lara’s current target anticipates. I too will be unloading shorts around the 1800.00 pivot in anticipation of a more favorable entry at the next bounce. I think all hell is about to break loose, but not just yet…not just yet…!
From an EW POV:
When I look at this current structure of the last 7 sessions on the daily chart it does look very much like a five unfolding. So another first wave is extending.
From a social mood / EW POV:
I see the banksters slightly differently to you. So far their activity has been condoned by wider society. What I mean is, after the GFC the bail outs of banks and companies considered “too big to fail” wasn’t entirely accepted, but overall it wasn’t condoned. It didn’t result in public revolt. Some grumbled, many thought it necessary.
In the same way now the behaviour of the banks or any other large institution in pumping money into the markets trying to hold up prices is something I see as part of social mood. They’ll do it while they think they can and while it doesn’t cause public revolt. They’re doing it because they have not capitulated to fear. They probably don’t believe a bear market is possible. And that fits perfectly with the psychology of the early stages of a bear market. It is not recognised as a bear market until the middle. And we are still near the very beginning. Optimism still reigns.
I see the bansters as very much part of wider society. Their behaviour as part of social mood, acting in synch with wider social mood.
Excellent points. I absolutely agree that the banksters’ success was indeed enabled by social mood that permitted the money dumping. In a strange kind of way, I would also argue that their actions were not fueled only by hubris, but also by fear. Think about it. Nobody knows better than the banksters what a ticking time bomb the entire industry is because of the monstrous derivatives they have created with their financial engineering. They fully understood that it was very much in their best interests to keep the bubble inflated because they knew exactly what would happen to them when the thing burst. So while I agree that the banksters are indeed a part of social mood, in another sense they are way ahead of the crowd. So strange as it seems, I think the banksters for the last seven years have been acting out of fear, in the interest of self-preservation, and the investing and trading crowd assisting them by acting out of greed. We are about to witness what happens when BOTH subsets of the society are motivated by the former. Our perspectives are not that dissimilar! 🙂
I agree completely actually.
I’ll just add, that the bull market from 2009 – 2011 as a B wave makes total sense from an EW POV.
Fuelled mostly by fear… yet a bull market to new highs. Thats a B wave.
Don’t forget with the elections looming in US, current administration is on a farewell phase and less effective on directing FED. Current administration has gotten what they needed at the time from FED and now are less concerned. All to say we might see these volatile markets for months to come.
Waiting and Watching but agree with vernecarty, initial panic selloff might reverse fast to catch folks on the wrong side of the trade. Had sold some profitable positions yesterday and might deply the powder today to catch the swing (assuming market presents that opportunity and not ramps up in premarket).
I don’t know about you guys, but I think its the alternate. All my puts are gone when we get down near 1812. Will keep some shorts. If it looks like a weak correction from there I’ll buy my puts back, but I’m thinking that an intermediate level correction would take us back up to an early gift from the Easter bunny and an ideal short.
The sh_t is about to hit the fan. Read the tea leaves.
THAT ONLY fits with the main Bear wave count. A breach and a close below 1800 turns on the Niagara River.
Unfortunately I believe it turns on overnight. I would prefer it turns on during the regular day… but my gut tells me overnight.
We get a correction at around 1800 either way. The only difference for right now is that its a smaller correction if its the main count.
I concour – I can also say things will happen fast! Real fast!
No jinx finally!!!
Btw – I’m out till tommorow morning .
Bye
WTI at $26.96 right now.
Nice!
A tech question – Today the up wave over lapped the prev 2 wave . So is it not the 1 2 , i ii count the only count for the last 8 market days ?
No. Both counts as presented with the bear are valid.
If this is a fourth wave it has not overlapped into its counterpart first wave price territory.
The rule is a fourth wave may not overlap into first wave price territory. Not that a fourth wave may not overlap into second wave price territory.
Now, for those of you who use Motive Wave you will notice that a wave count such as this gives a warning and tells you to relabel your count. This is wrong. There is just no other way to state it, it’s just wrong. And I do wish they’d change that.
They have some odd things in Motive Wave. That is the one that annoys me the most.
But overall it’s a brilliant product and I couldn’t do this work without it.
Could you tell us a bit more about MotiveWave? Is it charting software? It sounds like something I might like to try if you really like it …:)
GDX is looking really good here.
Yes, but look out below. The gold stocks are starting to act like safe havens again, rising when the market tanks. Watch them reverse when we get to SPX 1800.
I sure hope nobody shorted Gold! 🙂
hee hee,, 1st
Hi Lara
May I ask, do you have any projections for a low in oil at all?
I’m coming desperately close to taking a big long term position. Fully funded, and with a long term view we must be getting close to a bottom?
Thanks a lot
I see there are (at least) 2 folks called Stuart here 🙂
I’m going to start signing my posts with StuartN to save any confusion
🙂
Ha, could get confusing! We’re multiplying!!
I’ll sign off StuartP to help!
StuartP
Hello Stuarts! Hows ya’ll doin’! 😀