
A little upwards movement was expected to begin Tuesday’s session, a small correction to be over in less than 11 hours.
So far price has moved higher on a small ranging day and the correction has lasted 9 hours.
Summary: The trend is still down. A very strong third wave is most likely still building. In the short term, this correction looks like it may now be over. Tomorrow may see strong downwards movement. The mid term target for the preferred bear wave count is still 1,428.
To see how each of the bull and bear wave counts fit within a larger time frame see the Grand Supercycle Analysis.
To see detail of the bull market from 2009 to the all time high on weekly charts, click here.
Last published monthly charts can be seen here.
If I was asked to pick a winner (which I am reluctant to do) I would say the bear wave count has a higher probability. It is better supported by regular technical analysis at the monthly chart level, it fits the Grand Supercycle analysis better, and it has overall the “right look”.
New updates to this analysis are in bold.
BULL ELLIOTT WAVE COUNT
DAILY CHART – COMBINATION OR FLAT
Click chart to enlarge.
This wave count is bullish at Super Cycle degree.
Cycle wave IV may not move into cycle wave I price territory below 1,370.58. If this bull wave count is invalidated by downwards movement, then the bear wave count shall be fully confirmed.
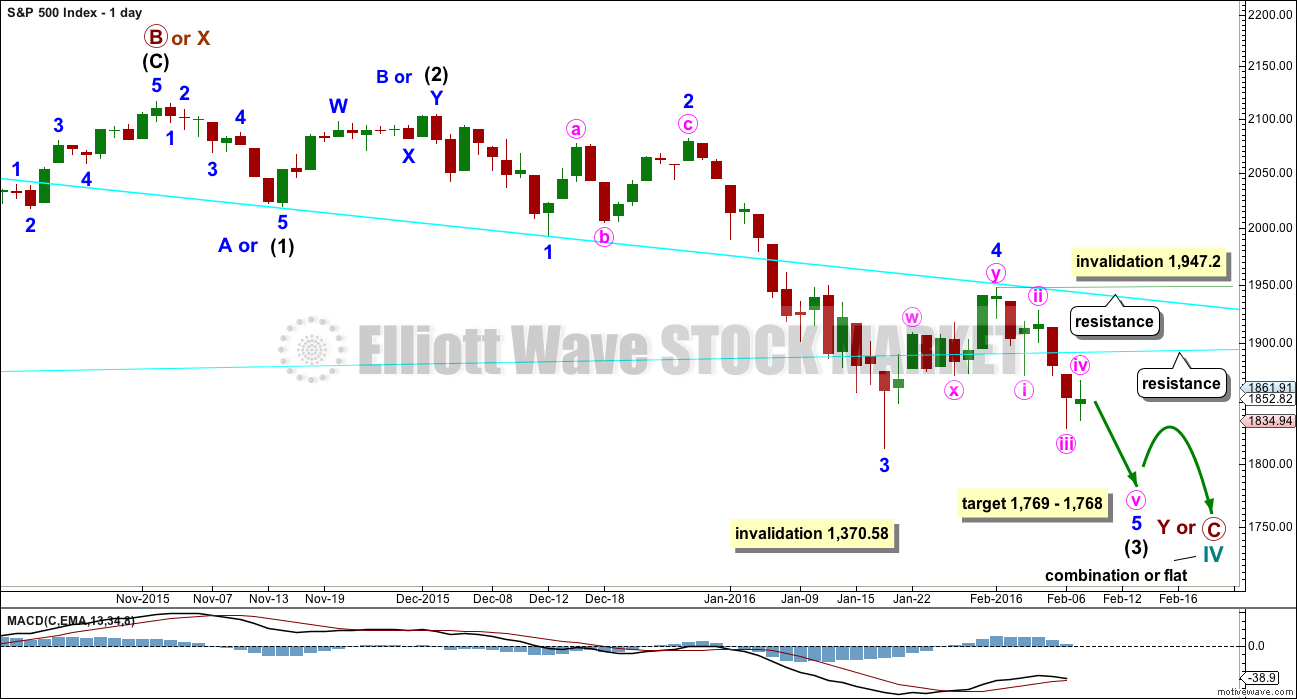
Cycle wave II was a shallow 0.41 zigzag lasting three months. Cycle wave IV should exhibit alternation in structure and maybe also alternation in depth. Cycle wave IV may be a flat, or combination.
Cycle wave IV may end within the price range of the fourth wave of one lesser degree. Because of the good Fibonacci ratio for primary wave 3 and the perfect subdivisions within it, I am confident that primary wave 4 has its range from 1,730 to 1,647.
Primary wave C should subdivide as a five and primary wave Y should begin with a zigzag downwards. This downwards movement is either intermediate waves (1)-(2)-(3) of an impulse for primary wave C or minor waves A-B-C of a zigzag for intermediate wave (A). Both these ideas need to see a five down complete towards the target, so at this stage there is no divergence in expectations regarding targets or direction. When and if these two ideas diverge, I will separate them out into two separate charts. For now I will keep the number of charts to a minimum.
Primary wave A or W lasted three months. Primary wave C or Y may be expected to also last about three months. It is now in its second month at this stage and may not be able to complete in just one more. It may be longer in duration, perhaps a Fibonacci five months. That would still give a combination the right look at higher time frames.
Within the new downwards wave of primary wave C or Y, a first and second wave, or A and B wave, is now complete. Intermediate wave (2) or minor wave B lasted a Fibonacci 13 days exactly. The target for intermediate wave (3) is changed today. At 1,768 minor wave 5 would reach 1.618 the length of minor wave 1. At 1,769 minute wave v would reach equality in length with minute wave iii. This target would see minor wave 5 move below the end of minor wave 1, so it would avoid a truncation.
This daily chart and the hourly chart below both label minor wave 3 as complete. It is also possible that the degree of labelling within minor wave 3 could be moved down one degree, because only minute wave i within it may be complete. Within minor wave 5, no second wave correction may move beyond its start above 1,947.2.
Price has now broken below the lower cyan line. It looks like a downwards breakout is underway; the next wave down is unfolding. The lower cyan line may now provide resistance for upwards corrections.
HOURLY CHART
Click chart to enlarge.
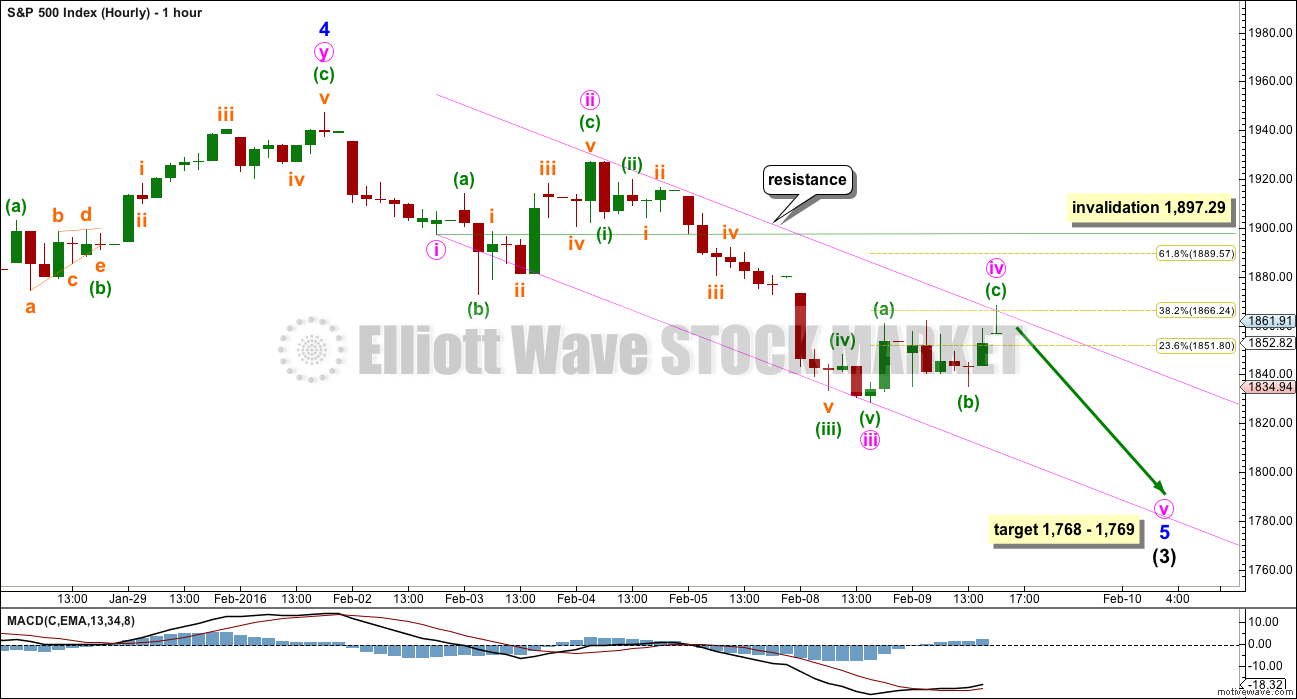
There are two ways to see the downwards movement from the high of minor wave 4. This may be an almost complete impulse as labelled here. It may also be two first and second waves as per the labelling on the hourly bear wave count today.
Both ideas work for this movement for both bull and bear wave counts.
If an impulse is unfolding, then the fourth wave correction is very likely to be over at Tuesday’s high. Any continuation of the fourth wave may not move into first wave price territory above 1,897.29.
There is no Fibonacci ratio between minute waves i and iii. This makes it more likely that minute wave v would exhibit a Fibonacci ratio to either of minute waves i or iii. The most common is equality in length with the first wave, but in this case that would see minor wave 5 truncated. At 1,769 minute wave v would reach equality in length with minute wave iii. This target is just one point off the target at minor degree: at 1,768 minor wave 5 would reach 1.618 the length of minor wave 1. Because calculations for two wave degrees converge on a one point price range this target has a reasonable probability.
Minute wave v may end about the lower edge of the channel.
BEAR ELLIOTT WAVE COUNT
DAILY CHART
Click chart to enlarge.
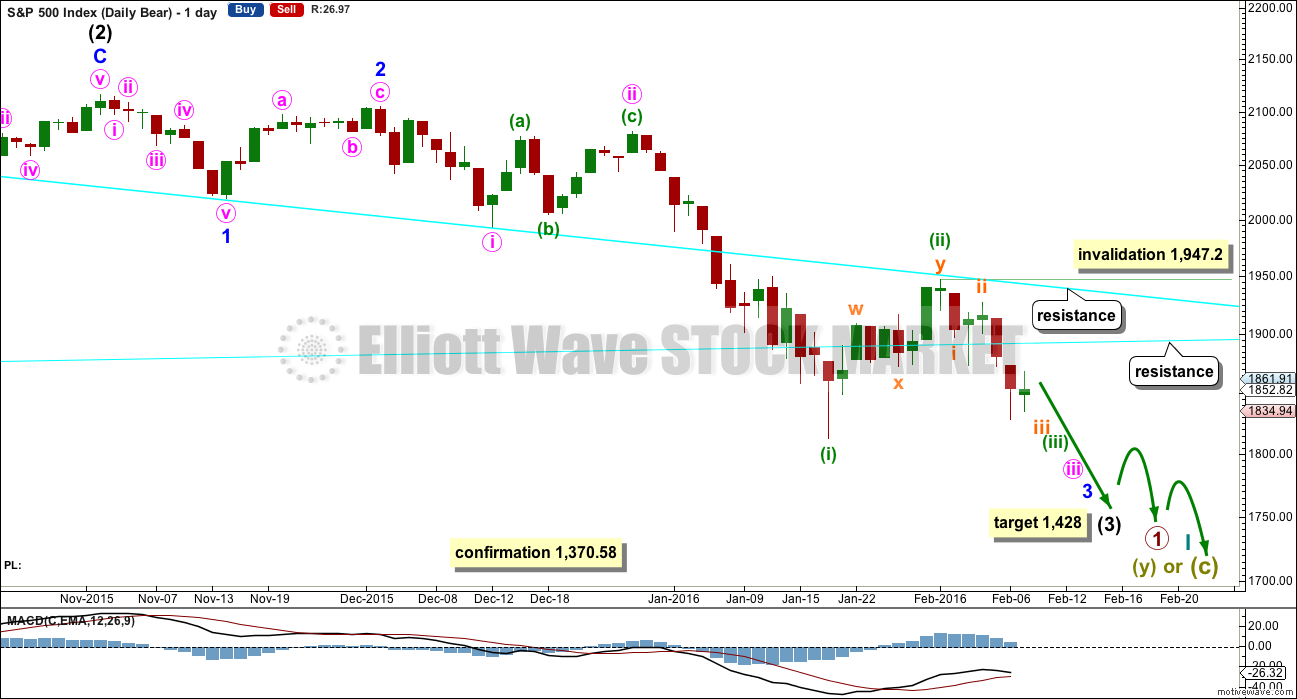
This bear wave count fits better than the bull with the even larger picture, super cycle analysis found here. It is also well supported by regular technical analysis at the monthly chart level.
Importantly, there is no lower invalidation point for this wave count. That means there is no lower limit to this bear market.
Downwards movement so far within January still looks like a third wave. This third wave for intermediate wave (3) still has a long way to go. It has to move far enough below the price territory of intermediate wave (1), which has its extreme at 1,867.01, to allow room for a following fourth wave correction to unfold which must remain below intermediate wave (1) price territory.
Intermediate wave (2) was a very deep 0.93 zigzag. Because intermediate wave (2) was so deep the best Fibonacci ratio to apply for the target of intermediate wave (3) is 2.618 which gives a target at 1,428. If intermediate wave (3) ends below this target, then the degree of labelling within this downwards movement may be moved up one degree; this may be primary wave 3 now unfolding and in its early stages.
Intermediate wave (2) lasted 25 sessions (no Fibonacci number), minor wave 2 lasted 11 sessions (no Fibonacci number), minute wave ii lasted 10 sessions (no Fibonacci number), minuette wave (ii) lasted a Fibonacci 8 sessions, and subminuette wave ii lasted just two sessions. Each successive second wave correction of a lower degree has a shorter duration which gives the wave count the right look, so far.
If subminuette wave ii continues any higher, it may not move above the start of subminuette wave i at 1,947.20.
The degree of labelling within minute wave iii may also be moved up one degree. This correction may be minute wave iv. I will wait to see how momentum behaves for the next wave down to make a final decision on which degree of labelling is correct. For now I will leave the labelling as the most likely for a second wave due to the duration and the structure of a double zigzag.
If the next wave down shows a strong increase in momentum, then it would be the middle of a big third wave.
If the next wave down shows weaker momentum than minuette wave (i), then it would be a fifth wave to end minor wave 3.
HOURLY CHART
Click chart to enlarge.
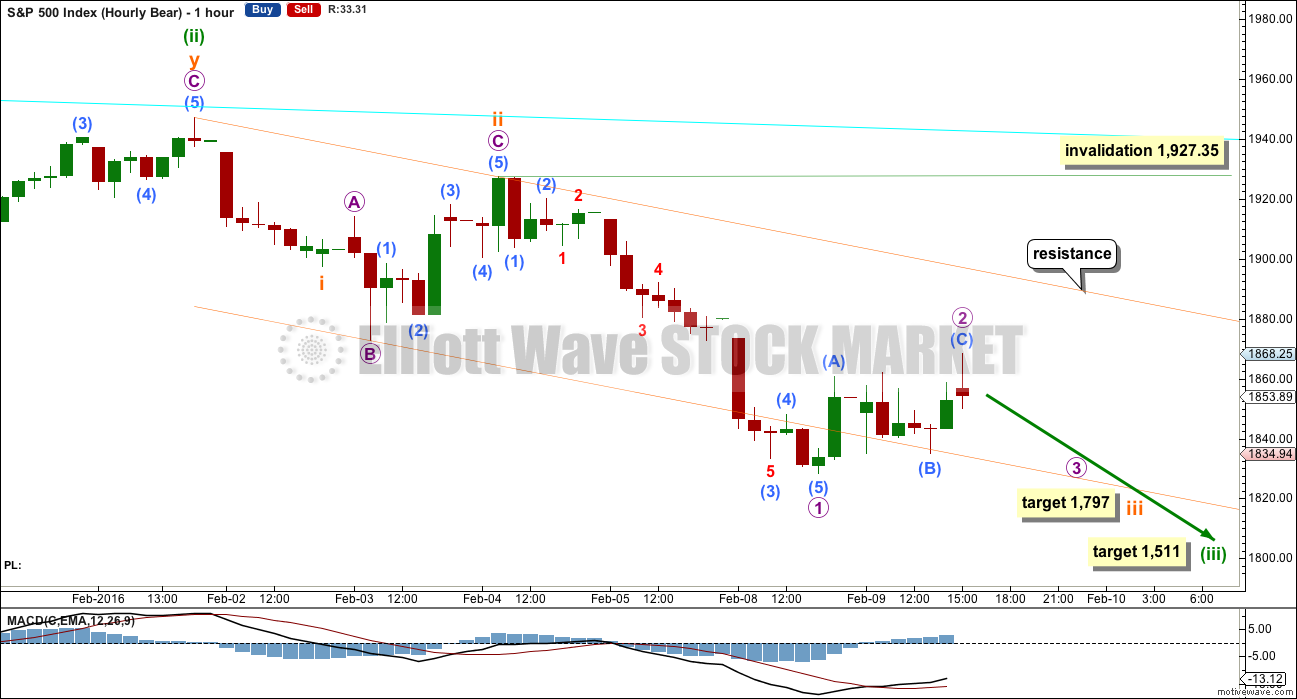
Subminuette waves i and ii may be complete within minuette wave (iii). Alternately, this downwards wave may be an incomplete subminuette wave i. The current correction may be micro wave 4, as per the labelling on the bull hourly chart. Both ideas work for both wave counts.
Subminuette wave ii was a deep 0.60 expanded flat lasting just 11 hours.
The pattern so far within this third wave is typical. Each successive second wave correction is more brief than its predecessor one degree higher.
If this downwards movement is two first and second waves, then micro wave 2 should be over now. It would have lasted 9 hours, two less than subminuette wave ii one degree higher.
Micro wave 2 may not move beyond the start of micro wave 1 above 1,927.35.
At 1,797 subminuette wave iii would reach 2.618 the length of subminuette wave i.
Subminuette wave i lasted one session and subminuette wave ii lasted two sessions. If subminuette wave iii is extended in price, it would also extend in time. A reasonable expectation would be for it to last a total Fibonacci 8 sessions. So far it has lasted 3.
At 1,511 minuette wave (iii) would reach 1.618 the length of minuette wave (i).
Minuette wave (i) lasted 14 sessions, one more than a Fibonacci 13. Minuette wave (ii) lasted a Fibonacci 8 sessions. If minuette wave (iii) is extended in price, it would also be extended in time. A reasonable expectation would be for it to last a total Fibonacci 21 sessions, give or take one or two either side of this number. So far it has lasted 6 sessions.
These expectations regarding time are rough estimates only. The S&P sometimes exhibits waves which have Fibonacci numbers for how many days / sessions they last, but not always.
TECHNICAL ANALYSIS
DAILY CHART
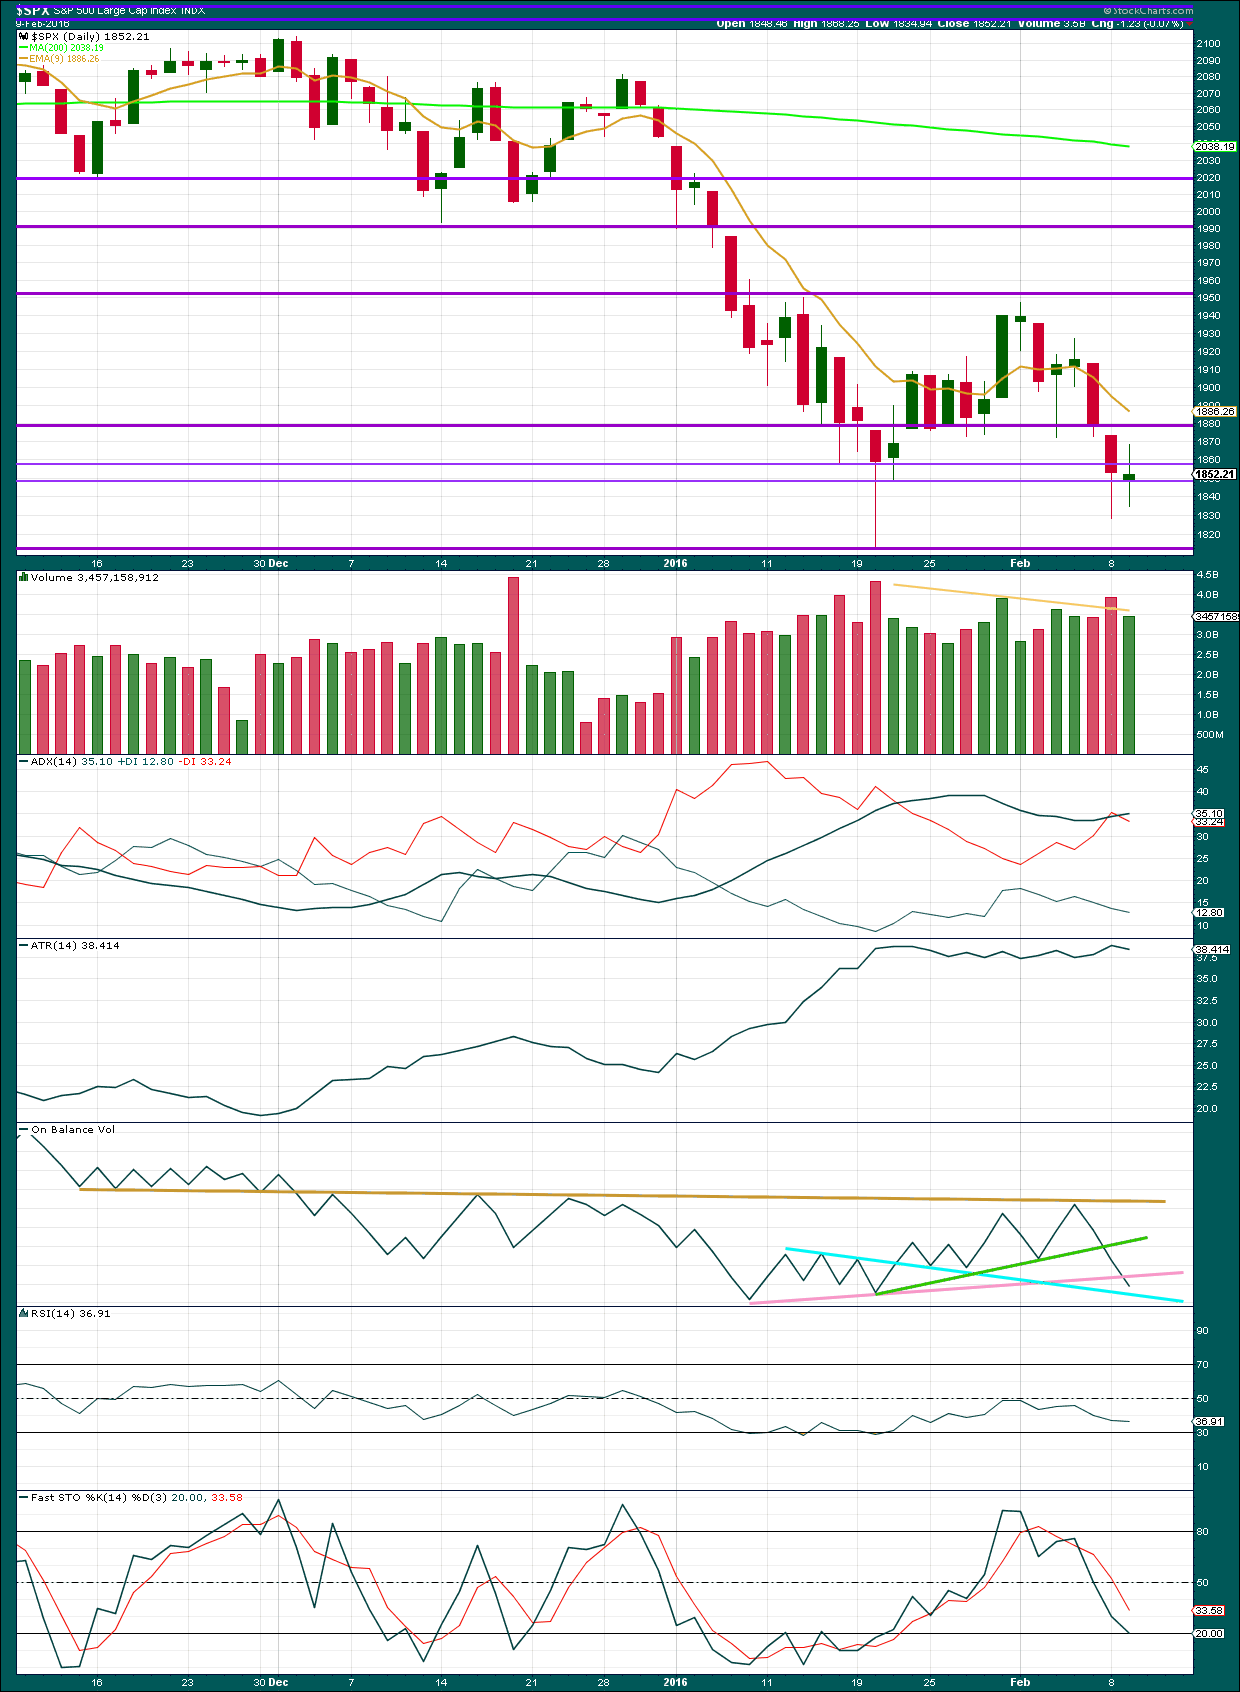
Click chart to enlarge. Chart courtesy of StockCharts.com.
This section of the analysis is updated at 12:25 a.m. EST 10th February, 2016.
Again, a small green candlestick with a small real body comes with a decline in volume. The volume profile remains overall bearish. The small rise in price today was not supported by volume; this movement looks strongly corrective.
ADX still is indicating there is a downwards trend.
ATR still disagrees as it is flat.
On Balance Volume has breached the short term pink line. The next line to provide support for OBV is very close and has stronger technical significance. If the blue line is breached by OBV, that would be a stronger bearish indicator.
RSI and Stochastics are not yet extreme. There is room yet for price to fall. Both RSI and Stochastics point lower for the session, although Tuesday completed a green candlestick, and this is weak indication that the bears were stronger than the bulls on Tuesday.
DOW THEORY
For the bear wave count I am waiting for Dow Theory to confirm a market crash. I am choosing to use the S&P500, Dow Industrials, Dow Transportation, Nasdaq and I’ll add the Russell 2000 index. Major swing lows are noted below. So far the Industrials, Transportation and Russell 2000 have made new major swing lows. None of these indices have made new highs.
I am aware that this approach is extremely conservative. Original Dow Theory has already confirmed a major trend change as both the industrials and transportation indexes have made new major lows.
At this stage, if the S&P500 and Nasdaq also make new major swing lows, then my modified Dow Theory would confirm a major new bear market. At that stage, my only wave count would be the bear wave count.
The lows below are from October 2014. These lows were the last secondary correction within the primary trend which was the bull market from 2009.
These lows must be breached by a daily close below each point. So far the S&P has made a new low below 1,821.61, but it has not closed below 1,821.61.
S&P500: 1,821.61
Nasdaq: 4,117.84
DJT: 7,700.49 – this price point was breached.
DJIA: 15,855.12 – this price point was breached.
Russell 2000: 1,343.51 – this price point was breached.
This analysis is published @ 05:05 p.m. EST.
Futures sinking!!!
I think the markets started dropping because Carly dropped out of the race..
Continue direction with drawing 30 minutes …. imo
bo ne-lekh!
Today’s price action not really typical of conclusion of a third wave imo…even of small degree…
Can I get a shooting star on the daily close today?
Last time we got a bear shooting star of this magnitude was Sept. 21, 2015. S&P dropped 125 points over the subsequent 7-8 trading days. Lets hope history repeats itself. I looked back at Lara’s analysis of that wave, and the shooting star was the peak of a 4th wave (both on bull and bear chart), with a strong 5th wave down which ended up being the infamous truncated 5th wave!
I’ve come to dislike the word “truncated” very much… Lets hope there’s no truncation on this current wave down…
The banksters were “all in” today as well as in overnight futures. The fact that they could not get even a skinny green candlestick suggests sentiment is uber bearish. UVXY green close pretty much confirms it.
Great observation Ari. The shape of tomorrow’s candle will also give a good clue about what kind of wave we are in. That day last September 17 UVXY printed a dragonfly doji and closed at 42.25, then gapped open the next day at over 50 before running up to 64 by the end of the truncated fifth. UVXY had strangely already put in a capitulation spike in the middle of that fourth wave back on September 1. Today’s shooting star clearly comes prior to any kind of capitulation spike in UVXY so how it behaves over the next few days should be very revealing indeed. While another truncation would be strange in the extreme, I don’t know that we can entirely rule it out. Anything other than a strong punch through the upper B band by UVXY tomorrow may be a signal it’s time to take at least short term profits. Last time we got a green (skinny) candle the second trading day (a Monday)after the shooting star…
Look for bears to demolish the pivot point of no-return via overnight futures.
Take a deep breath everybody. Have a glass of Port or Riesling!
Great to be with ya in the trenches.
Have a great evening everyone and, yep, see ya tomorrow!! 😀 😀 😀
Throw back chart – Hopefully!
Turn on the Niagara River…
Good one. This video on the waterfall is great!
https://www.youtube.com/watch?v=wB6gHz8XHDI
Sorry about the duplicate post. Not quite sure how or why that happened.
Its pulling down man!
Look at that nice hammer on the VIX!
Its a beauoootiful thing ain’t it? 🙂
Yeah, come on 1511 or 1428! I am getting more grey hairs here waiting 🙂
One of the hardest thing for traders is to SOH. Sometimes that is really the smartest thing to do (unless you are an occasional gunslinger like me! 🙂 )That by the way means “Sit On Hands”…
I agree. But if you sit on hands too long, you might s_it on your hands at the end! and that would stink really bad 😉
I am mostly grey already… but of the remaining black, I lost 10 more to grey.
Grey shows wisdom , sophistication, and experience. and admittedly, I have very little grey
Tussle for DJI 16,000.00 fully joined. It really is all about psychology. Even if the bulls hold, it looks like the bears intend to sell it hard. If they don’t (the bulls), we are going down big into the close…
Tussle for DJI 16,000.00 fully joined. It really is all about psychology. Even if the bulls hold, it looks like the bears intend to sell it hard. If they don’t, we are going down big into the close…
Well this is tiring isn’t it.
This correction has moved higher (obviously) and now looks like a double zigzag. It’s relatively deep at 0.53 of the prior wave down. It’s now lasted 12 hours by my counting… just one more than I had expected so not perfect proportions but still very good.
It could still be either a second wave or a fourth wave .
And it looks like price is now finding resistance at the lower cyan line on the daily chart. For any new members, draw that line from the October 2014 low to the August 2015 low. Do this on a semi log scale for the daily chart. Price is so close… this looks like a typical throwback.
This is my absolute favourite set up for an entry to join a trend. When price breaks support or resistance, and then throws back to that line, it offers a good price for entry and a low risk. I’ll set my stop just above the line.
So yes. This is tiring these corrections. But this move up is so choppy and overlapping, it looks typically corrective, and I bet todays green candlestick completes on low volume. If thats the case then the upwards move isn’t supported by volume, it wasn’t yesterday.
It all looks so textbook perfect… I’m viewing this as an opportunity. I’m looking for another entry now.
So I’m set. I decided to put my stop just above the invalidation point on the hourly chart (bear) just above 1,927.35. I don’t want to get greedy, and I am learning the hard way to give this market room to move. So the risk is greater, and I’ve reduced my position size to only risk just less than 5% equity.
So my money is where my mouth is. Next week I expect profits should be very likely. And if I’m wrong I’ll have paid Mr Market a lesson fee.
I lost my nerve and folded like a lawn chair. I should have given it one more day. Oh well….
I sure am bearish and It sure is exhausting to watch day to day. Is this a caution sign for more down side or does 8 days dropping -6% and trying to take out the lows and unable to get to it – all part of the 3rd wave decline process?
I went back to 2008 but was trying to find a pattern that matches in Aug and Oct. Which exact date would be a possible match to what we are seeing now?
Have you seen a consolidation break down go back into another consolidation and then bounce higher and then come back down. How would that look if we declined in say April or May 2016? Would that have the wrong fit and look?
Third waves are extended in price and time most often for the S&P.
And so their lower degree corrections show up on higher time frames.
This is absolutely typical in my nine years of daily analysis of this market down to the hourly chart level.
They can feel like they move too slowly at the beginning, then the middle is fast, and they can end strongly.
Price is very close to the August 2015 low. And so intermediate wave (3) (bear wave count) is still in the early stage.
Thanks for the detailed explanation. I agree with your strategy early about getting into a position and then wait a couple days to watch it play out. As trying to draw a conclusion on 1 day of price action can back fire against you!
Spoke to soon 🙂
Nice candle. Lets see how it closes….
Break from bearish wedge to the downside underway. Interesting that DJI which has been the strongest index now leading downside movement.
Selling UVXY calls, again, for quick 15% pop…
Looking for surrender of DJI pivot of 16,000.00 by the close. If not, the wrangling unfortunately could continue…
because of DIS!
Look for lots of futures contracts to be unwound the next day or two. Overnight prints ought to be really interesting…somebody is going to have to do a heck of lot of hedging…
This is really too funny. I took quick profits on UVXY calls today and guess what? The silly banksters let me buy ’em again at bargain basement prices. Go figure… 🙂
Is anyone worried about the bullish price channel that has been forming (green channel on chart)??
Hi David – Thanks for posting your chart.
Do you mean from an EW point of view or some other TA?
Imho, unless we broke out of the top of your green channel with some conviction it is only bullish short term (i.e. corrective against the trend at one higher degree).
From an EW point of view (which is really all I know – my regular TA is sketchy at best) I would say it is quite bearish on a longer term timeframe (one degree higher) as it is very overlapping – albeit the small degree sub-divisions of the upwards waves have still managed to stay slightly above points that would conclusively confirm they were corrective (as per my previous posts) so it is always worth being a little cautious imo. That is the only reason I have not thrown everything short at it but the kitchen sink (as currently (in theory) we could have a boat load of 1,2s upwards – but they are starting to look silly from an EW point of view imo so quite low probability (but not impossible!!))
A move below 1849.89 (approx) followed by falling out the lower channel, then crossing under 1834.85 would provide me greater confidence as each of those events took place.
Thanks Olga for the explanation… It does help to put things together and see things in this crazy market. I’m hopeful the upwards movement ended today though. the market turned down firmly from 1881, and now we have a shooting star on the daily chart. Lets hope today was the end of the upside correction…
Yep. Bearish rising wedge…
One very important thing I try to keep my eye on is the bigger picture – this move up from 1820’s is very messy / overlapping. Does not look impulsive at all.
They can grind it higher but my bets are on it falling right back down again irrespective short term gyrations
Just got another small pop higher to make 5 waves up from 1857.89 for c:2 idea. New high now above 1881.61 would invalidate that idea – below 1857.84 confirms it.
My 2 new (very very short term) lines in the sand 🙂
If any other members are mad enough to count small degree waves, would love to hear what your seeing.
Chart – Apologies for too much text / lack of charts – I don’t usually label at such low degree . (I’m absolutely sure posting this chart will jinx it!!)
Looks correct to me.
Thanks for the chart!
Exactly, keep an eye on the bigger picture.
I am very confident the trend is down because all my technical analysis tells me the trend is down.
And this move up today is messy. It couldn’t look more like a typical correction if it tried.
But then…. I could be wrong. And so I’m following my rules and managing risk. THE most important aspect of trading.
and the high today came in at less than 11 hrs, very impressive Lara.
if that high holds
exactly,, I may have jinxed it
fib retrace. 1890ish at the mid band possibly?
I’ve noticed you follow bollinger bands closely. i would watch a few of ira epstein’t videos on youtube. he does a very good job explaining the bands and how you can use them. his belief is that when the price goes below the band, and comes back out, it can potentially make a run at the 20 day average (he uses 18 day, but very similar)… just FYI
Just something interesting nothing specific. This is one tricky market!
At this point I am open to whatever way it swings in 2 weeks!
I am also not a day trader. I am a swing and position trader. So day to day doesnt impact me honestly!
I count 12 hours. Which isn’t so impressive.
But still pretty good IMO. I’m a happy camper.
FED just warned folks that they are not going to shy away from giving back the rate hike. Next economic release might just give them the excuse. I was looking at the market action and last years drop during Aug.-Sept. looks similar to what we saw Dec-Jan timeframe. GOLD is making a round top.
As I had mentioned yesterday that NASDAQ reported a volume of 91 million shares on QQQ for Monday before recovering some losses. I think in the tech sector there is a good possibility that washout occurred for last bunch of weak holders. Waiting and watching now.
Uh… I don’t know what you are listening to???
She is holding firm on the current rate hike schedule. No change in policy… Fed will NOT cut rates.
The legality of negative interest rates are in question. Fed does NOT have the authority… Congress will NOT allow negative interest rates or they will be thrown out of office! The Citizens of the USA will revolt if negative interest rates do in fact occur.
IMO Fed Funds Rate will continue to rise!
Markets can throw all the tantrums they want… just like babies or little children but that will not change the direction of the Fed Funds Rate!
Congressman Ed Perlmutter (D) quoting stats on how great the Obama economy is currently… thanking the Fed and Obama for this great accomplishment.
Yellen shaking her head up and down agreeing with this congressman as he says how great the Obama economy is and quoting the stats.
More Confirmation that the Fed Funds Rate will continue to go higher as scheduled!
2 points I have my eye on at the moment – above 1870.08 we prob have more upside – below 1849.89 this move up from 1834 proven corrective (double zigzag) this move probably over (unless we are going sideways). 1849.89 is second clue – first clue (falling out of channel) already fired)
We’re not quite out of the woods yet
Poss just doing a ‘kiss and run’ of the upward channel right now.
1870.08 is key
Unless…. that last small pop downwards from 1870.08 was a b wave – in which case we could be going up short term in a wave c which could go above 1870.08 and still be corrective – this small degree EW stuff is frustrating to say the least!!
Agreed…
Looking at 1 min chart – Could be a 1-2, 1-2 down off today’s high.
A move above 1870 ends that idea, and a move below 1857 will validate…
Let see what happens… 🙂
Yeah – but move down to 1862.14 could be all of 1, 1870 a:2, 1857 b:2 and now 5 waves up in c:2. So invalidation would be today’s highs not 1870.
That’s the problem – if we go above 1870 it might still be wave 2. All the sub divisions fit either way (and the wave from 1870 to 1857 looks suspiciously like a three)
Needless to say I’m hoping we don’t go above 1870 otherwise it is unclear (until we go above todays high)
We could have just had a truncated c:2!! Exhausting … 🙂
I added to my short but just cashed out of it (newly bought portion not core position) for very small profit. Will buy back again when we go below 1849.89 or if I see better setup before then.
Not happy that we keep stabbing back at the lower trendchannel of the move up. Might be just a bit of back testing but gonna wait for some more clarity. Got large short position already.
Move right now below 1862 would be telling
Olga,
Just wanted to say a quick thank you for your posts and your contribution to this message board.
Really insightful analysis and calculated trading approach.
And I’m sure i’m not the only one here who appreciates you sharing 🙂
You’re very welcome – thanks for your kind comments
This morning’s UVXY calls nicely in the money. An engulfing candle today signals heavy weight accumulation and means any remaining bulls are toast…butter ’em! 🙂
If UVXY closes above 54.46 today you will have your upside 10X trigger. They don’t fire very often. You know what to do…. 🙂
when you say 10x….what are you saying exactly? Thanks
Ten times your money return if you trade options. 🙂
S&P just hit 1880. Will it stop?
It is all about the close – imo!
The trend is down!
It is kind of sad how these banksters manipulate traders. I know they again rattled a lot of bearish positions this morning and shook people out of their trades. The fact is they are (thankfully!) quite predictable and smart traders hand them their heads every time they pull stunts like this. When I saw the co-ordinated futures pump last night I knew exactly what they were up to and I was ready for ’em. Don’t let them rob you folk…they are walking dead men…treat them accordingly… 🙂
For once I was smart and added shorts around 187.50 ish
I have stayed fully positioned short throughout all this noise.
What else my man? We are traders aren’t we, not bankster buffet… 😀
LOL
Bankster buffet…. awesome!
Way to go…! They probably hate you!! 😀 😀 😀
The banksters would like you to think it won’t. We know better…UVXY quickly heading back above 50.. 🙂
Looks like support for UVXY around the 48 area. Picking up a few additional calls at today’s lows. Saving rest of dry powder for DJI break of 15760.00 Will probably see another thrust up to dislodge remaining weak bears and fill a few open gaps.
Not much pop on upside hedges. Holding on to ’em.
I give two thumbs up for Rodney for getting out at the right time 🙂
And I guess this is the chance to start nibbling again at a shorting opportunity. The best times to add to positions or re-start is big up days like today…
Typical co-ordinated bankster pump. Nothing but another bull trap in the making. Probably not even worth cashing in hedges so don’t fall for it. DJI 16,000.00 pivot remains important and break of 15760 will probably signal the end of the tug-of war.
They don’t make it easy for us traders do they lol, Ive personally added and walked away doing some house stuff instead of watching, well till Yellen anyway
Sometimes the best thing you can do. Staring at thats screen drives you crazy!!
Europe bullish start after a swing, crude turning though so I expect it will be short lived. Yellen later and inventories also to consider
Up it goes again, yes an opportunity but also painful
Roll on the 3rd Wave
these swings present nice opps, if your a swing trader these fast pullbacks are a thing of beauty
Regular TA is now updated.
Overall reasonably strong support of the EW count and the downwards trend.
The only odd thing is ATR. So far.
Hi Lara,
once the target for subminuette 3 at 1,797 has been reached how far back do you think subminuette 4 could retrace to?
It has to remain below subminuette i.
It would most likely be shallow, and most likely end within the fourth wave of one lesser degree…. but I don’t know where that is yet and so I cannot say what price range it may end up in.
Nikkei down 2500 since NIRP,, its our turn
ouch,, Nikkei futures were up alot, now giving it all up, going below Jan. lows. Seems the neg. interest is blowing up in their face.
Excellent as usual. Thanks. Catch the waves!
Thank you Rodney. There were waves early this morning but I couldn’t surf them, I had to go into Auckland today. That’s why the analysis was so early.
Hopefully in the next few days I can surf again… it’s been over a week and I’m antsy…
Loving riding the FTSE wave though. I caught it right at the perfect time… like catching a wave just as it begins to break…
I posted this late in the day on 2/8 blog. But I want to make sure vernecarty and olga get it. I know they will here. There are so much wisdom in this group. And kindness / caring is indicated.
To give a bit of background, I said / wrote Lara is a nice person. Below is my earlier post. Read it knowing I like to add humor life especially tense times.
——————————————————————————————————–
Thank you all so much for your comments. They are always helpful.
With regard to my comment on Lara’s being too nice, I said it in more than half jest. People tell me I am a humorous sort of guy and I do like humor in life. I love to laugh and help others do the same.
The other half is that Lara is not only an outstanding technician and Elliott wave analyst, she strikes me as a generally and genuinely nice person. Several times over the years I’ve had opportunity to communicate with her outside the blog (by the contact us button). Every time she strikes me as nice.
All that being said, I knew I was getting tired of this every day. And I also know that there will be opportunities to get in and get out again. I am going to sleep well and be content with this past six weeks work. Break time. That is another thing I like, breaks. I tend to take a lot of time in the mountains where I live. I cut off from all electronic media and devices. I live in the wilderness. I know I am nuts because those closest to me keep telling me. Like the time I spent 4 days in 14 below zero degrees Fahrenheit.
See you all tomorrow.
Brrrrr,, now thats cold. I am from Wash. St. mild temps here, beautiful summers
Beravo rodney , identify with you
Crikey. Yes. That’s -25 degrees celsius.. that’s just crazy cold!
Thank you for the kind words Rodney.
I think it is important to always treat others with kindness. And it’s corny, but I believe if you live like that then kindness will be returned and you’ll live a happier life.
Imagine what the internet would be like if everyone was kind all the time!
These constant corrections are exhausting, and makes it hard to hold a position. But I keep thinking, don’t complain (me, to myself) about it, and look at each correction as another opportunity to get in at a good price. And if I have a loss then I am paying for a lesson on where to put my stop… because there is one thing I am almost 100% sure of and that the trend is down.
Hi Lara: For your analysis of the bull wave count your comment: “This target would see minor wave 5 move below the end of minor wave 1, so it would avoid a truncation.”, I believe meant to say “move below the end of wave 3”
Thanks for posting early! Looking forward to tomorrow…. 🙂
Oh goodness, yes. Will fix. Thanks Vernecarty
first again, woot…
You are going to break some sort of record!
🙂 LOL
Now I could… jump in and be first.
But I won’t. As it makes me smile to see your joy in being first.