
A new low below the August low of 5,768.22 was required and expected.
Summary: The middle of the third wave cannot have passed yet for FTSE. The correction can only be another second wave bounce. The invalidation point is at 6,314.6.
To see monthly and weekly charts and the bigger picture see last analysis here.
New updates to this analysis are in bold.
WEEKLY WAVE COUNT
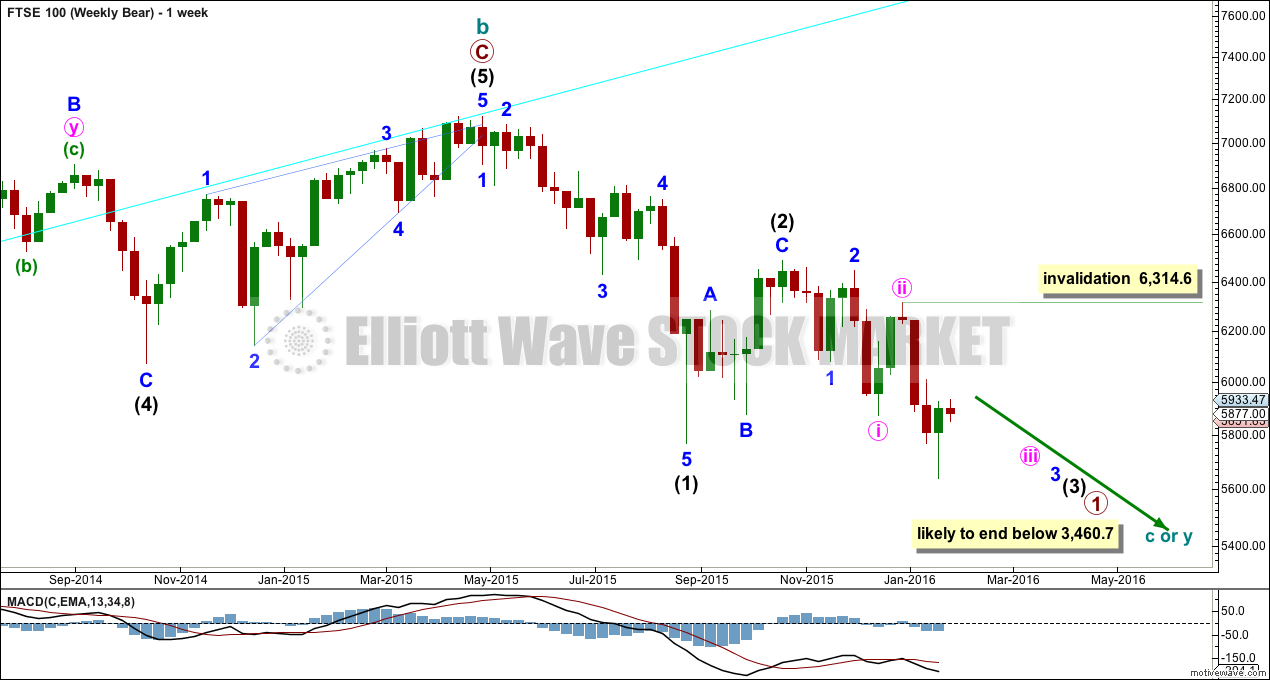
Click chart to enlarge.
From the all time high in April 2015, FTSE has a five down and a three up. This current fall should move well below the end of intermediate wave (1) at 5,768.22 and then remain below that point. Intermediate wave (3) must move beyond the end of intermediate wave (1), far enough below to allow room for a subsequent fourth wave which may not move back into intermediate wave (1) price territory.
Price has now made a new low below the August low at 5,768.22. Downwards movement should continue.
DAILY WAVE COUNT
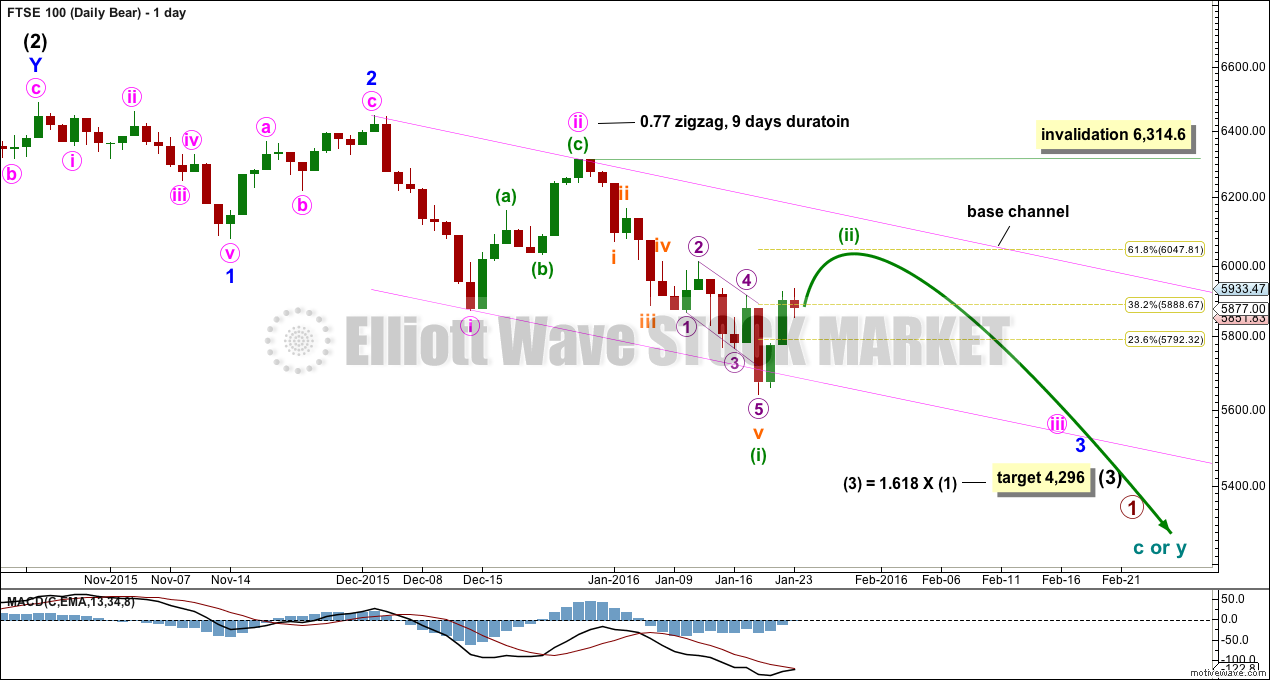
Click chart to enlarge.
So far the middle of the third wave cannot have passed for FTSE. Upwards movement of the last three days is back in minute wave i price territory. This cannot be minute wave iv, so it may only be yet another second wave correction if this wave count is correct.
Minuette wave (ii) may not move beyond the start of minuette wave (i) price territory above 6,314.6.
Intermediate wave (2) lasted 42 days. Minor wave 2 lasted 11 days. Minute wave ii lasted 9 days. Each subsequent second wave is shorter in duration than its predecessor giving the wave count the right look. None of these waves are exhibiting Fibonacci durations.
Minuette wave (ii) may be expected to be quicker than 9 days. So far it has lasted three. It should be choppy and overlapping and volume should decline as it continues. It may end about the 0.618 Fibonacci ratio of minuette wave (i) at 6,048. If it is deeper than that, then it should find resistance at the upper edge of the pink base channel.
The target for intermediate wave (3) remains the same at 4,296 where it would reach 1.618 the length of intermediate wave (1).
Of all the indices I follow with Elliott wave counts, FTSE remains the clearest bear.
TECHNICAL ANALYSIS
DAILY CHART
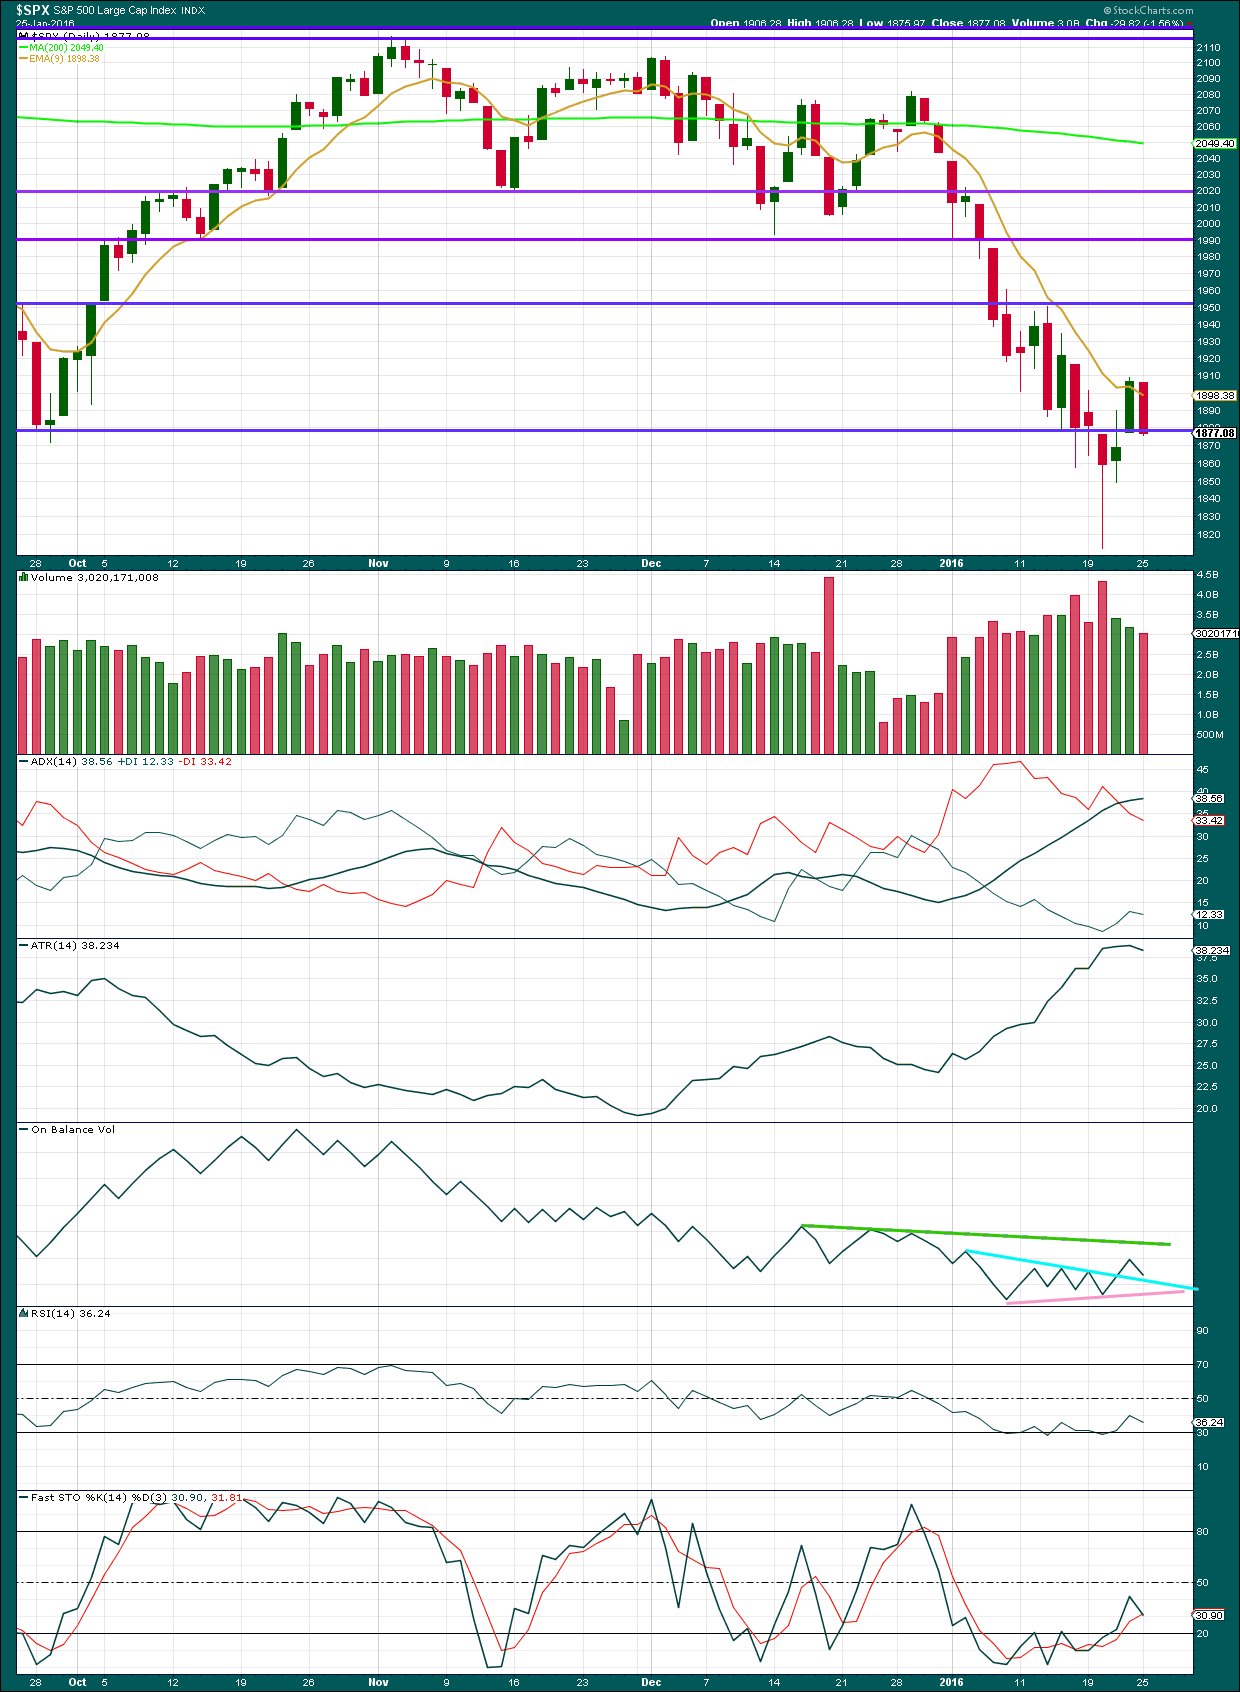
Click chart to enlarge. Chart courtesy of StockCharts.com.
There is no volume data on either the FXCM feed or StockCharts. Volume analysis is done from Yahoo Finance data.
As price falls, it comes with stronger volume consistently. The fall in price is well supported by volume; the strongest volume is seen on downwards days. The volume profile continues to be bearish.
ADX is still increasing indicating a downwards trend, but the rate of increase is declining. ATR is declining indicating the market has just entered a correction.
This correction is resolving RSI being slightly oversold. It is returning to neutral.
If FTSE is in a correction, then it may not find resistance at the 9 day EMA and may whipsaw about that line. Resistance may be found 1,950, the next horizontal trend line. The upwards swing should be expected to continue until price finds resistance and Stochastics reaches overbought at the same time.
This analysis is published @ 02:12 a.m. EST on 26th January, 2016.
What are your thoughts now FTSE has gone above 6048? Reverse down next week or does the count need to change?
Thanks
Probably. But a trend change isn’t confirmed until a channel about this upwards correction is breached by downwards movement.
Anybody have ideas on how to short the FTSE from the US stock markets? I know about the EPV (pro shares ultrashort FTSE), but their options have very low volume and thinly traded. any other ideas?
I’m trading it on the short side using CFD’s.
My broker is CMC Markets. They’re a NZ broker.