
Last analysis reminded members that the trend is still down.
A new low below the August lows was expected.
Summary: The trend is still down. When markets open on Tuesday a new low below 1,857.83 would be very bearish. If that happens, expect surprises to the downside. Surprises not just in price but in market behaviour overall. The possibility of a Dead Cat Bounce unfolding will remain while price remains above 1,857.83. There is some classic technical analysis to support this idea. A target for it to end would be 1,948 – 1,953. Look for price to find resistance at the upper cyan line on the daily charts (copied over to the first hourly chart). Any bounce from here should not move above 1,993.26.
To see how each of the bull and bear wave counts fit within a larger time frame see the Grand Supercycle Analysis.
To see detail of the bull market from 2009 to the all time high on weekly charts, click here.
Last published monthly charts can be seen here.
If I was asked to pick a winner (which I am reluctant to do) I would say the bear wave count has a higher probability. It is better supported by regular technical analysis at the monthly chart level, it fits the Grand Supercycle analysis better, and it has overall the “right look”.
New updates to this analysis are in bold.
BULL ELLIOTT WAVE COUNT
DAILY CHART – COMBINATION OR FLAT
Click chart to enlarge.
This wave count is bullish at Super Cycle degree.
Cycle wave IV may not move into cycle wave I price territory below 1,370.58. If this bull wave count is invalidated by downwards movement, then the bear wave count shall be fully confirmed.
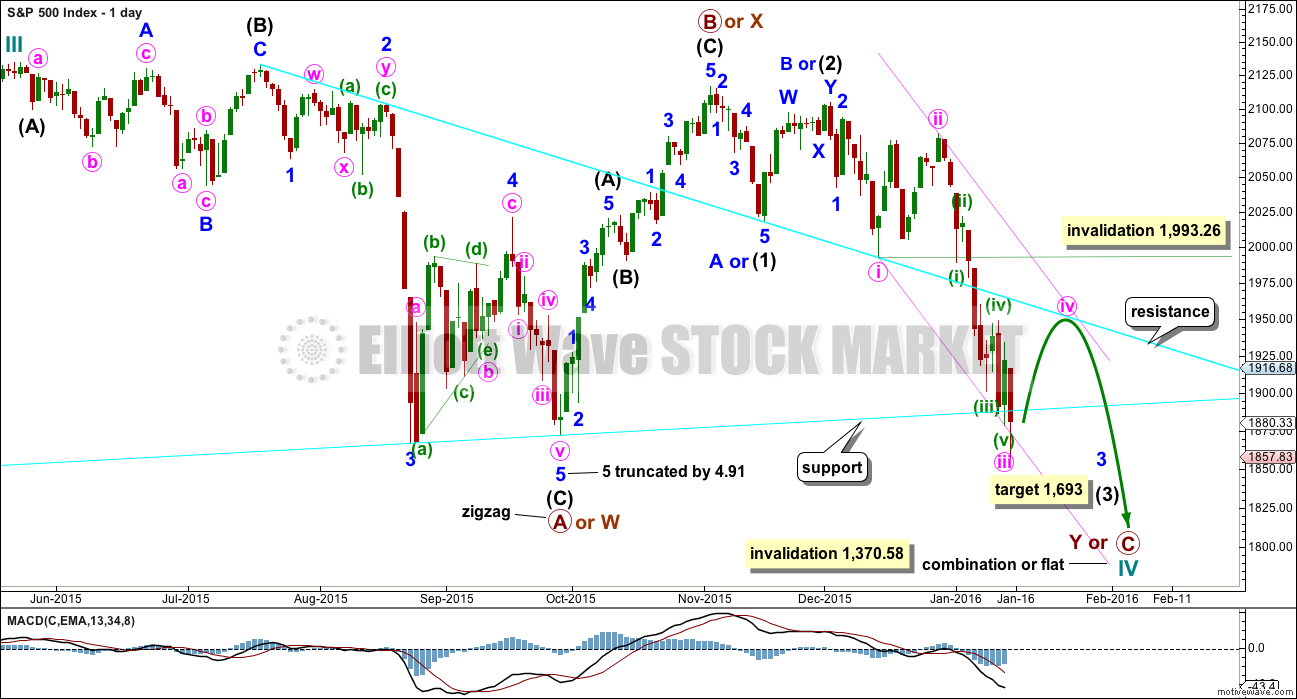
Cycle wave II was a shallow 0.41 zigzag lasting three months. Cycle wave IV should exhibit alternation in structure and maybe also alternation in depth. Cycle wave IV may be a flat, or combination. The triangle is now invalidated.
Cycle wave IV may end within the price range of the fourth wave of one lesser degree. Because of the good Fibonacci ratio for primary wave 3 and the perfect subdivisions within it, I am confident that primary wave 4 has its range from 1,730 to 1,647.
Primary wave C should subdivide as a five and primary wave Y should begin with a zigzag downwards. This downwards movement is either intermediate waves (1)-(2)-(3) of an impulse for primary wave C or minor waves A-B-C of a zigzag for intermediate wave (A). Both these ideas need to see a five down complete towards the target, so at this stage there is no divergence in expectations regarding targets or direction.
Primary wave A or W lasted three months. Primary wave C or Y may be expected to also last about three months.
Within the new downwards wave of primary wave C or Y, a first and second wave, or A and B wave, is now complete. Intermediate wave (2) or minor wave B lasted a Fibonacci 13 days exactly. At 1,693 intermediate wave (3) would reach 4.236 the length of intermediate wave (1).
The middle may have passed a few days ago within intermediate wave (3), but this has a lower probability than the scenario presented with the bear wave count. This idea is presented to consider all possibilities.
It is possible that minute wave iii is a complete five wave impulse. This has a low probability and should only be used if it is confirmed with a new high above 1,934.47. There would be no Fibonacci ratio between minute waves i and iii.
Minute wave iv may not move into minute wave i price territory above 1,993.26. It may end when price finds resistance at the upper cyan line.
Price is finding support about the lower cyan trend line which is drawn from the October 2014 lows to the August 2015 lows.
HOURLY CHART
Click chart to enlarge.
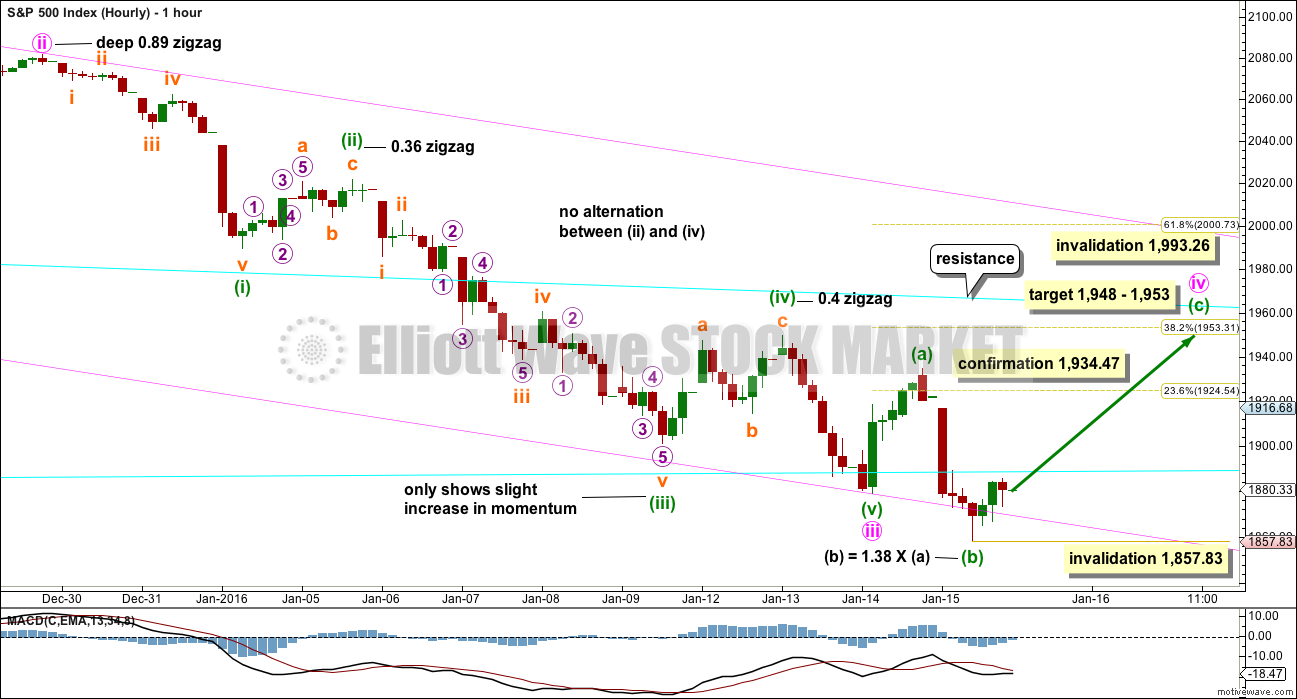
This hourly chart follows on directly from the labelling of the daily chart.
Minute wave iii may be over as an impulse. Minute wave iii does show an increase in momentum beyond that seen for minute wave i on the daily chart.
On the hourly chart, there are a few problems with this wave count which reduce its probability:
1. There is no alternation in either structure or depth between minuette waves (ii) and (iv), both are shallow zigzags.
2. Minuette wave (iii) shows only a slight increase in momentum on the hourly chart beyond that seen for minuette wave (i).
3. Minuette wave (iii) did not breach a base channel drawn about minuette waves (i) and (ii) (no longer shown for reasons of clarity in the chart).
4. There are no Fibonacci ratios between minuette waves (i), (iii) and (v).
5. There is no Fibonacci ratio between minute waves i and iii.
It is technically possible that this idea is correct. Alternation is a guideline, not a rule, and momentum is a guide and not a rule. This idea is presented to consider all possibilities, so that we are prepared for the unexpected. Now that minute wave iii can be seen as a complete five wave impulse, with momentum weaker for the fifth wave within it, the momentum profile from MACD does not look too far from typical. This is a slight point in favour of this wave count.
This idea requires a new high above 1,934.47 for confirmation.
Minute wave iv may be unfolding as an expanded flat correction, which are very common structures. I have checked the subdivisions of minuette wave (b) on the five and one minute chart and this movement is ambiguous. It may subdivide as either a three wave zigzag or a five wave impulse. This wave count sees it as a zigzag. The next hourly chart sees it as an impulse. Both possibilities must be considered.
Minuette wave (b) is a 1.38 length of minuette wave (a), at the maximum normal range of a B wave within a flat correction. At 1,948 minuette wave (c) would reach 1.618 the length of minuette wave (a). That price point is reasonably close to the 0.382 Fibonacci ratio of minute wave iii at 1,953 giving a 5 point target zone.
If minute wave iv is a shallow flat, then it would exhibit perfect alternation with the deep zigzag of minute wave ii.
Minute wave iv may also unfold as a triangle or combination. I am labelling it as a flat because that is the most likely structure, but a triangle or combination would also be shallow and also provide perfect alternation with minute wave ii.
If this wave count is correct, then as minute wave iv continues the labelling within it may change. It is impossible to tell which of several structural possibilities minute wave iv may complete as, so it is impossible to tell with accuracy the pathway that price may take for this correction. The only thing which is clear is that it would be incomplete.
Minute wave ii lasted 10 days. At this stage of a big third wave, I would expect minute iv to possibly be more brief. A Fibonacci five or eight days in total may be expected; so far it would have lasted one day.
The target also coincides nicely with the upper cyan line copied over from the daily chart. Price should find strong resistance there.
No second wave correction may move beyond its start below 1,857.83 within minuette wave (c).
BEAR ELLIOTT WAVE COUNT
DAILY CHART
Click chart to enlarge.
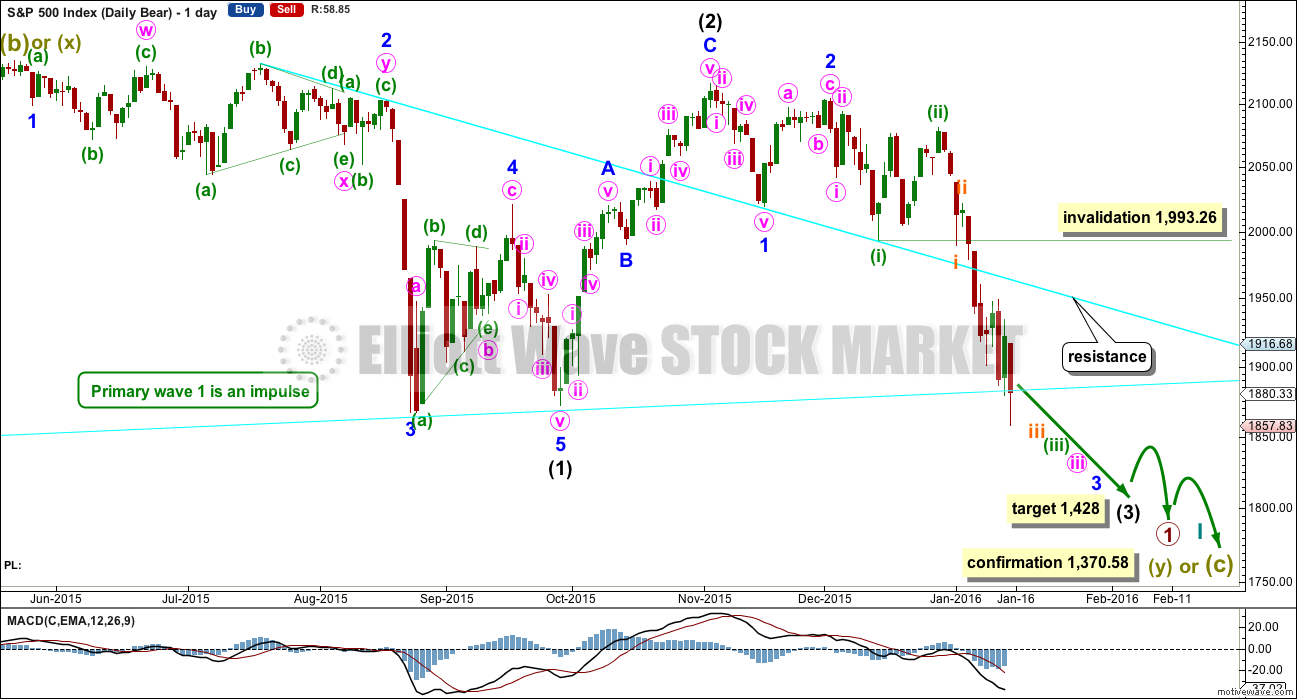
This bear wave count fits better than the bull with the even larger picture, super cycle analysis found here. It is also well supported by regular technical analysis at the monthly chart level.
Importantly, there is no lower invalidation point for this wave count. That means there is no lower limit to this bear market.
The downwards movement labelled intermediate wave (1) looks like a five. If minor wave 2 is seen as a double flat with a triangle for wave X within it, then the subdivisions all fit nicely.
Ratios within intermediate wave (1) are: minor wave 3 is 7.13 points short of 6.854 the length of minor wave 1, and minor wave 5 is just 2.82 points longer than 0.618 the length of minor wave 3. These excellent Fibonacci ratios add some support to this wave count.
Intermediate wave (2) was a very deep 0.93 zigzag. Because intermediate wave (2) was so deep the best Fibonacci ratio to apply for the target of intermediate wave (3) is 2.618 which gives a target at 1,428. If intermediate wave (3) ends below this target, then the degree of labelling within this downwards movement may be moved up one degree; this may be primary wave 3 now unfolding and in its early stages.
Because minuette wave (ii) was a deep correction of minuette wave (i), it would be expected that the correction of minuette wave (iv), when it arrives, should be shallow against minuette wave (iii). Minuette wave (iv) may not move into minuette wave (i) price territory above 1,993.26.
Intermediate wave (3) still has to show an increase in downwards momentum. Momentum for intermediate wave (3) is increasing, but it should be stronger than intermediate wave (1).
HOURLY CHART
Click chart to enlarge.
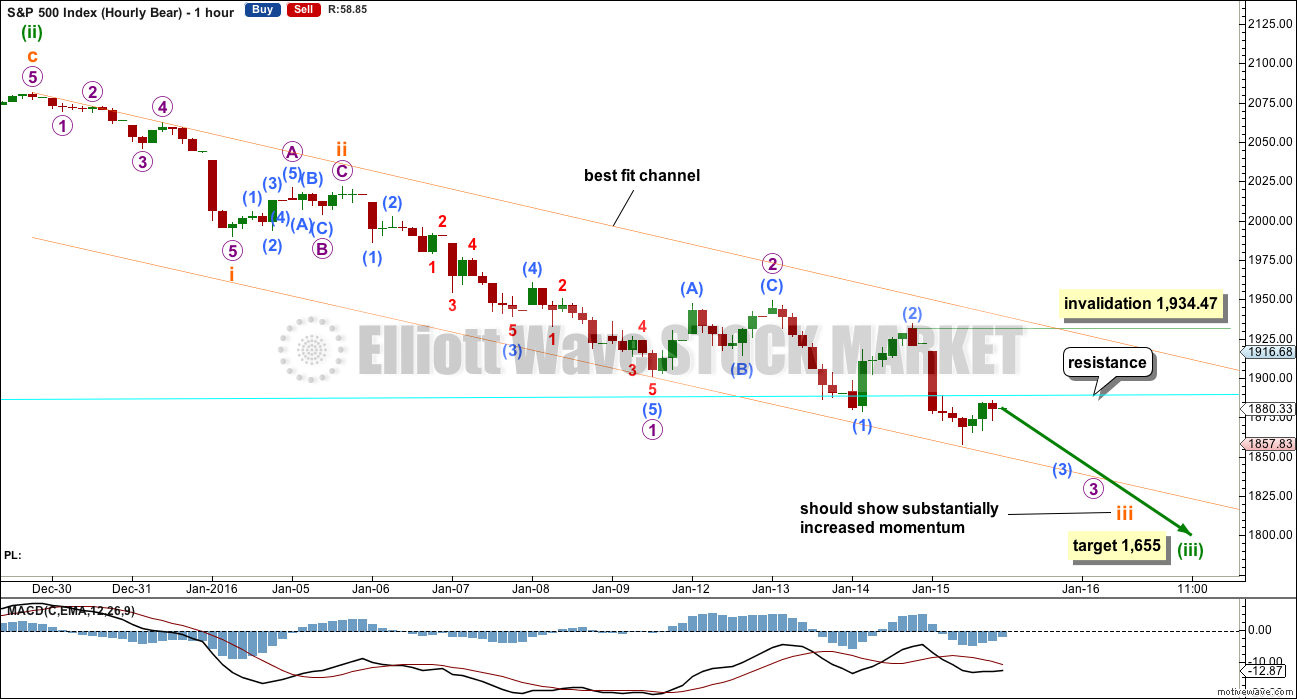
The subdivisions on the hourly chart for both wave counts are the same, but here the degree of labelling within the impulse of micro wave 1 is moved down one degree.
Instead of the end subminuette wave iii this may be only another first and second wave complete.
At 1,655 minuette wave (iii) would reach 4.236 the length of minuette wave (i).
This wave count still requires a further increase in downwards momentum.
The lower cyan line is copied over from the daily chart. This line may provide resistance now that price has breached it.
The best fit channel so far is working well. Downwards movement for Friday found support there. Upwards corrections may find resistance at the upper edge (if the cyan line is breached).
No second wave correction may move beyond the start of the first wave above 1,934.47 within the middle of the third wave.
Labelling shows an expectation of the best fit channel to be breached. This may happen, but it does not have to. In the first instance, look for price to find support at the lower line. If that line is breached, then look for corrections to then find resistance. This is a best fit channel, not a base channel, so it should not be expected to behave as a base channel behaves.
TECHNICAL ANALYSIS
DAILY CHART
Click chart to enlarge. Chart courtesy of StockCharts.com.
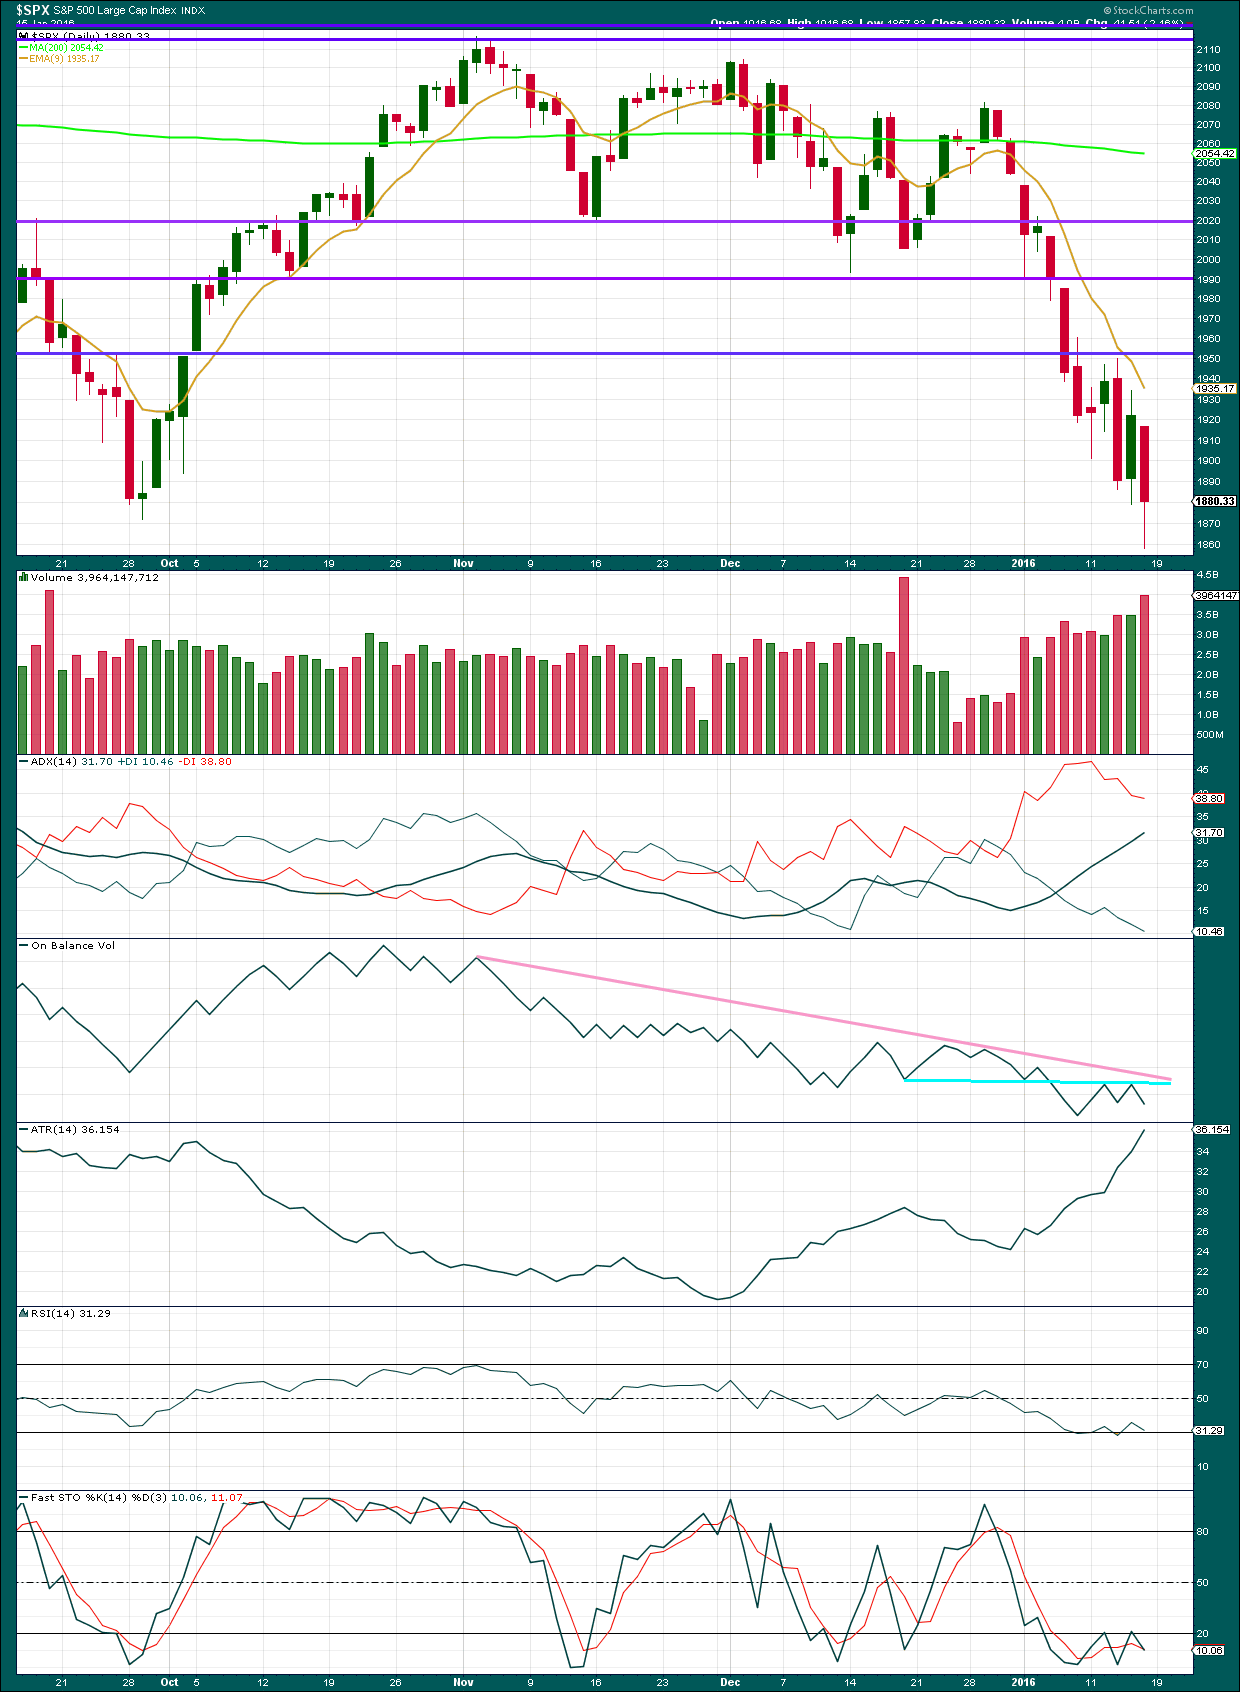
Again, price falls on rising volume. The fall in price is supported by volume and is not suspicious.
ADX still indicates the market is definitely trending; the trend is down. ATR continues to agree.
Price may find some resistance at the 9 day EMA.
On Balance Volume has again found resistance at the cyan line. If price turns up, then OBV may again lead the way. If it again turns up to reach the cyan line, that may hold the rise in price. This line is almost horizontal and tested three times and has some reasonable technical significance.
I can see three short term bullish signals in this chart and indicators below:
On Balance Volume has not made a new low at the end of the week while price did make a new low. This indicates weakness in price and is a short term bullish signal indicating some bounce may unfold about here.
The low for Friday from price does not correspond to a new low in RSI. This divergence between days close together is often a fairly reliable indicator of a trend change, at least short term. Often is not always.
Stochastic also shows small bullish divergence for the last few days movement.
VOLATILITY
Click chart to enlarge. Chart courtesy of StockCharts.com.
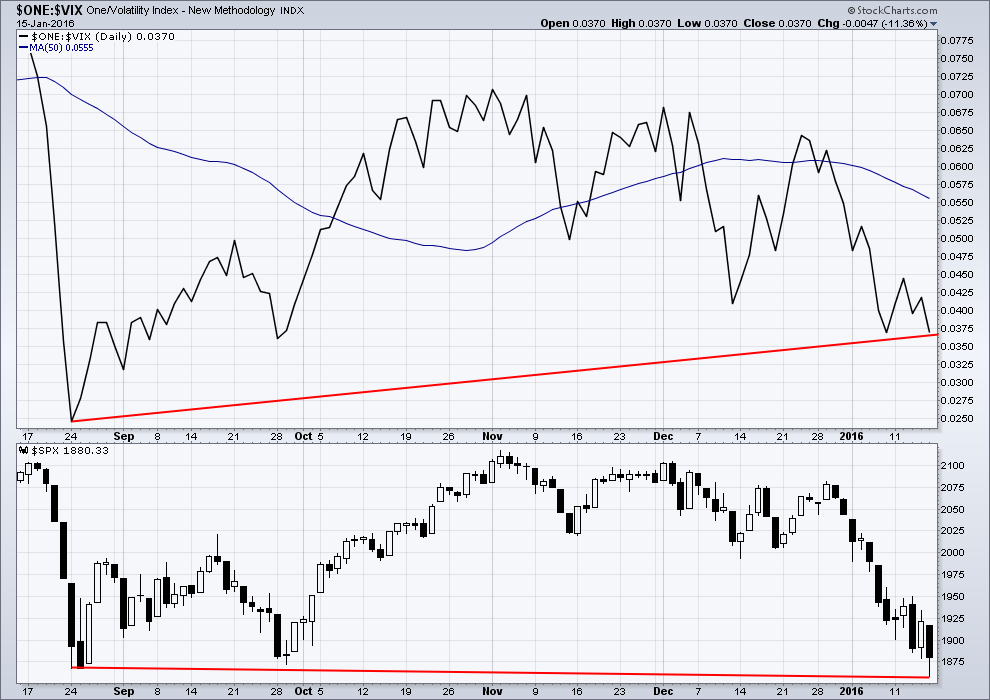
While price made a new low below August 2015 lows on Friday, it came on less volatility. VIX has not managed to make a corresponding low.
If this downwards move is the first part of a third wave, that may be why. Capitulation and recognition of a bear move would not come until the middle of a third wave. Only then would the majority recognise what is happening. If this is a big third wave at a high degree, then the middle is not yet passed, so the majority have not yet capitulated. This may explain lower volatility.
However, this divergence is bullish. I am just not too sure of how much weight it should be given.
ADVANCE DECLINE LINE
Click chart to enlarge. Chart courtesy of StockCharts.com.
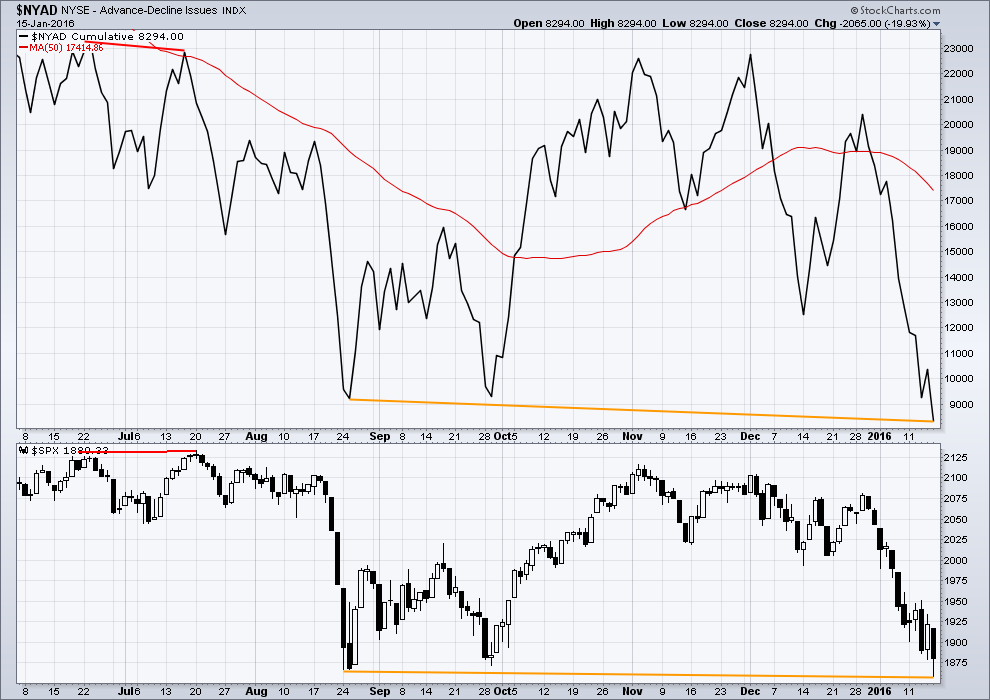
The new low for Friday below August 2015 lows comes with a declining AD line. The low in price is supported by more stocks declining than advancing. There is no bullish divergence (orange lines).
However, due to the large number of stocks in the index which are non operating company listings the AD line may not be a reliable indicator.
McCLELLAN OSCILLATOR
Click chart to enlarge. Chart courtesy of StockCharts.com.
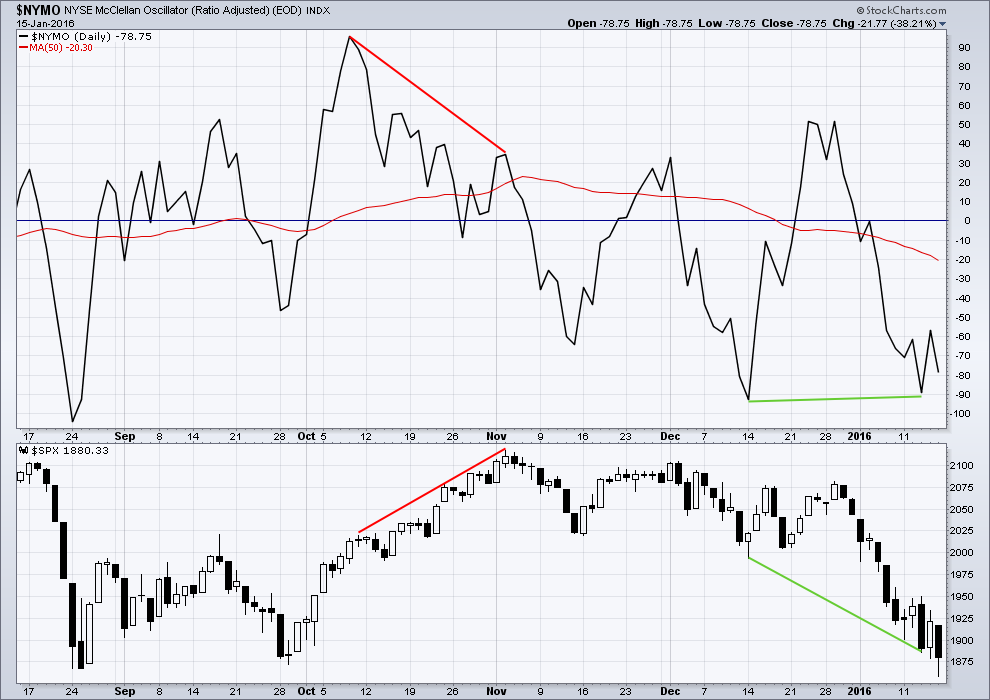
The negative divergence (red lines) during the last rise in price to the last major high of 3rd November, 2015, was strong and a good bearish signal for the following fall in price. As price rose to 3rd November, it came on declining breadth.
Currently, price has fallen to a new low below 14th December yet the McClellan Oscillator shows that the fall in price has less breadth than the prior fall in price. The fall in price is weaker. This is a bullish signal.
CONCLUSION:
I am not certain of how much weight the bullish divergence in VIX and the McClellan Oscillator should be given.
The divergence is there, and it is a bullish signal. It is a warning, but it may not be definitive.
There is some doubt as to the divergence in VIX and McClellan Oscillator because there is no bullish divergence between price and the AD line.
Plenty of times I have noticed divergence (most particularly with price and MACD) and expected it to indicate a trend change, and plenty of times the divergence has simply ceased with further price action in the same direction. I have learned the hard way to take divergence as a warning and to not expect it to be definitive.
The short term divergence with RSI and price however is often a reliable signal of a short term correction, which indicates that the idea of a bounce for a fourth wave early next week has a reasonable probability. Manage risk accordingly.
DOW THEORY
For the bear wave count I am waiting for Dow Theory to confirm a market crash. I am choosing to use the S&P500, Dow Industrials, Dow Transportation, Nasdaq and I’ll add the Russell 2000 index. Major swing lows are noted below. So far the Industrials, Transportation and Russell 2000 have made new major swing lows. None of these indices have made new highs.
At this stage, if the S&P500 and Nasdaq also make new major swing lows, then Dow Theory would confirm a major new bear market. At that stage, my only wave count would be the bear wave count.
The lows below are from October 2014. These lows were the last secondary correction within the primary trend which was the bull market from 2009.
S&P500: 1,821.61
Nasdaq: 4,117.84
DJT: 7,700.49 – this price point was breached.
DJIA: 15,855.12 – this price point was breached.
Russell 2000: 1,343.51 – this price point was breached.
This analysis is published @ 02:37 a.m. EST on 16 January, 2016.
anyone heard from Lara today?
She just made a comment on the video analysis thread. That comment section has more of the comments today.
Thank you Lara for providing such detailed analysis of the S&P 500! My learning curve is very steep thanks to you.
When I consider inter market analysis of the S&P 500 and Russell 2000, this wave count seems to have the right look. Your thoughts and feedback from you and the community would be appreciated.
Here is the S&P 500 wave count.
Here is the Russell 2000 count.
Sorry I didn’t mean steep learning curve. I have actually learned a lot from you. It has been very helpful.
Thomas
What SOFTWARE are you using?
Where is your data feed from BATS or NYSE?
I used Motivewave software with data from google/yahoo to generate these charts. The data is not very good.
Hi
All
Just an UPDATE on markets bottoming. They don’t happen on FRIDAYS!
So, it will be very very fun to see what happens SUN-MON ES NIGHT INTO CASH TUESDAY!
STAY TUNED!
Dear Lara,
Thanks for the excellent analysis and commentary. The warnings you highlight are clear as well as are your expectations of movement. You classic TA brings a high degree of value added to your blog.
One thought for your consideration. While we made a new low on Friday, we did not close at a new low. Some see this in itself as a bullish signal. However, it may be that several indicators and oscillators did not make a new low closing basis for that very reason. Perhaps, if and when we close below 1857, all those indicators and oscillators will also make new closing lows thus confirming the new low. Just a thought.
Next week will be interesting as have these last couple of weeks.
Thanks again to you and to all who contribute to this blog.
Rodney
Thanks Rodney.
The long lower shadow on Fridays candlestick is bullish, but the candlestick is red so overall it is bearish.
The bears made an important new low. The bulls managed to push price up from the lows of the day, but not even to halfway through the daily range.
Not really very bullish I think.
I suspect next week and the week after these markets will start making bigger headlines.
I have heard a few say this is a great buying opportunity. I find that sentiment… really interesting.