
Yesterday’s analysis warned that the S&P may bounce, which is what happened.
Summary: More upwards movement is most likely, which may last about two weeks and end above 2,027. This outlook would be confirmed with a new high above 1,947.38 and a breach of the upper edge of the base channel on the hourly chart tomorrow. Alternatively, a new low tomorrow below 1,901.1 would confirm the middle of a huge third wave is almost upon us. Today, this idea has slightly reduced in probability.
To see how each of the bull and bear wave counts fit within a larger time frame see the Grand Supercycle Analysis.
To see detail of the bull market from 2009 to the all time high on weekly charts, click here.
Last published monthly charts can be seen here.
If I was asked to pick a winner (which I am reluctant to do) I would say the bear wave count has a higher probability. It is better supported by regular technical analysis at the monthly chart level, it fits the Grand Supercycle analysis better, and it has overall the “right look”.
New updates to this analysis are in bold.
BULL ELLIOTT WAVE COUNT
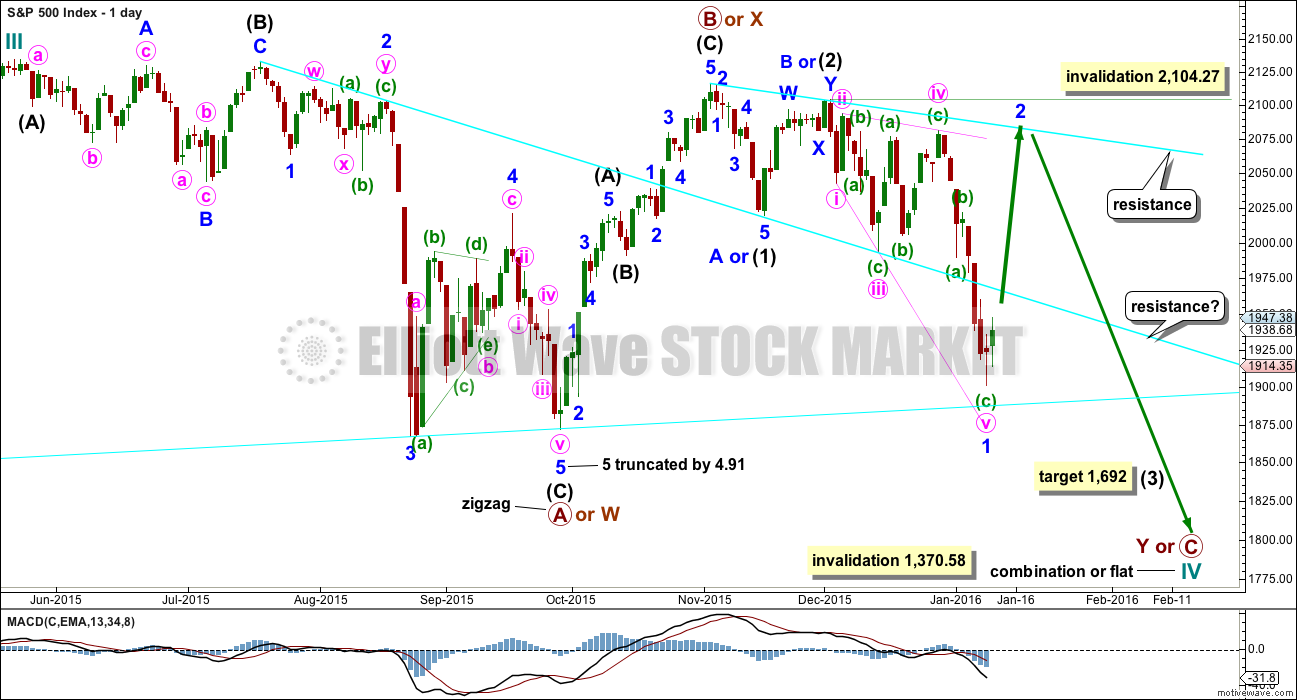
DAILY CHART – COMBINATION OR FLAT
Click chart to enlarge.
This wave count is bullish at Super Cycle degree.
Cycle wave IV may not move into cycle wave I price territory below 1,370.58. If this bull wave count is invalidated by downwards movement, then the bear wave count shall be fully confirmed.
Cycle wave II was a shallow 0.41 zigzag lasting three months. Cycle wave IV should exhibit alternation in structure and maybe also alternation in depth. Cycle wave IV may be a flat, combination or triangle. The two daily charts look at these three possibilities.
Cycle wave IV may end within the price range of the fourth wave of one lesser degree. Because of the good Fibonacci ratio for primary wave 3 and the perfect subdivisions within it, I am confident that primary wave 4 has its range from 1,730 to 1,647.
If a zigzag is complete at the last major low as labelled, then cycle wave IV may be unfolding as a flat, combination or triangle.
Primary wave C should subdivide as a five and primary wave Y should begin with a zigzag downwards. This downwards movement is either intermediate waves (1)-(2)-(3) of an impulse for primary wave C or minor waves A-B-C of a zigzag for intermediate wave (A). Both these ideas need to see a five down complete towards the target, so at this stage there is no divergence in expectations regarding targets or direction.
Primary wave A or W lasted three months. Primary wave C or Y may be expected to also last about three months.
Within the new downwards wave of primary wave C or Y, a first and second wave, or A and B wave, is now complete. Intermediate wave (2) or minor wave B lasted a Fibonacci 13 days exactly. The target of 1,850 for intermediate wave (3) no longer looks low enough, because it does not allow enough room for minor wave 4 to unfold and remain below minor wave 1 price territory. The target is recalculated. At 1,692 intermediate wave (3) would reach 4.236 the length of intermediate wave (1).
There may now again be a complete downwards first wave leading expanding diagonal. Leading diagonals in first wave positions are often followed by very deep second wave corrections. Minor wave 2 may end about the upper cyan trend line.
Minor wave 2 may not move beyond the start of minor wave 1 above 2,104.27.
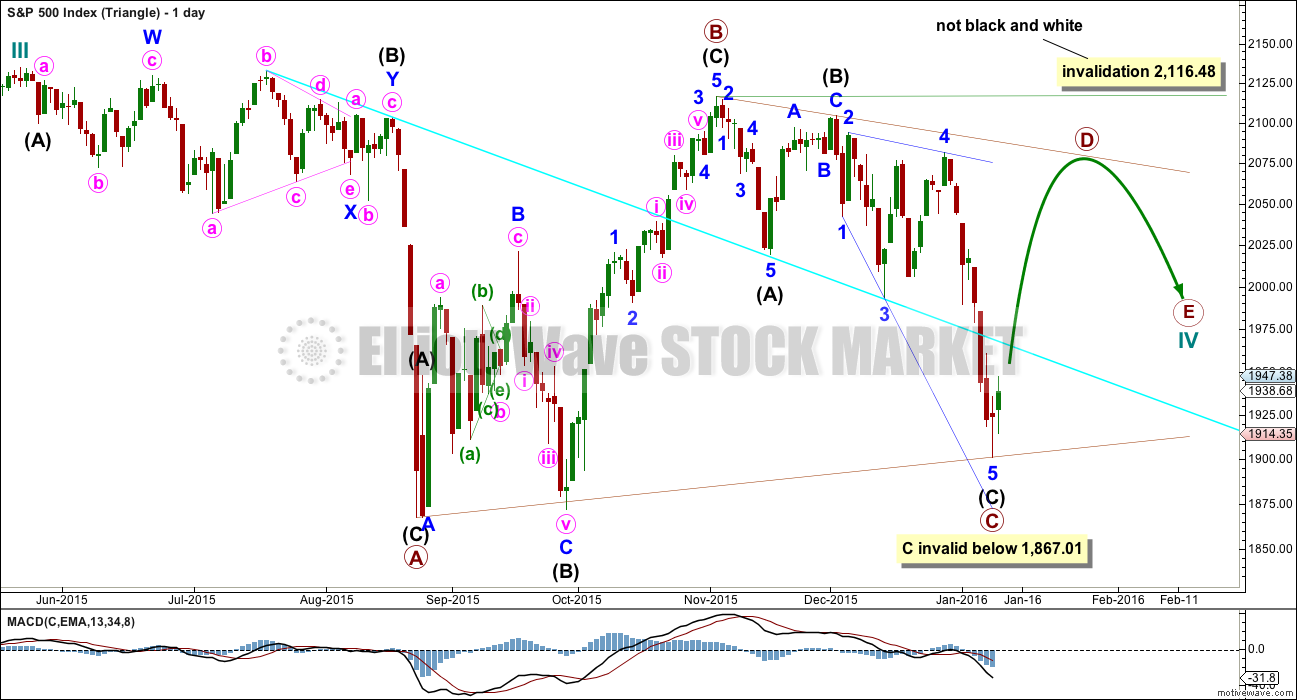
DAILY CHART – TRIANGLE
Click chart to enlarge.
Cycle wave IV may unfold as a shallow triangle. This would provide alternation with the 0.41 zigzag of cycle wave II.
The triangle may be either a regular contracting or regular barrier triangle. An expanding triangle would also be technically possible, but as they are the rarest of all Elliott wave structures I would only chart and consider it if it shows itself to be true. Prior to that, the probability is too low for consideration.
Primary wave B would be a complete zigzag. The subdivisions all fit and now it has a clearer three wave look to it.
Primary wave C should unfold downwards as a single or double zigzag. So far it may be a single zigzag, with intermediate wave (C) an ending expanding diagonal.
Primary wave C may not move below the end of primary wave A at 1,867.01. This invalidation point is black and white for both a contracting and barrier triangle.
Primary wave C may now be a complete zigzag. Primary wave D upwards should unfold as a single or double zigzag. For a contracting triangle, primary wave D may not move beyond the end of primary wave B above 2,116.48. For a barrier triangle, primary wave D should end about the same level as primary wave B at 2,116.48. The triangle would remain valid as long as the B-D trend line remains essentially flat. This invalidation point is not black and white. This is the only Elliot wave rule with any grey area.
Thereafter, primary wave E downwards may not move beyond the end of primary wave C.
The whole structure moves sideways in an ever decreasing range. The purpose of triangles is to take up time and move price sideways. Price exits the triangle in the same direction that it entered, in this case up. When the triangle is complete, then the bull market would be expected to resume. This triangle should take several months yet to complete.
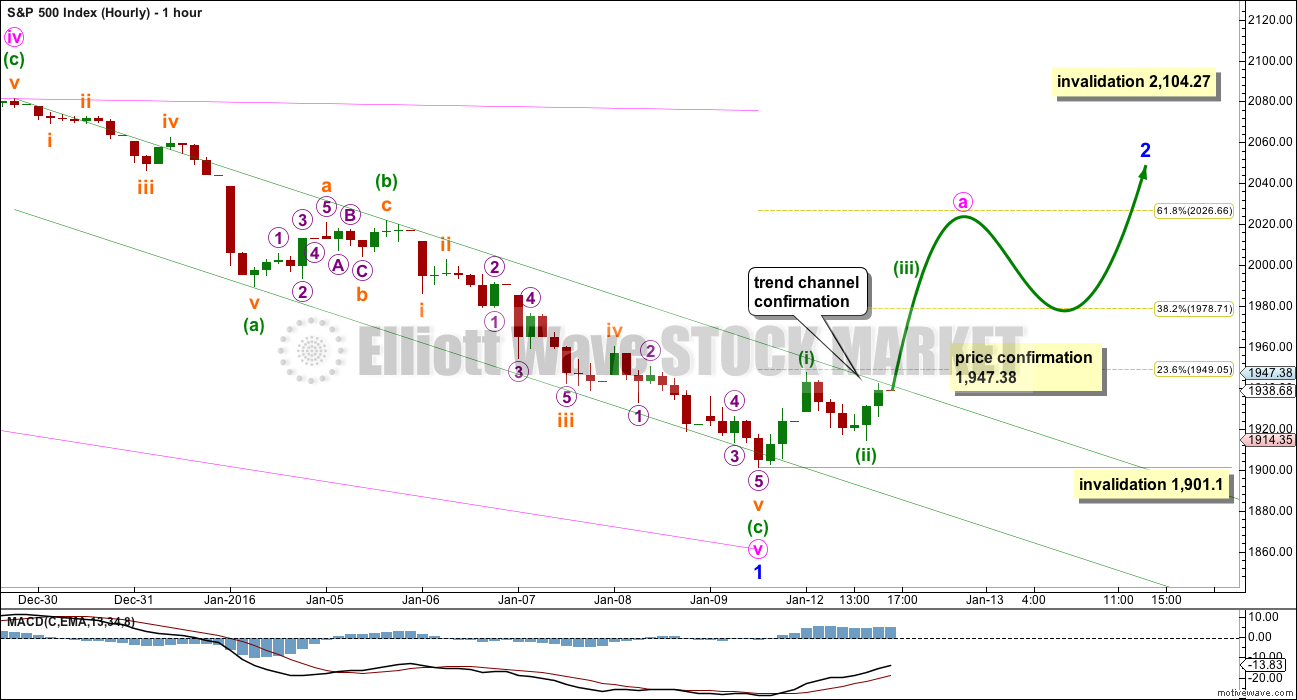
HOURLY CHART
Click chart to enlarge.
This hourly chart follows on directly from the labelling of the main daily chart.
The zigzag for minute wave v may be seen as complete.
With Tuesday completing a green candlestick on the daily chart, the zigzag of minute wave v should definitely be complete. It looks like a three on the daily chart and it is longer than minute wave iii. All the rules for a leading expanding diagonal of minor wave 1 are met. Expanding diagonals most commonly end with the fifth wave falling a little short of the 1-3 trend line as this one does.
Minor wave 2 is most likely to be very deep and most likely to be a zigzag. The first move upwards should be a five. If minor wave 2 is not a zigzag, then it should still begin with a five up at the hourly chart level for a wave of this degree.
Within the first five up, minuette wave (ii) may not move beyond the start of minuette wave (i) below 1,901.1.
The hourly chart for the bear is adjusted today and the invalidation point may now be set very close. A new high above 1,947.38 would add confidence to this wave count, and at that stage price would also break above the trend channel providing further confidence.
Minor wave 2 may last about two weeks. If it exhibits a Fibonacci duration, it may last either a Fibonacci 8 or 13 days.
BEAR ELLIOTT WAVE COUNT
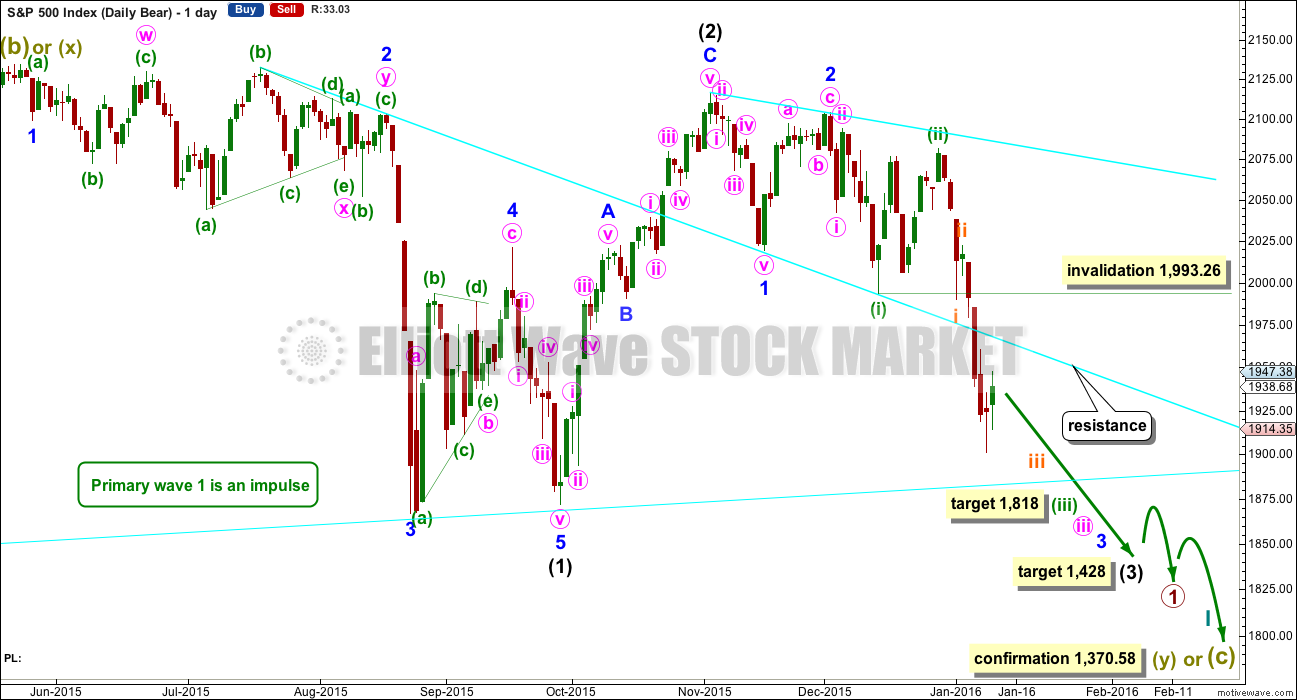
DAILY CHART
Click chart to enlarge.
This bear wave count fits better than the bull with the even larger picture, super cycle analysis found here. It is also well supported by regular technical analysis at the monthly chart level.
Importantly, there is no lower invalidation point for this wave count. That means there is no lower limit to this bear market.
The downwards movement labelled intermediate wave (1) looks like a five. If minor wave 2 is seen as a double flat with a triangle for wave X within it, then the subdivisions all fit nicely.
Ratios within intermediate wave (1) are: minor wave 3 is 7.13 points short of 6.854 the length of minor wave 1, and minor wave 5 is just 2.82 points longer than 0.618 the length of minor wave 3. These excellent Fibonacci ratios add some support to this wave count.
Intermediate wave (2) was a very deep 0.93 zigzag. Because intermediate wave (2) was so deep the best Fibonacci ratio to apply for the target of intermediate wave (3) is 2.618 which gives a target at 1,428. If intermediate wave (3) ends below this target, then the degree of labelling within this downwards movement may be moved up one degree; this may be primary wave 3 now unfolding and in its early stages.
At 1,850 minor wave 3 would reach 2.618 the length of minor wave 1. This first target is removed now because it does not fit with the new target for minuette wave (iii). If price falls through this first target, then the next Fibonacci ratio in the sequence is 4.236 which would be reached at 1,693. If minor wave 3 is very extended, then the degree of labelling for all downwards movement from the all time high will be moved up one degree.
At 1,818 minuette wave (iii) would reach 2.618 the length of minuette wave (i).
Because minuette wave (ii) was a deep correction of minuette wave (i), it would be expected that the correction of minuette wave (iv), when it arrives, should be shallow against minuette wave (iii). Minuette wave (iv) may not move into minuette wave (i) price territory above 1,993.26.
The scenario of a leading diagonal now complete and a deep second wave correction to follow works in exactly the same way for this bear wave count.
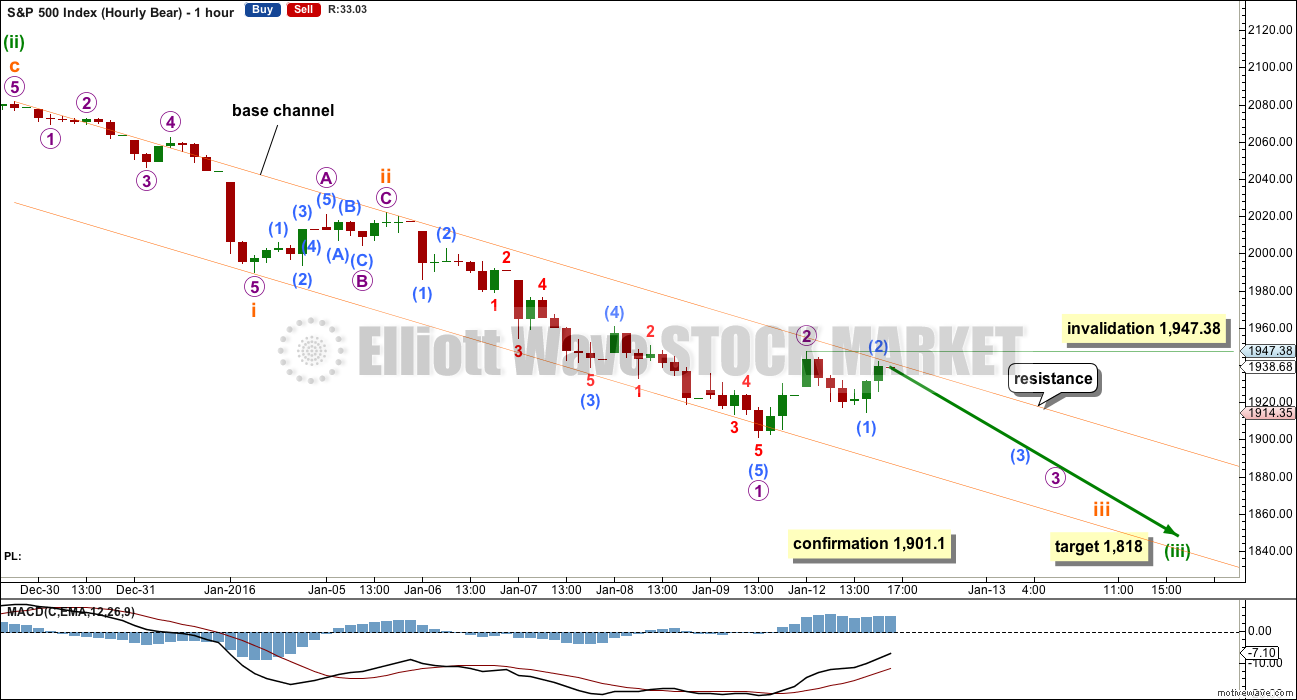
HOURLY CHART
Click chart to enlarge.
The labelling for downwards movement is again changed. This fits with the labelling on the first hourly chart and the subdivisions on the five minute chart all fit.
This wave count remains entirely valid while price has not yet managed to break above the upper edge of the base channel. The implications are very important. This wave count expects price to fall off a cliff tomorrow, for very strong downwards movement. The middle of a big third wave is still ahead.
If there is now another first and second wave complete for micro waves 1 and 2, then micro wave 3 has begun. Within micro wave 3, submicro wave (2) may not move beyond the start of submicro wave (1) at 1,947.38.
This wave count now requires price to break below the lower edge of a base channel. That would be confirmation of a third wave. A new low below 1,901.1 would provide price confirmation.
If that happens tomorrow, then expect surprises to the downside. If targets are wrong, they may not be low enough.
TECHNICAL ANALYSIS
DAILY CHART
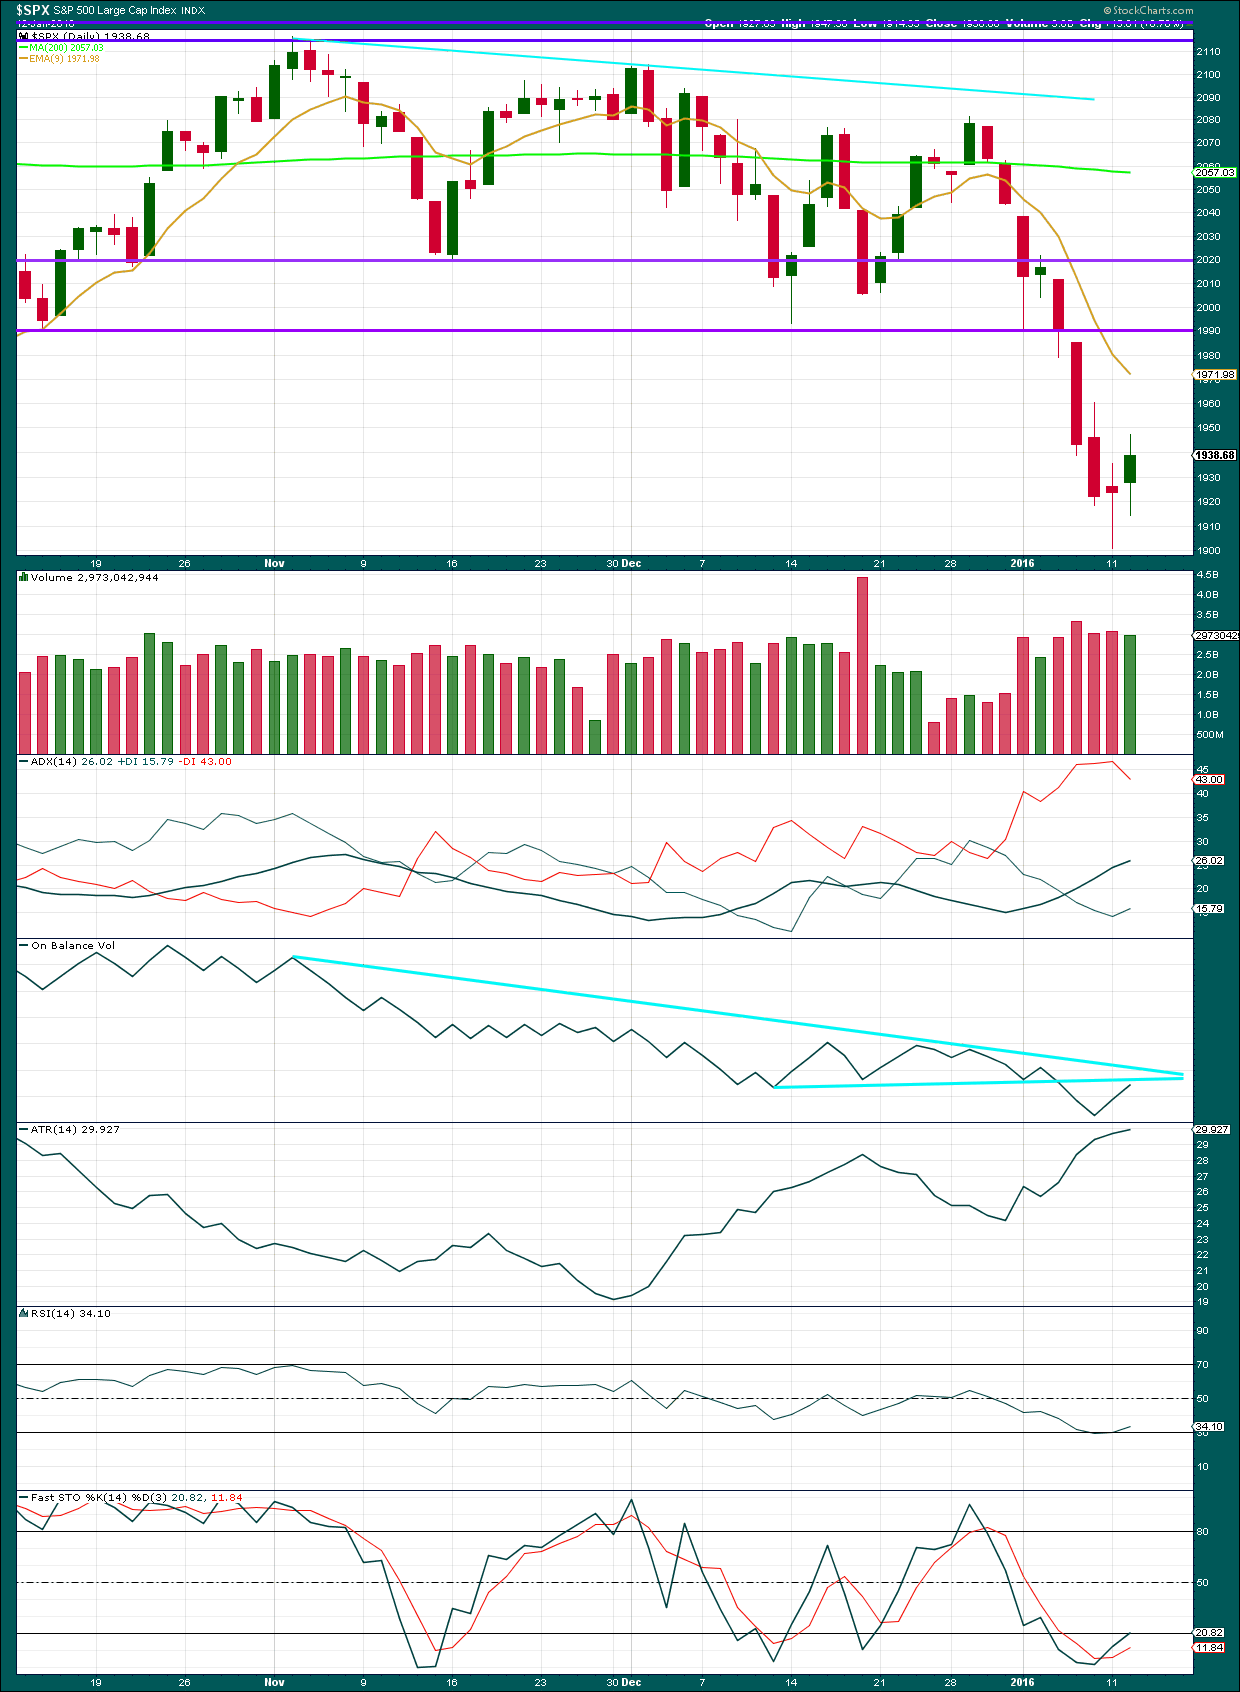
Click chart to enlarge. Chart courtesy of StockCharts.com.
An upwards day with lighter volume supports the Elliott wave counts which expect this upwards day is a correction.
Note: The candlestick pattern of the last three daily candles is not a viable Morning Star pattern because the star (middle candlestick) is within the real body of the first. (“Japanese Candlestick Charting Techniques”, second edition, Steve Nison, page 62.)
ADX still indicates a downwards trend is in place and ATR agrees as it is increasing. ADX indicates the trend is still young. Both these indicators are lagging as they are based upon averages. If a bounce is beginning, they will not indicate it.
RSI is returning from oversold. More upwards movement may be necessary to bring it closer to neutral in preparation for the next move down.
Stochastics is also returning from oversold.
Price may be expected to find strong resistance at the horizontal trend line about 1,990.
DOW THEORY
For the bear wave count I am waiting for Dow Theory to confirm a market crash. I am choosing to use the S&P500, Dow Industrials, Dow Transportation, Nasdaq and I’ll add the Russell 2000 index. Major swing lows are noted below. So far the Industrials, Transportation and Russell 2000 have made new major swing lows. None of these indices have made new highs.
At this stage, if the S&P500 and Nasdaq also make new major swing lows, then Dow Theory would confirm a major new bear market. At that stage, my only wave count would be the bear wave count.
The lows below are from October 2014. These lows were the last secondary correction within the primary trend which was the bull market from 2009.
S&P500: 1,821.61
Nasdaq: 4,117.84
DJT: 7,700.49 – this price point was breached.
DJIA: 15,855.12 – this price point was breached.
Russell 2000: 1,343.51 – this price point was breached.
This analysis is published @ 11:25 p.m. EST.
Verne or Jack,
I have a detailed technical concern on my charting and my research. What is your Skype if you dont mind matey?
What time zone are you guys in?
Are you in the states currently?
Central. In the US.
ok cool – I figures since we are chasing this down. I need to add you on my contact list man! Skype?
I was along the lines of thinking 1867 holds and bounces. That is an extreme buy zone?
Do we just wait and see?
I am thinking if the banksters were going to make a stand they would have done it yesterday at the 1900 pivot. Maybe they just got overwhelmed with the selling pressure. Its funny how they are trying to push up futures to make everyone think the wave down is over. I would not be surprised to actually see a gap down at the open. We definitely need a gap up open in UVXY to signal an intemediate bottom is near and capitulation has at least begun…at least that is the way it has generally gone in the past…we’ll see! 🙂
Options – see in a bear market a trader could be a bear and of course the trend could be down (as it is supposed to be) and the trader could still lose his or her pants…trading a bear is not like trading a bull…getting the trend right alone is not sufficient
Now – I can tell you, I am not a day trader
(iii)=(i)*1.618 can be (iii) Minuette ended !
Count more clear last section
I think the next target (iii) Minuette further down and ahead of the finish. According to the target LARA 1818
Shalom,
avnerilan
Do you think we can tag 1700 o this run down? Or 1818 would complete it?
(iii)=(i)*1.618 can be (iii) Minuette ended, See more graph more…. Repair previous rises to (iv)
Thanks!
What happened to the wave ( 4 ) idea – down to the 1650 area ? Wave ( 2 ) was around 20 % so a move there would be in line. On a log chart, it would hit the up trend line showing on the monthly charts.
I agree that is the target
Lara, I follow quite a few analysts and you were the only one among them favoring a new low after the last couple of day’s uptrend. Nice work!
This market is absolutely nuts! You’ve got fifth waves behaving live thirds and thirds apparently not doing what they’re ‘sposed to…UVXY pretending that it’s NOT going to spike when it knows darned well that it should and trying to drive me bananas!!
I’ll take it… 🙂 🙂 🙂
Congratulations to those of you who stayed with the trend…this thing is not done by a long shot so buckle up…today’s candle now engulfing BOTH previous up days in a MASSIVELY bearish signal…futures overnight ought to go nuclear…
why thank you!
I got paranoid…lol..had to parachute out
Banksters don’t mind taking bear’s money so…
I was looking for capitulation…didn’t happen today, so IMHO this bear might have some more room to run
At the same time let’s not get too carried away with this…we’re gonna retrace this back up, so lets be nimble. Banksters can’t have bear’s food. Bear needs food to hibernate…bears got to eat too :).
I’m already missing my Monday’s short position…
Took profits on half my shorts today. It seems to me we really need to take out the August lows on this leg down if this bear market is serious, and you are absolutely right- where is the capitulation? It just ain’t there. I think there are some big players who are convinced the August low of 1867.01 will hold and have stops in that area so are not too worried…yet. I expect there are also lots of potential buyers at that pivot so what the market does there is going to be of dramatic significance. I would be quite surprised if we don’t re visit that neighborhood and it is really not that far away now. UVXY is a laggard and not keeping pace with the price action- could be bearish…reflecting still too much complacency…if it falls through 1867, we may need a degree change….
I agree…
My concern is that we are getting closer to the end of this third wave, and folks are getting really bearish now…we might have a major pop in here sometimes soon with a major short squeeze with bullish&attimesbearish folks getting burned… though, I do think near term we are going to have a little more down side to finish this fifth wave. IMHO – I could be wrong
Well i am not bullish and no need to question what happened today. I saw oil drop in 1 second -2%.
This should be the BIG DROP to 1600-1550 maybe by the first week of FEB 2016..
You are NOT bullish??!! I thought you were LONG…what was that about not betting against you…?? 🙂
Just kidding of course; I have been on the wrong side of more trades than I can count…
I think we are going to see a substantial bounce before anywhere near 1650…
I admit I got carried away with 1990 target but I still
caught most of this drop today 😉
I am flexible
I honestly doubt it
We are headed straight down
The market is to weak
Think about it
We closed below 1900
That is enough proof to me
Big down day again tommorow
1840
ish
I am comparing my notes to the research tonight
I can almost give full confidence we will hit 1630
Why
I was looking for a 20% correction
We slways over shoot by a couple
Percentage so odds are we hit 23% to keep the math simple from 2116
I think 1550 is also in the cards and that is the next long bounce ….
Your uvxy will
Sky rocket in price tommorow
Matey!!!
I explained I was looking for 1960 first then I updated based on 10 dma but that is out of the cards
I am long term bearish and I was only intra day bullish
You got to be a bit looney to be holding calls long!
The open actually got to 1950 but didn’t stay there on an hour bar so that was the clue
Further 1914 gave away and that was the signal
So I’m a student of the market and it could have gone both ways
Remember yesterday it did the same thing but then 1914 cracked yesterday!
If UVXY prints a red candle today, it’s probably going South for a while. This market is nuts. Volatility not in any way shape or form indicating any kind of capitulation. Either we still got a long way down to go, or the market character has morphed into something wholly unpredictable.
yep
UVXY is indeed a bit lack-luster. The sweet spot of the trade is ususally the completion of the third wave down. For an intermediate three down as compared to intermediate one down last August, it should have been farther along toward the August highs at this point. It may be signalling that more downside is ahead, and that it will come harder and faster than what we have seen so far….the spike executes over a couple days usually…we’ll see I guess…
And I quote:
“This wave count now requires price to break below the lower edge of a base channel. That would be confirmation of a third wave. A new low below 1,901.1 would provide price confirmation.” – Lara
It is pretty black and white to me at this point and mute for any bounce higher +1%-4%
It is would be kinda strange if wave five ended today. While it is clearly not a truncation because of the new low, its conclusion would have been remarkably swift compared to the other waves. The absence of any significant momentum increase for wave three certainly suggest that we should have seen a powerful extended wave for five. Unless UVXY pushes higher it looks like that’s all she wrote for this leg down.
we are heading lower. the trend is down it could bounce on those channels but if we got to go another 200 points the VIX needs room to breath!
Action in UVXY classic for fifth wave action. If it closes down today that would signal an short term bottom at very likely less than intermediate degree and the real start of a manic second wave up. Looks like we have a complete impulse down.
With new low could recent action B wave expanded flat correction after 3 wave up A rather than 3rd wave of bear beginning given daily volume on downside not that impressive.
if 5th wave, what is the target?
I’m out – bought back in 35% of my short position this morning market open – cleared all 60% – we might get the fifth wave truncated
I cannot imagine it would happen twice since the decline this time was much more measured, but wary of another fifth wave truncation…you never know about those banksters…!
Trade safely folks…the trend is down…(but y’all know that! ) 🙂
1700 man… 10 days…
Jack and Verne,
updates, I’m open to the ideas had a good run and got confirmation so time to SHORT!
btd didn’t work…
I thought you were long options! 🙂
Where, oh where, is the fear in this market???!!!
It’s just not there IMHO
i was then switched out – was right on the pop call but never got to my target of 1960 originally and it didn’t hold. Also, i am not crazy! 🙂
VIX TAKES TIME TO POP 1-3 days. IF WE ARE ARE HEADED TO 1600-1550 WE NEED MORE ROOM!
save it!
The scenario on the hourly bear will change: I’m going to look at this as subminuette i-ii-iii-iv. With the fourth wave just complete.
As Jack notes below we have seen the S&P exhibit a swift strong fifth wave before in an impulse. Maybe for some reason at this time it’s behaving a little like a commodity in this bear market?
Anyway, when I look at this impulse on the daily chart I see what looks like i-ii-iii-iv. Now it could still be i-ii, 1-2… but thats not how I want to label it on the daily chart.
Both are possible, but I’m going to go with the fourth wave complete now and look for a swift strong fifth wave. It may yet turn out to be the third wave still, and so that labelling may change. It makes no difference to targets at higher degrees nor to direction at this stage.
For the first hourly chart, the ending diagonal scenario, this sideways chop may be a second wave correction continuing. That chart remains pretty much the same and the invalidation point is the same.
I note so far the bearish engulfing candlestick pattern. According to Nison these should be used when they come after a clear upwards trend. This one is coming either in the middle of a downwards trend, or if you take yesterdays single green candlestick as evidence of a consolidation, at the end of a consolidation. Reversal patterns during consolidations are not reversal signals.
When I sat my CMT exams though I noted the MTA don’t follow that interpretation in Nison. I learned to note reversal patterns within consolidations as viable reversal signals – at least, a signal for price direction out of a consolidation. I found that a disconnect between the textbook and the way the exams are marked. And I wonder, which is correct? I’m inclined to go with Nison as he wrote the book on it. But I’m aware that others interpret these patterns differently.
Russell 2000 printing a new 52 week low today so its bounce is apparently already over. If the other indices follow suit, more downside in the wings…
Bearish engulfing candlesticks in formation today. Jack may be onto something with that fifth wave call. In a prior impulse we also had a fifth wave showing greater momentum than a third.
Vern– with UVXY you use B bands. What’s your favorite timeframe–20 days, 50 days, 100, 200 ?
Thanks
The volatility cycle has changed in the last three months. The trend is now up, and both VIX and UVXY seem to be penetrating the upper B band every thirty days or so…that however, could also change at any time as bearish sentiment takes hold and panic spreads through the market…
should I dare say hello fifth wave…anyone
Please wait for the close – to fast to get bearish!
chances are WE GO UP!
MARKETS ARE GOING TO BE LIKE THIS UNTIL WE GET NEAR 2,000….
later man!
I hope your long stops are in place matey…you may need ’em…
i am logging off. we finish green!
later…
Line in the sand is yesterdays swing low around 1914.60 – if we go below that then this move up over the past couple days is likely a zig-zag / expanded flat (A wave could either be a 5 or a 3, but whole structure currently looks more exp flat than a zig zag).
But at what degree? This could be just Wave A of a move which extends quite a bit higher, or could now be over. Price will tell all!!
Of course we could also be about to blast upwards in iii of (iii). But def looking top heavy to me atm
i agree 1914 is key
bye
Jack,
I’m taking the day off. later man!
Be real careful on getting bearish to soon to quick. I think Olga has some very good points about 1914 and I agree with that…
Will do…take care…I got to take off myself
Hi Lara,
Can wave A of an ABC be impulsive and if so, can it be a leading diagonal?
Many thanks
That’s a very interesting question. Wave A can certainly be impulsive (zig zag 5-3-5) but I have never seen a leading diagonal in wave A position. Apparently there have been a few appearances – I thought they were just found as wave 1 until I read the link below.
http://www.elliottwave.com/tutorial/lesson3/3-3.htm
Do they occur very often Lara?
Actually – current market action could well morph into a leading diagonal – I guess that’s what prompted your question? Thanks for the heads up!!
Yes.
In a zigzag the A wave subdivides as a five. Its impulsive.
It can be either a simple impulse or a leading diagonal.
I’ve seen plenty over the years.
Banksters are flailing. They keep trying to push futures triple digits into the green but the market is top heavy. This correction may end sooner than we think.
Technical indicators are over done imo and until that is relieved we grind up. it could fall short but +2% is a good conservative fib retrace…
chop fest warrants this view and shows the struggle up but not bearish enough to get fully short. ma reconnect happens usually and are a classic move of large declines….Plus – everyone is probably selling rallies but it is when everyone least expects the market to drop that it will drop!
SPX is holding up very good – it is normal to pull back a little after a +50 point run up on a 90 point up side potential target….
Nothing to see here. i am waiting for the close day by day. Unless of course this falls out of bed which would make it obvious…
Good news!
Long term projections are now being echoed….
Can you give us a link to the article.
It is just a twitter comment:
https://twitter.com/ReutersJamie
I hedged all my shorts yesterday, now its a point of deciding how long can this go and at what point I cash out and just hold short again. This move is again proving tricky
This upward move will in all likelihood be an abc, so theoretically, one could look for the b pullback, then to be safe, bail when c up gets back (not equals!) close to the a high. In this market the risk is to the downside so even experienced traders are not going to try to get cute but instead trade the trend. Volatility has now reversed and is clearly in an uptrend. Both VIX and UVXY have developed the pattern of piercing the upper B band about once a month since last November and that pattern will probably continue. The penetrations have the last three months all come around the middle of the month, making higher highs above the B band on Nov 16, Dec, 14, and most recently Jan 11 of this year. This projects another penetration high above the B band to around the middle of February, which will probably co-incide with the next temporary bottom.
Here’s the problem: we do not know if that is going to be the bottom of minuette, minute, minor, or intermediate three. An awful lot can happen between now and the middle of February and If the bottom drops out of this market with an accelerating decline to the downside (entirely possible with all the political and economic exogenous shocks lurking out there), you will not have a lot of time to take cover. I personally am cashing in remaining upside hedges today. Very content to watch the abc run-up from the sidelines, and use the last C up to load my final short trades. The risk is to the downside. Trade accordingly! 🙂
Totally agree – If I get the time to watch the waves, I might scalp during this move up but it is picking up dimes in front of a steam roller so will certainly not be with any conviction. I’m still totally out of the market atm.
If we’re lucky the market will move up close to the invalidation point so to make as many people as possible believe that the bull is back – that would create a superb low risk entry point for the bears.
After b (or x) is finished we can use Fib ratios of wave a to get poss targets to pull the trigger. No doubt Lara will publish those targets.
Will be amazed if everything goes to plan but thats mine!! If we get new lows then will have to reconsider – travelling all day tomorrow so hoping the market will cut me some slack.
I will be away from my computer most of this morning. I like your strategies, verne and Olga. I want to see us burn off the oversold conditions and the daily and hourly levels. The a-b-c correction can do this. Then I will be looking to get on the back of the bear.
Thank You mate 🙂
This is exactly how trading this market is – honestly!
Till the open!
Later!
Jack
Once we get near 2,000 I will feel like this:
Michael Jackson “Billie Jean”
https://www.youtube.com/watch?v=rAiw2SXPS-4
Cool song; let’s be nimble, and let’s not forget to take profits.
I agree…
Jack
After todays price action. I feel like this:
The Verve – Bitter Sweet Symphony
https://www.youtube.com/watch?v=1lyu1KKwC74
That’s good. I punch out of 75% of my short position yesterday (since now we’re 23 minutes past midnight ET); I even sold my upside hedges. What an interesting day we had yesterday. IMHO we’re gonna see the fifth wave of this third wave that we’re in soon. I think we’re doing an ABC up (we’re now close to the end of C wave) to finish iv. Then we’ll have the fifth wave of this third wave to finish the wave. Something is not complete with this wave structure.
Honestly, this should be a straight or somewhat sideways thrust up +3%-4% from the cash close today and that should do it. It is perfect to fool the bulls and stop out the bears. Remember this market took the bulls money for the past few weeks now it is going after the bears money and will head fake at mean reversion. It will park it shy near 2,000 and swing hopes to come crashing down. Pure speculation but you got to swing for the fences on a setup like this…
I am going to wait and get back in my full short position once we get the setup, planing to wait for vix to get back to its 50day SMA.
Although 3 to 4% upside…i think it might be a little to early for that. I’ll have to get some upside hedges.
O.k, as long as you have a plan and stick with it. I got a potential open gap below at high 16s. Perfect for a long wick….I understand it is risky to trade this up but it is not for everyone which is fine – sometimes you don’t have to over trade – been there, done that – not fun.
In latin they say:
Audaces fortuna iuvat
laters….
lol I am not trying to be a hero. Thanks for the chart.
yw – last thing – markets in general over shoot. So it could hit that higher range of 2020 but it does not change the BEARISH OUTLOOK for 2016…
I agree. If I decide to keep the remaining short ETFs that I have, I might sell some short term call option on them (expiration 01/15).
hi
All
ES up REALLY nice. It will pick up speed to the upside during the CASH session.
no jinx
laters