
The first target for a short term interruption to the trend at 1,919 was met on Friday.
Summary: This is not the end of the third wave yet although the short term target at 1,919 was met. The lower second target at 1,818 will be used. Downwards movement should continue and should show an increase in momentum next week. Use the hourly bear wave count while price remains below the upper edge of the channel on the hourly charts. If price breaks above that trend line, then use the hourly bull wave count.
To see how each of the bull and bear wave counts fit within a larger time frame see the Grand Supercycle Analysis.
To see detail of the bull market from 2009 to the all time high on weekly charts, click here.
Last published monthly charts can be seen here.
If I was asked to pick a winner (which I am reluctant to do) I would say the bear wave count has a higher probability. It is better supported by regular technical analysis at the monthly chart level, it fits the Grand Supercycle analysis better, and it has overall the “right look”.
New updates to this analysis are in bold.
BULL ELLIOTT WAVE COUNT
DAILY CHART – COMBINATION OR FLAT
Click chart to enlarge.
This wave count is bullish at Super Cycle degree.
Cycle wave IV may not move into cycle wave I price territory below 1,370.58. If this bull wave count is invalidated by downwards movement, then the bear wave count shall be fully confirmed.
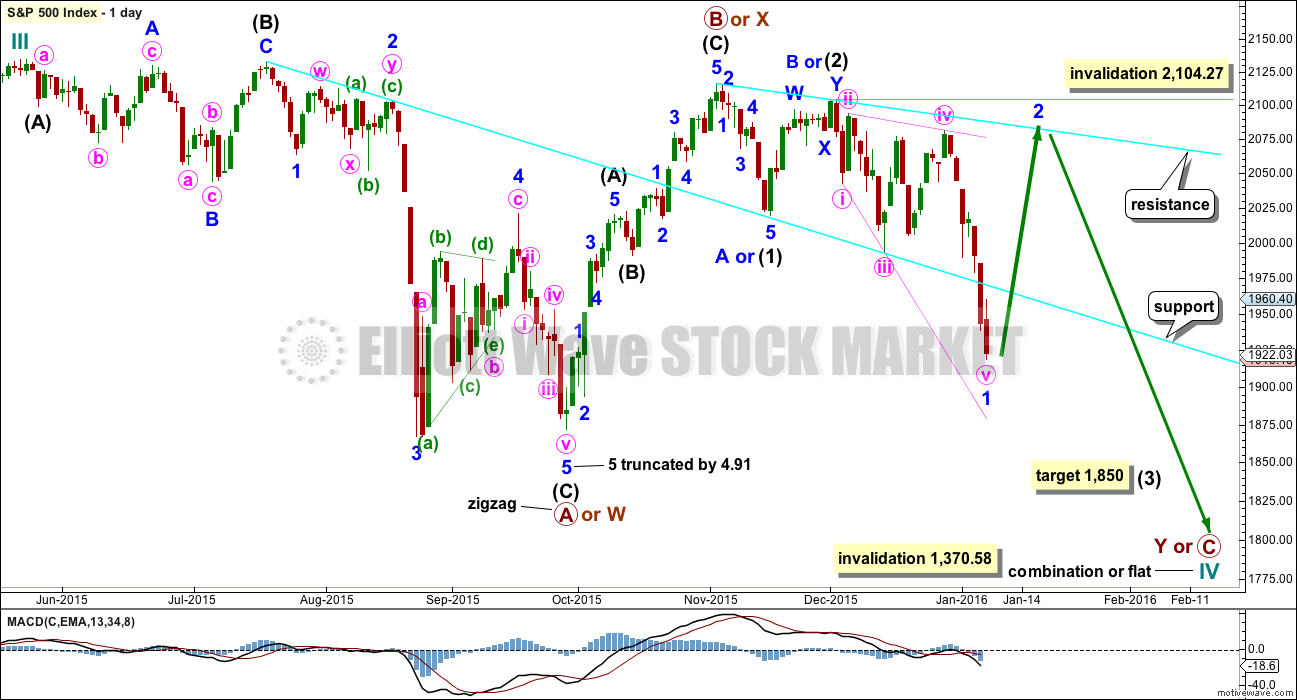
Cycle wave II was a shallow 0.41 zigzag lasting three months. Cycle wave IV should exhibit alternation in structure and maybe also alternation in depth. Cycle wave IV may be a flat, combination or triangle. The two daily charts look at these three possibilities.
Cycle wave IV may end within the price range of the fourth wave of one lesser degree. Because of the good Fibonacci ratio for primary wave 3 and the perfect subdivisions within it, I am confident that primary wave 4 has its range from 1,730 to 1,647.
If a zigzag is complete at the last major low as labelled, then cycle wave IV may be unfolding as a flat, combination or triangle.
Primary wave C should subdivide as a five and primary wave Y should begin with a zigzag downwards. This downwards movement is either intermediate waves (1)-(2)-(3) of an impulse for primary wave C or minor waves A-B-C of a zigzag for intermediate wave (A). Both these ideas need to see a five down complete towards the target, so at this stage there is no divergence in expectations regarding targets or direction.
Primary wave A or W lasted three months. Primary wave C or Y may be expected to also last about three months.
Within the new downwards wave of primary wave C or Y, a first and second wave, or A and B wave, is now complete. Intermediate wave (2) or minor wave B lasted a Fibonacci 13 days exactly. At 1,850 intermediate wave (3) or minor wave C would reach 2.618 the length of intermediate wave (1). At this stage, this will be the sole target for this third (or C) wave to end as it fits better with more short term targets calculated at the hourly chart level.
There may now again be a complete downwards first wave leading expanding diagonal. It is my judgement that this idea at this stage has a lower probability than the other idea presented with the daily bear wave count; both ideas work in the same way for bull and bear wave counts.
If price moves above 1,986.02 early next week, then this idea will be used for both bull and bear wave counts. If a leading diagonal is complete, then it should be followed by a very deep second wave correction which may not move beyond the start of the first wave above 2,104.27.
DAILY CHART – TRIANGLE
Click chart to enlarge.
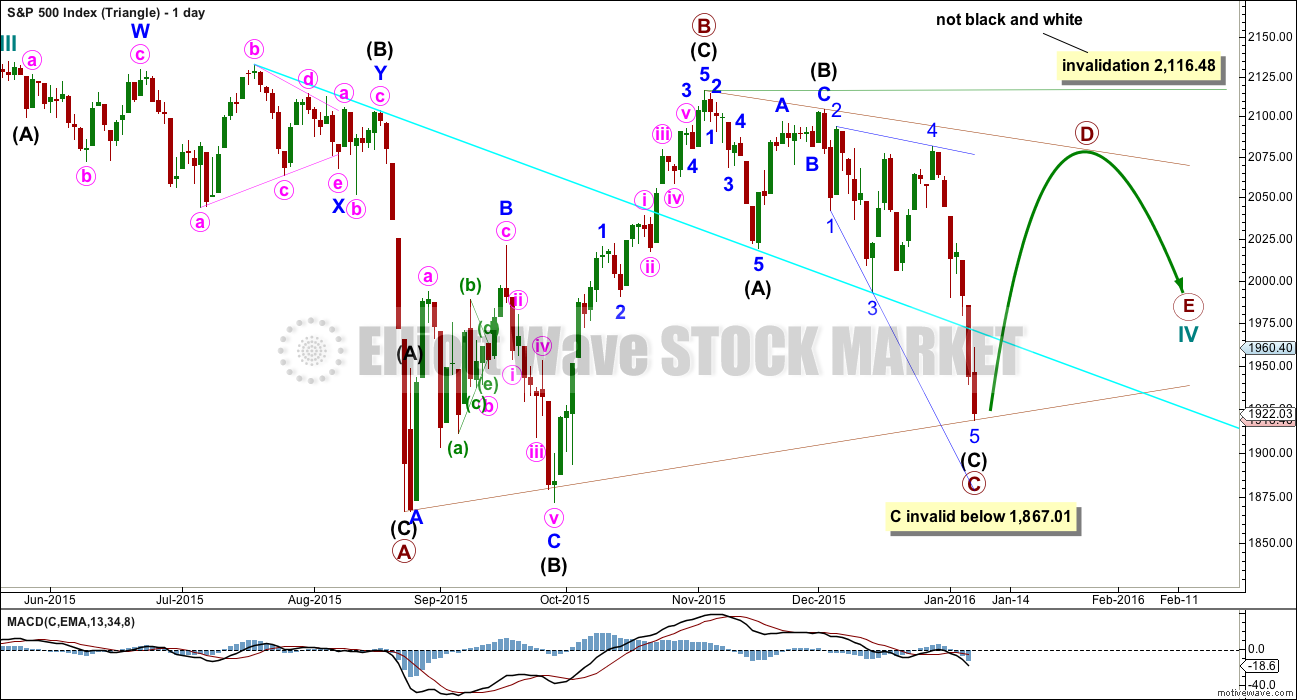
Cycle wave IV may unfold as a shallow triangle. This would provide alternation with the 0.41 zigzag of cycle wave II.
The triangle may be either a regular contracting or regular barrier triangle. An expanding triangle would also be technically possible, but as they are the rarest of all Elliott wave structures I would only chart and consider it if it shows itself to be true. Prior to that, the probability is too low for consideration.
Primary wave B would be a complete zigzag. The subdivisions all fit and now it has a clearer three wave look to it.
Primary wave C should unfold downwards as a single or double zigzag. So far it may be a single zigzag, with intermediate wave (C) an ending expanding diagonal.
Primary wave C may not move below the end of primary wave A at 1,867.01. This invalidation point is black and white for both a contracting and barrier triangle.
Primary wave C may now be a complete zigzag. Primary wave D upwards should unfold as a single or double zigzag. For a contracting triangle, primary wave D may not move beyond the end of primary wave B above 2,116.48. For a barrier triangle, primary wave D should end about the same level as primary wave B at 2,116.48. The triangle would remain valid as long as the B-D trend line remains essentially flat. This invalidation point is not black and white. This is the only Elliot wave rule with any grey area.
Thereafter, primary wave E downwards may not move beyond the end of primary wave C.
The whole structure moves sideways in an ever decreasing range. The purpose of triangles is to take up time and move price sideways. Price exits the triangle in the same direction that it entered, in this case up. When the triangle is complete, then the bull market would be expected to resume. This triangle should take several months yet to complete.
HOURLY CHART
Click chart to enlarge.
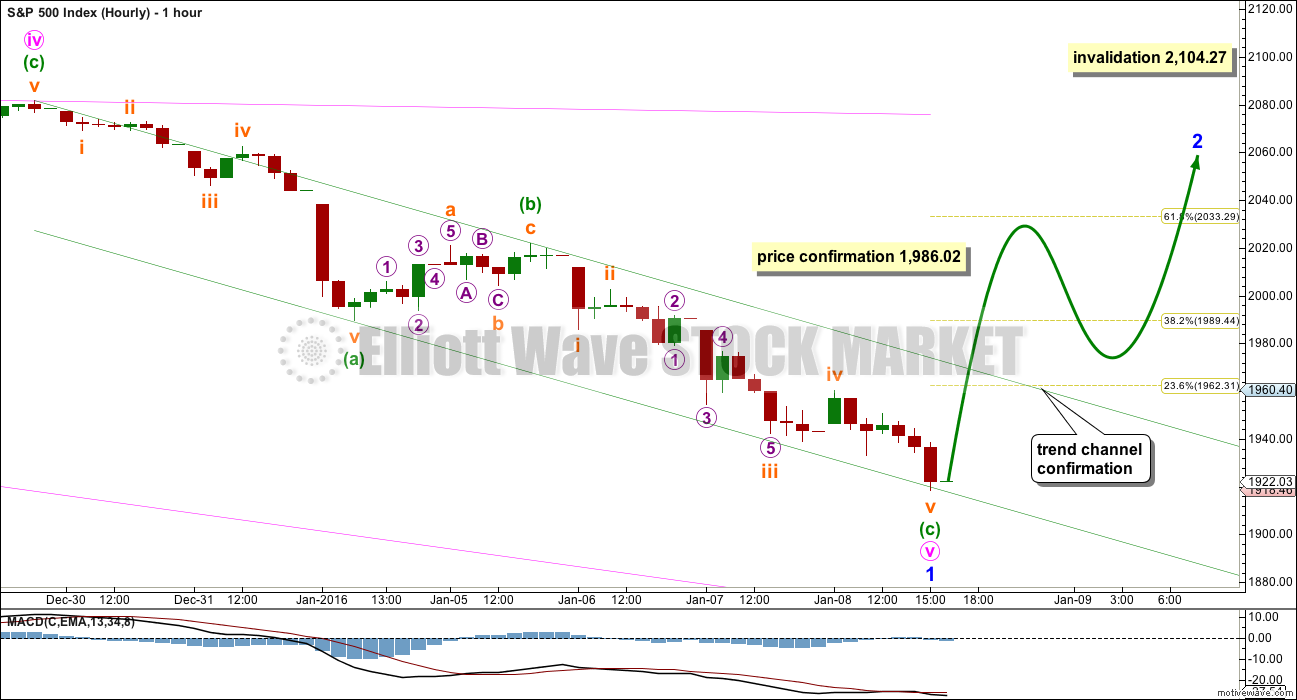
This hourly chart follows on directly from the labelling of the main daily chart.
The zigzag for minute wave v moved lower and again may be seen as complete.
Within the leading diagonal, minute wave iii was just 0.39 points longer than 1.618 the length of minute wave i and minute wave v would now be just 0.36 points longer than minute wave iii.
If price breaks above the green channel which contains this zigzag on Monday, then this wave count should immediately be taken very seriously. That may be the earliest indication that upwards movement will continue for several days, maybe about two weeks, for a very deep second wave correction.
Minor wave 2 should be deeper than the 0.618 Fibonacci ratio of minor wave 1. It may not move beyond the start of minor wave 1 above 2,104.27.
If price continues to fall on Monday and Tuesday, this idea will be discarded.
BEAR ELLIOTT WAVE COUNT
DAILY CHART
Click chart to enlarge.
This bear wave count fits better than the bull with the even larger picture, super cycle analysis found here. It is also well supported by regular technical analysis at the monthly chart level.
Importantly, there is no lower invalidation point for this wave count. That means there is no lower limit to this bear market.
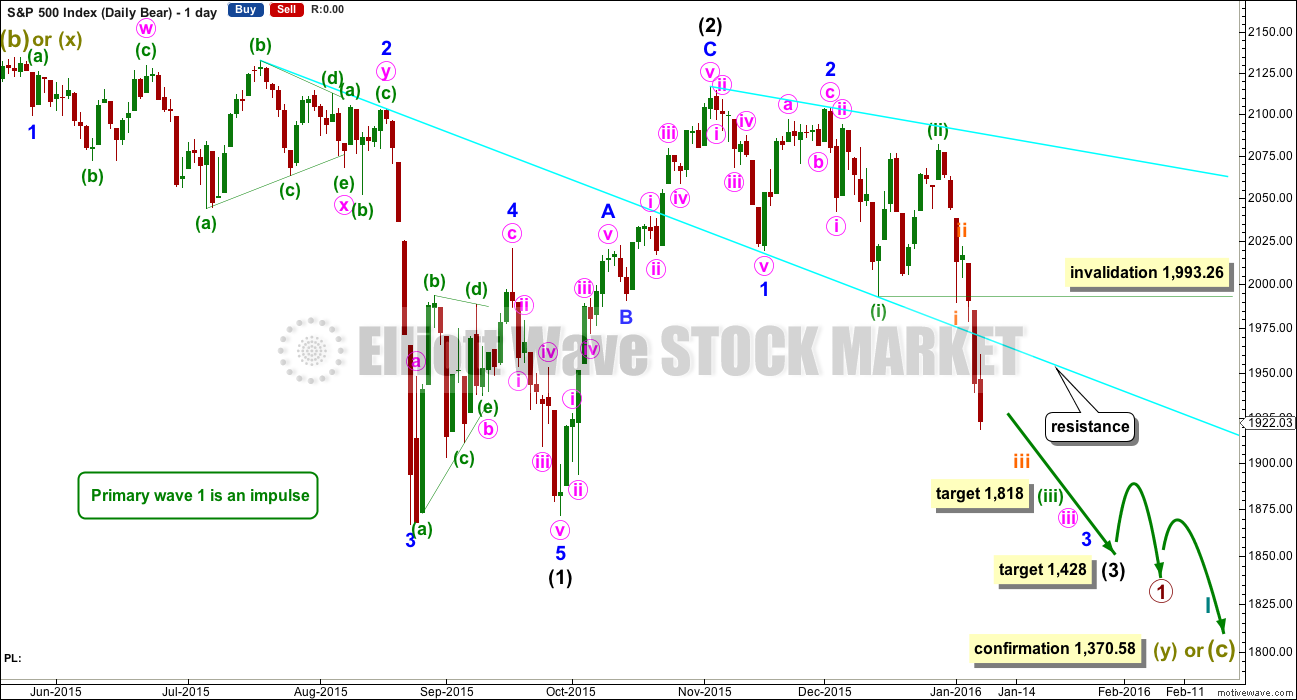
The downwards movement labelled intermediate wave (1) looks like a five. If minor wave 2 is seen as a double flat with a triangle for wave X within it, then the subdivisions all fit nicely.
Ratios within intermediate wave (1) are: minor wave 3 is 7.13 points short of 6.854 the length of minor wave 1, and minor wave 5 is just 2.82 points longer than 0.618 the length of minor wave 3. These excellent Fibonacci ratios add some support to this wave count.
Intermediate wave (2) was a very deep 0.93 zigzag. Because intermediate wave (2) was so deep the best Fibonacci ratio to apply for the target of intermediate wave (3) is 2.618 which gives a target at 1,428. If intermediate wave (3) ends below this target, then the degree of labelling within this downwards movement may be moved up one degree; this may be primary wave 3 now unfolding and in its early stages.
At 1,850 minor wave 3 would reach 2.618 the length of minor wave 1. This first target is removed now because it does not fit with the new target for minuette wave (iii). If price falls through this first target, then the next Fibonacci ratio in the sequence is 4.236 which would be reached at 1,693. If minor wave 3 is very extended, then the degree of labelling for all downwards movement from the all time high will be moved up one degree.
It is still possible (but still less likely) that primary wave 1 is unfolding as a leading diagonal. I will keep that chart up to date and will publish it if and when it begins to diverge from the idea presented here. For now I want to keep the number of charts published more manageable.
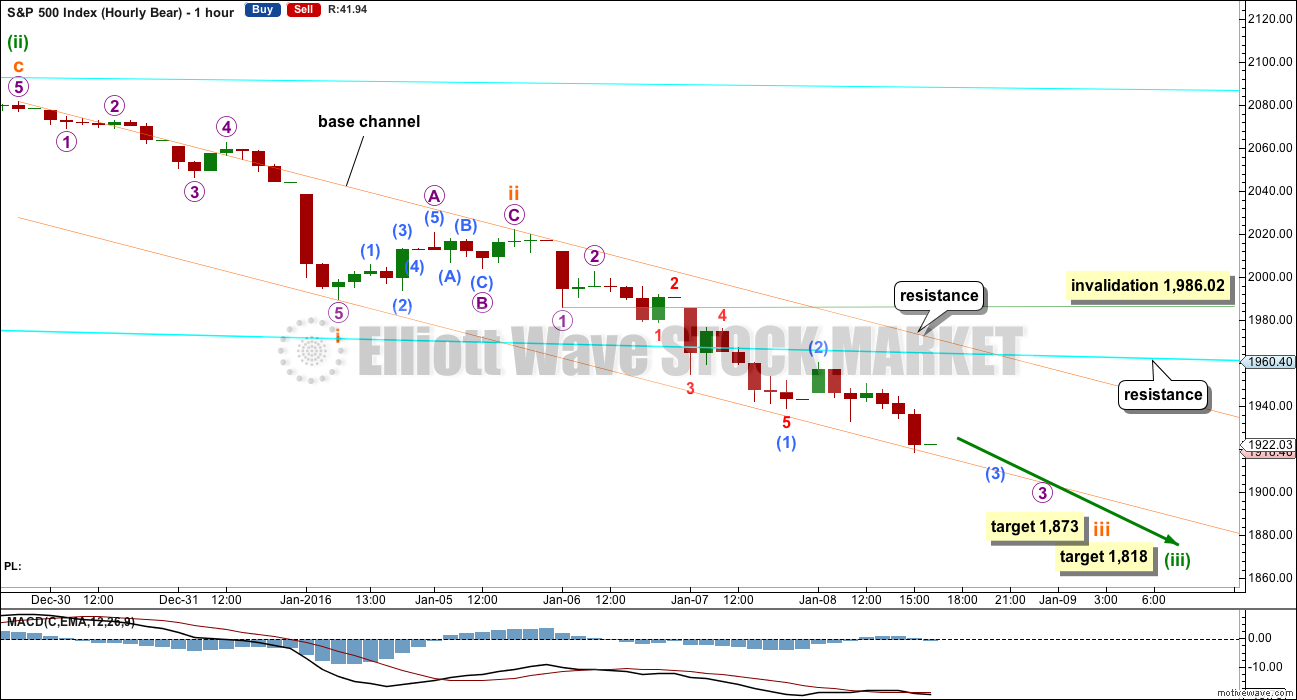
Because downwards movement over the last seven days is strong and supported by volume, it looks most likely that a third wave down is unfolding. Price has reached the first target and the structure for minuette wave (iii) is incomplete, so the next target is the next Fibonacci ratio in the sequence. At 1,818 minuette wave (iii) would reach 2.618 the length of minuette wave (i).
Because minuette wave (ii) was a deep correction of minuette wave (i), it would be expected that the correction of minuette wave (iv), when it arrives, should be shallow against minuette wave (iii). Minuette wave (iv) may not move into minuette wave (i) price territory above 1,993.26.
HOURLY CHART
Click chart to enlarge.
I have worked with different ways to label this unfolding impulse and it is my judgement that this labelling has the best most typical look. It is not the only way to see this impulse so far though; the labelling may change as more structure unfolds.
What is clear is momentum is only slightly increasing so far within subminuette wave iii, which has yet to breach the base channel. Third waves most commonly breach base channels drawn about the first and second wave of the same degree. I would expect the base channel to be breached because this is the middle of a big third wave at intermediate degree.
At their ends, subminuette wave iii and minuette wave (iii) should show a clear and strong increase in downwards momentum beyond their respective first waves. So far momentum is only slightly increasing, so I would expect a further increase, if this wave count is correct.
Along the way down the upper edge of the base channel should provide resistance. This trend line is the line which differentiates this idea and the idea presented for the first hourly chart. If this line holds, then this bear hourly wave count should be preferred.
Micro wave 1 is moved a little higher in this new labelling. Micro wave 4 may not move into micro wave 1 price territory above 1,986.02, but it should not get anywhere near that point. The upper edge of the base channel should provide strong resistance.
Subminuette wave ii shows on the daily chart as a small green candlestick. Subminuette wave iv may also show on the daily chart (but it does not have to). The next very short lived interruption to the trend that may be large enough to possibly show up on the daily chart may be subminuette wave iv.
Subminuette wave iii would reach 1.618 the length of subminuette wave i at 1,818.
Again, if targets are wrong, they may not be low enough. Expect surprises to be to the downside for this wave count.
TECHNICAL ANALYSIS
DAILY CHART
Click chart to enlarge. Chart courtesy of StockCharts.com.
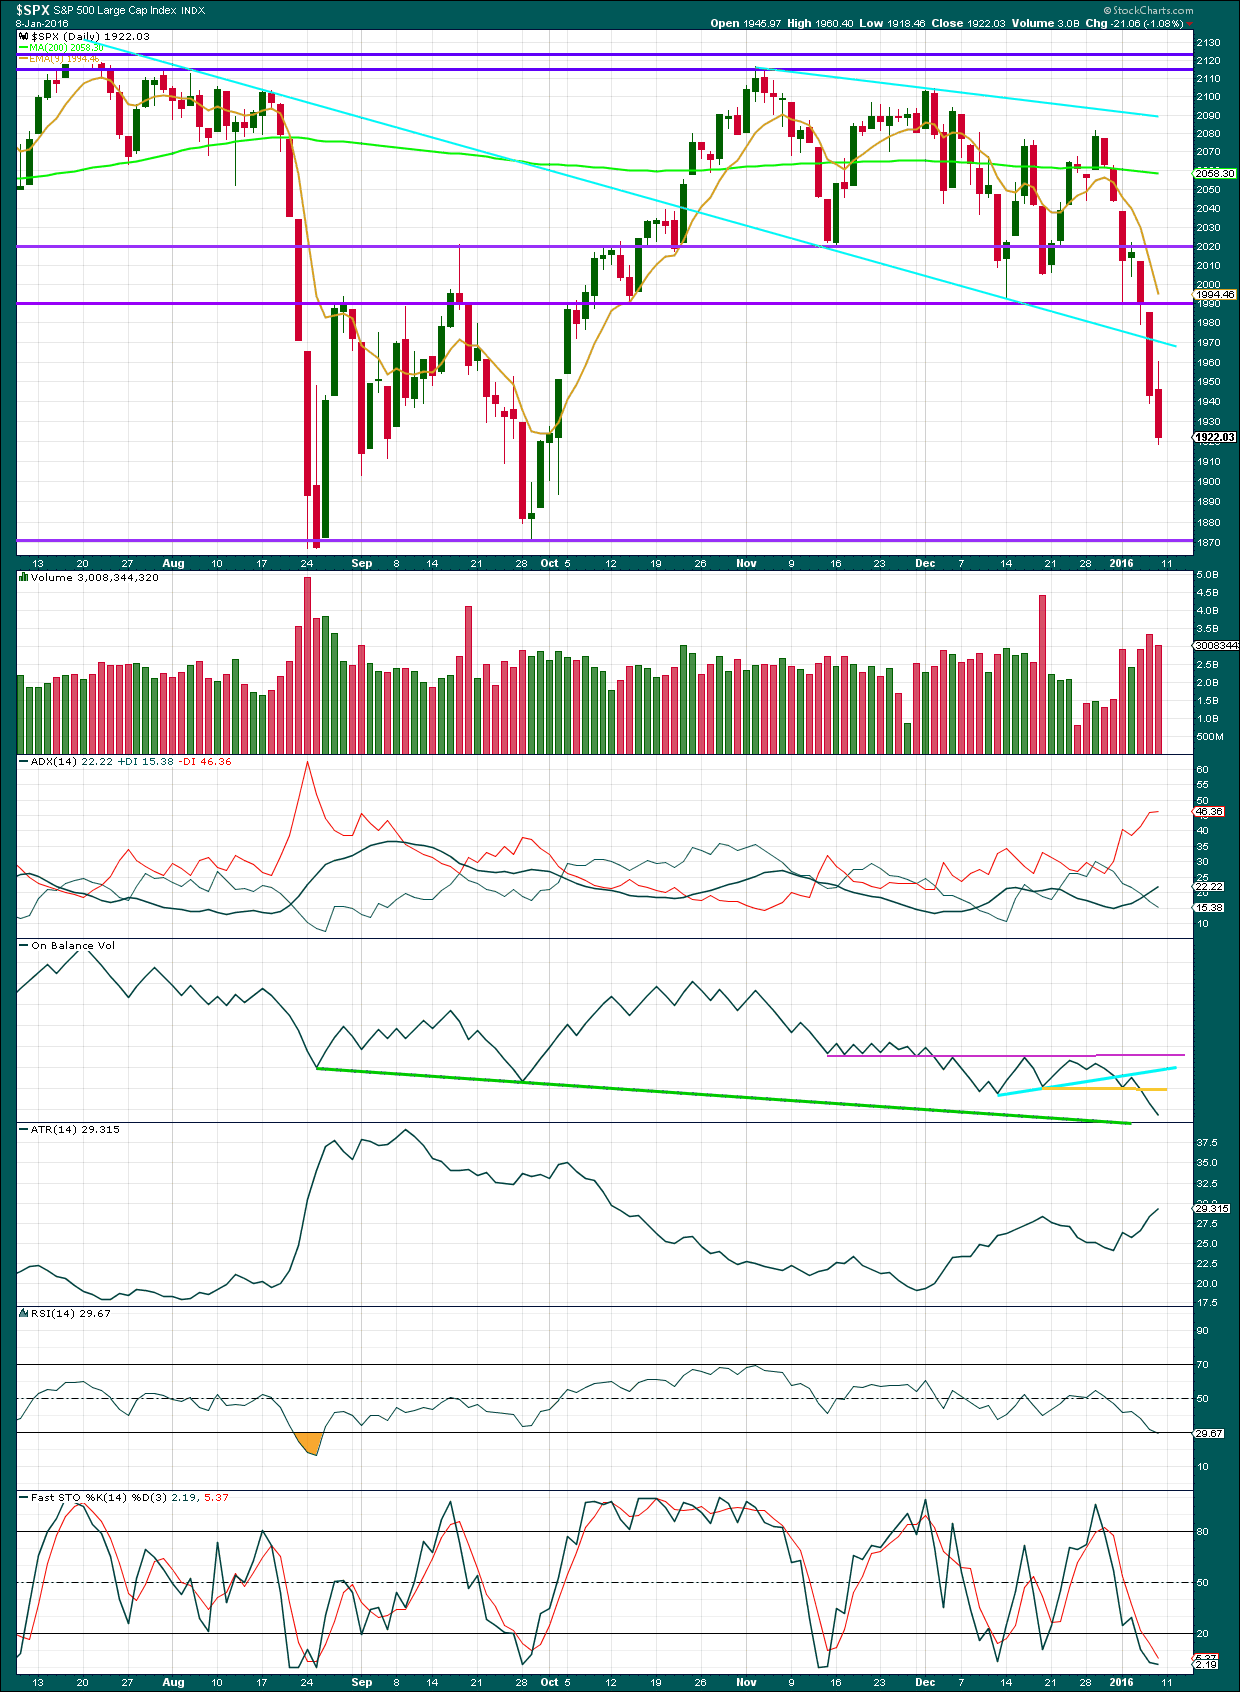
From the last swing high of 29th December, the fall in price is supported by volume. The volume profile is consistently bearish.
Thursday’s strong red candlestick with only a small lower shadow is very bearish. Friday’s red candlestick with a long upper wick is also very bearish; the bulls tried to push price higher during the session but were overwhelmed by the bears who managed to push price lower to close near the day’s lows.
Price sliced easily through the lower sloping cyan trend line. This line may offer some resistance to any larger upwards corrections.
Both ADX an ATR are clear. There is a trend and it is down.
Along the way down upwards corrections may find resistance at the 9 day EMA.
On Balance Volume is consistently bearish. The next possible line of support for OBV is the new green line which is some distance away.
RSI should be watched closely to indicate when this downwards move may be interrupted by a correction. It is just beginning to reach oversold at the end of the week. During the last big fall in August 2015, RSI reached oversold on the 21st of August, yet price continued to fall a little more than a further 100 points to reach the low on the following session of 24th August. This time I would take RSI beginning to reach into oversold as a small warning and watch it carefully, but price could yet fall a lot further. Any divergence between price and RSI would be a strong signal that the fall should temporarily cease. There is no divergence at the end of this week.
Stochastics is oversold but this oscillator may remain extreme for long periods of time in a trending market. Stochastics shows no divergence, so is not indicating a possible interruption to the trend at this time.
This classic technical analysis strongly supports the bear Elliott wave count.
DOW THEORY
For the bear wave count I am waiting for Dow Theory to confirm a market crash. I am choosing to use the S&P500, Dow Industrials, Dow Transportation, Nasdaq and I’ll add the Russell 2000 index. Major swing lows are noted below. So far the Industrials, Transportation and Russell 2000 have made new major swing lows. None of these indices have made new highs.
At this stage, if the S&P500 and Nasdaq also make new major swing lows, then Dow Theory would confirm a major new bear market. At that stage, my only wave count would be the bear wave count.
The lows below are from October 2014. These lows were the last secondary correction within the primary trend which was the bull market from 2009.
S&P500: 1,821.61
Nasdaq: 4,117.84
DJT: 7,700.49 – this price point was breached.
DJIA: 15,855.12 – this price point was breached.
Russell 2000: 1,343.51 – this price point was breached.
This analysis is published @ 01:13 a.m. EST on 9th January, 2016.
Whats everyones opinions, are they trying to clear up the funds of everyone that is short and then going to smash it down very quickly as people get exhausted?
Verne
Oil can go down to 1 penny and nobody cares anymore. As you said all the markets have negatives. But imo they have proven to somehow stall this market not sure how ES Futures but somehow? We had every reason to head lower today but didn’t. Instead we WILL RALLY like crazy probably – crazy I say. Not sure if it will stop either at 1960-70ish or not anymore.
I do think any potential upside is limited. 2000 will be formidable resistance. The banksters have spent a lot of money in an attempt to affect SENTIMENT. With global markets imploding, I think the bulls are going to be tentative and the move is going to be shallower than in the past. We have after all been consistently making lower highs, and there has not been more than three days of up moves for quite some time. The bottom falling out is also STILL a distinct possibility…nothing would surprise.
I intend to keep aggressively shorting rallies- it has been the right trade for ten weeks now…
makes sense.
Verne
If futures head lower we make a new low and reverse and i am making a huge call now.
1975-1980 by WED-Thurs and turn around reverse to head lower…
laters…
Right now I am content to just observe options; I frankly have no idea what is going on with the current market action and it makes little technical sense to me.
As they say, the market is never wrong so we have to just be prepared for what it throws our way….
k cool.
So, when I do my analysis I focus on the Elliott wave counts first and then do my classic technical analysis after StockCharts has volume data finalised. Because volume analysis is a big part of my classic TA.
I have found slight divergence at the end of this session between price and RSI, and between price and inverted VIX.
Those two indications along with a lack of increased momentum and a lack of breach of the base channel are enough for me to close my short position. I’m out.
I don’t necessarily want to favour the leading diagonal / deep second wave correction, but the probability of it is high enough for me to take profits now.
Analysis is being proofed very shortly and will be published soon.
The reversal of both VIX and UVXY after this magnitude of a decline with no spike to speak of is something I don’t recall ever seeing previously. Is this the way super cycle bear markets begin…with nary a sign of alarm after a thousand point plunge in DJI?! These are really uncharted waters. Either we are in for one heck of a bounce over the next week or two, or what happened today has to be the mother (really, unprecedented) of all head fakes…not sure which but we will know tomorrow I expect…
some people are looking for a 3% move in 1 day. markets have buyers and sellers. This is only buyers here.
I took another look at Lara’s labels for the bear count since the high labelled intermediate two. It is noteworthy that in the impulse down labelled minor one, minute five seemed to exhibit quite a bit more momentum than did minute three and I remembered how some of us commented on how sluggish that third wave down appeared. Could we be seeing a similar set-up for the current downward movement…? There is after all a fractal nature to the market. If today was a fourth wave correction and not the start of a more sustained upward move, and what happened with minor one down is repeated, tomorrow would then be the strongest move for a fifth wave down. This would also be a game changer for UVXY as it would not spike for the third wave at higher degree but for the fifth. It also did something entirely out of character as well at the August low and did not spike until the middle of the fourth wave and just prior to a truncated fifth. This market is as slippery as an eel and doing and outstanding job of keeping traders off balance; no doubt thanks to banksters at work…messin’ with the flo’….
To be honest I really am not sure what to think anymore.
I try to be open with everything but not only did the market reverse in just the last hour it made one crazy hammer.
I don’t know if any of the research I did on corrections is valid or if I even know about historical 20% corrections at all.
I am now going into a spiral of doubt and what if’s and the market is doing the opposite of what I think.
The only thing now is I have to stay positive on a bearish outcome I guess! Somehow!
The transports made a new 52 week low today. Other measures of global economic activity( Baltic Dry Index) are at multi-decade lows. There is in my mind absolutely no doubt about the bearish count.
The perplexing question is what is going on in the near term. While it certainly will not change the ultimate outcome, there is clearly a furious amount of bankster buying going on. They again spent billions overnight buying the futures from deep in the red. This is why we diverged for Europe and China. When this thing finally breaks, there will be no stopping it, I don’t care how many billions the banksters throw at it. The trend is down, and will be for quite some time I think…ALL “rallies should be vigorously shorted IMHO…
K – well in that case
Let’s go bears!
I was looking for a massive down January so I could spend more time as a responsible uncle and take the kids to toys r us.
But I’m sure mr crazy market doesn’t care what I think :/
The real reason I was looking for a huge down January as well was we grinding sideways for NOV-DEC 2015. To grind sideways for 3 months is just to much imo…
I completely agree.
When I step back and look at the larger picture, and look at the other indices (globally) the picture is extremely bearish.
I am confident the bear wave count is correct and that we are in the VERY early stages of a strong bear market. We are close to the beginning and close to the price high.
It is the near term picture which is unclear. What pathway will price take along the way down? When will sharp violent reactions occur? How high can a dead cat bounce?
We need to be nimble and consider all information, weigh it up and make our own calls every day.
good point…
it is amazing how 1 trading day can make someone forgot about the big picture…
The transports made a new 52 week low today. Other measures of global economic activity( Baltic Dry Index) are at multi-decade lows. There is in my mind absolutely no doubt about the bearish count.
The perplexing question is what is going on in the near term. While it certainly will not change the ultimate outcome, there is clearly a furious amount of bankster buying going on. They again spent billions overnight buying the futures from deep in the red. This is why we diverged for Europe and China. When this thing finally breaks, there will be no stopping it, I don’t care how many billions the banksters throw at it. The trend is down, and will be for quite some time I think…ALL “rallies” should be vigorously shorted IMHO…
Hi
All
I’m really confused now. 2,104 back on deck ????
Bull market lives on after only 1 up day of 1.6 points ? Another year ??look for it to grind sideways ?
hi
all
i thought corrections are fast? We moved down -10% and now go up potentially for 2 weeks just for +2-4%? I dont understand how the math works. I looked at some recent 20% corrections in the past and they resolve faster than that. I really dont understand that.
Am I just not understanding how stuff works even with historical chart reference of 20% corrections?
Ideas anybody?
Hi
all
a second wave bounce before the third wave down? A-B-C?
market going up on short coverings?
2 updated paths in my view…
1950 terminate
or
1980-2000 then terminate
to correct over sold indicators….
This might be a forth wave of a lower degree…I do think the fifth wave of the wave that we are in is still out there…then we are going to have a more meaningful forth wave up. I do think this forth wave is going to be brief IMHO.
I am sure Lara is gonna have some good road maps for us to guide us
k thanks
I guess if we were correlating with China we be down 5% or higher…
By correlations I didn’t mean economic fundamentals or a market leader.
Correlations meant, well, correlation: “The correlation is one of the most common and most useful statistics. A correlation is a single number that describes the degree of relationship between two variables.” direct copy paste from internet
Historically US markets correlate well with Germany’s DAX. Not today, not yesterday, not for one week…for years
Jack
Jack
i agree on correlation. i only want to add that a bounce across the GLOBE during a correction could in fact happen and that is mostly likely – precisely what we are seeing here for a few days…
Just look at the moving averages on the daily charts – they are breaking lower….
If the market does not break to the downside prior to the close, a bounce may be in the works. The pattern has been for the steepest part of the decline to come close to the close so that may hold today. I too am a bit concerned about a lack of increasing momentum to the downside. A middle of a third wave should be accelerating to the downside, not aimlessly meandering as we have today….for those of us on the short side, let’s hope this is the calm before the storm…added a few upside hedges…
We’ve just blasted out of the top of the base channel of the move up from todays lows.
Below 1905.24, proves this move corrective – for now it looks like we are in a small degree 3rd wave up with waves 1 and 2 complete from todays lows.
I’m currently favouring that this move is impulsive and will end up being a 5 wave move off todays lows
Quite a bit of divergence with RSI on that last poke higher – below 1917.22, this last move from 1905.27 is either an extending wave iii or this last blast up was just a scary wave c corrective move.
if the move is an extending (small degree) wave iii we should get a (very small degree) 3 wave structure to the downside before blasting higher in a iii of (iii) without falling below 1905.27
If we now go above 1928.09 without there being a 5 down, I’ll be long the market with a stop loss at 1905.27.
This very small move down is currently a 3 wave but it might only be wave a of an abc.
EDIT – I was watching the market so intensely I didn’t even notice we closed!! Wondered why my S&P chart stopped moving 🙂 !!
Until tomorrow!!
Hard to say how high this bounce will go. We clearly have not had anything even close to capitulation- not according to how VIX and UVXY traded today. Long upper wick on UVXY would normally be bullish in the short term but there’s an awful lot going on behind the scenes in this crazy market. Another close inside the upper B band tomorrow means the short and medium term decline has been successfully interrupted.
Yep – was very poor.
I had rotated into VIXY, but was on edge all day so ended up selling all the way down into todays low – RSI just didn’t stack up on that final move down. Had a feeling that the floor would fall out and leave me behind but didn’t happen this time for a change.
I’ve sold everything right now – worse case for me would be to have a large opening gap down tomorrow, so that’s what will probably happen.
Thinking about Lara’s comment on stop loss below…. VIX products are great in and around the end of wave 3’s but on days like today, they take back alot more than the S&P move would warrant – as if someone knows exactly what is coming next and drives vix disproportionately lower (no suprise there). That gives much less flexibility to sell at higher stop losses, than can be afforded by a simple tracking ETF so places alot more pressure on me to get out ASAP.
I would love to set my stop loss at the same level as Lara, but I would possibly suffer huge loss of earlier profits. Makes me think that I would maybe make more money in the long run trading simple S&P ETFs until the big one actually shows up.
Ditto you all with concern. I am thinking the diagonal is what will fool / hurt the most people. I closed my positions earlier today and have been flat since. Too many times I have left profits on the table.
Now I am looking for clues that we will have a strong up move to the tend lines and targets of the diagonal.
The lower edge of the channel is being overshot by this current hourly candlestick.
If price can now manage to properly breach it and remain below it at the end of this session (another two hours) then I’d have more confidence in the hourly bear.
But if price can’t manage to move below that line and it bounces up at the end of this session then the probability of the hourly bull ending diagonal scenario will increase.
Both remain valid.
Based on my view as well today was not as impulsive as I would like but I remain bearish as we are now sitting near the lows. I am concerned about momentum. Not really sure what to make of it.
oops – now we seem to be moving only a few points higher..
Lara,
Did you mean the leading diagonal idea in the hourly bull count? Also, can this leading diagonal concept work for the bear wave count, as well?
Thanks,
Peter
I might be wrong, but I think Lara is cautious that we might have just finished wave 1 down with an expanding diagonal (bear wave count) and if so we will likely have a *very* deep upwards correction for wave 2.
Either way the odds are good that the main trend is down, but if this is wave 2 up after an expanding diagonal, it will still wipe out a good chunk of your account (if you are short the market).
I’m neutral market now so personally it would be a gift for the market to provide another opportunity to short the market at a much higher level than today. For that reason alone I am cautious it won’t happen
That’s why I’m setting a stop just above my base channel on the hourly chart. I won’t get all of the movement, but that way I get the middle. I missed the very beginning and I’ll miss the very end.
But getting the entirety of a movement is just greedy I think. A safe and reliable option is to get the middle. And that’s what I’ve got. I’m satisfied.
And by not closing out today I leave the possibility of getting a bigger middle if the hourly bear is correct.
hi
Olga
“it would be a gift for the market to provide another opportunity to short the market at a much higher level than today. For that reason alone I am cautious it won’t happen”
So you mean you really dont think we can go up for another nice short opportunity?
It’s possible that we could – price will be the ultimate decider of that.
But to do so would make me very happy, and the market is not in the business of making me very happy 🙂
Yes. The ideas presented for hourly bull and hourly bear work in exactly the same way for both wave counts.
I am really concerned this morning about the lack of a strong increase in downwards momentum for this third wave.
Price is moving lower nicely. But momentum on the hourly chart for subminuette iii is not yet substantially and clearly stronger than subminuette i. It is stronger, but only just.
I will keep the ending expanding diagonal idea as that explains momentum very well indeed.
So please be aware: the scenario on the bear hourly chart of a huge third wave is still preferred and likely, but today I have a slight doubt over it. Expect surprises to be to the downside for this idea.
The scenario on the hourly bull is still possible today. Use the upper edge of the channel as the delineation point between the two ideas.
I’ve moved my stop down to just above that line to protect profits. I want to hold my short while the hourly bear is still preferred. If that line is breached I’m out.
What I want to see tomorrow for the hourly bear is the lower edge of that channel breached and a strong increase in downwards momentum. If that happens I’ll discard the ending diagonal idea and have confidence that this thing should rocket off lower and be even stronger.
Lara–very nice to hear your trades.
New low coming on the ES 60
The last line is important
6% next? not much data
Nice trend line John. Thanks. I’ll add that one to the analysis.
It’s that last swing low of October 2014 in the bull market that I’m using as my price points for Dow Theory confirmation.
Well spotted. Yes, I would expect a bounce from there for at least a day.
But then….. bear movements can sometimes just slice right through support as if it wasn’t even there. Surprises.. to the downside.
Interesting VIX read http://www.seeitmarket.com/market-volatility-divergence-hints-at-binary-outcome-next-week-investing-15168/
Thanks. Good article.
John and Verne,
What a chop fest. At the moment it seems like it wants to head lower but can’t right?
uh oh we are going down… it can’t bounce
I don’t get it either. Oil add fuel to the fire but market wants to hold. I’m not liking this move at all.
Zalomoon
Good day – nothing to think about in my opinion -stay alert. It is GOING DOWN. Its not worth waiting for. trade or invest at your own risk and stay safe matey!
bounce should be 2-3 days – i can’t predict that – but my opinion.
hi
All,
What is holding this market up so far today?
Ignore TNX. I have this watchlist. You might want to consider loading this up for information only…
It gives a good bird eye view…
We got to wait for the close…
Verne
In my experience with VIX at these levels you can expect +1.5% swings. It is painful but it is what it is. The trend is down so let it shake out the weak hands. Tech and Finance are driving price today(only like 10 companies lol)
Vern–how high do you anticipate UVXY will spike?
“Look at UVXY; it will tell you when to take profits on downside”
“There is also an almost universally strong built in expectation that the market is going to bounce the second we take out last August lows and men and machines are all salivating at the prospect and poised to jump in at that level”
Ordinarily, taking out the August lows in the equity indices SHOULD lead to a UVXY high over 93 but these leveraged ETFs, like everything else in the financial market are run by banksters so one has to be careful; it’s possible it may not get that high. Look for TWO closes back below the upper B band for a probable reversal.
China is now in a primary third wave down and is going to have a far larger impact on the US markets than most people anticipate; to think that we are somehow de-coupled from them I think is a mistake…they have in fact been telegraphing what’s in store for the US markets…
Vern–thanks, always appreciate your view and comments on UVXY- -a rare combo of technical analysis and experience in a unique product.
exactly matey…
Cesar tells me he read an article which did an inter market analysis of correlations and found the Singapore index is a leader currently.
I’ll ask for a link and publish it here.
The absence of fear in this market is amazing. The DJI is down over 1000 points since the start of the year but the selling intensity remains muted. I expected a gap up at the open this morning for UVXY and it did not happen, thanks to the banksters trying to lull everyone to sleep with their futures gamesmanship.
All very bearish indeed. The fear WILL come…it always does…
Possibly because much of market these days is computer driven so there is limited rational human concern, capitulation (fear) will kick in at complex algorithmic indicators ?
You may be right about that. I think that is what produced that monster lower wick at the August low.
Clarification of my above comment. I in no way discount EW position on investor psychology but hold to the possibility that technology (computer high frequency trading) might be “buffering” investor energy–but ultimately the wave will prevail.
T2108: If the 15% area holds , SPX will bounce you can see the behavior in the weekly candles : As I type it is at 14.50%
This is the perfect place for machines to make their money
k John thanks. projected level?
The first serious resistance looks like the red S/R line
yeah looks like this is going up.. No big deal should be short lived 1-2 days.
or not. Tricky day…
So ranged bound today. Maybe just a breather before the big move to catch people out as they get fed up
its heading lower at the moment
Verne
Do you see a bounce or this a head fake?
Look at UVXY; it will tell you when to take profits on downside…
k thanks
i wonder why uvxy is up?
but VIX down?
Can you explain that phenomenon?
do you see a clear 5 wave down know on the 1 hour after the weekend action?
Do you mean wait for an upwards UVXY spike?
Yep. A combination of ongoing central bank buying and persistent bullishness in the market leading to choppy action to the downside. There is also an almost universally strong built in expectation that the market is going to bounce the second we take out last August lows and men and machines are all salivating at the prospect and poised to jump in at that level. This kind of sentiment powerfully augments the bearish case IMHO. What we are seeing is a decline down the “slope of hope” VIX reflecting near term bullishness on the part of the crowd. The heavy hitters are trading UVXY….they know what’s coming….
i agree…
Cincuenta and Jack,
The 1975 – Robbers
https://www.youtube.com/watch?v=JS9ZJ–01aw
Cool song dude
There is a direct correlation between US markets and Germany – DAX – futures are correlating to DAX; correlation to Chinese markets is minimum (almost nonexistent)
How about some sleep – Lets get some sleep
I agree but sometimes it’s disconnects from dax
We might swing 2-3 days up!
Stinks!
ES. uh oh…. I am shutting down. See you all in the AM.
ES range. Does it go down into the open? Time will tell…
no jinx..
Oil is getting crushed. Not sure how the ES futures are back slightly into the green..
Markets…
Cincuenta and Jack,
Just to keep the analysis on the markets going…
One great song …
https://www.youtube.com/watch?v=0PiKAtyIMjc
Great, thank you
10 handles down at the open
Is it a sit and just wait strategy now?
Hi
The trend is down so Manage risk and Keep it simple.
Futures only mean something if it persists into the cash open.
Just my opionon /
You really should have a plan that fits your risk style.
It’s all about the close of the day. That is what counts.
Thanks
T2108 measures stocks over their 40 DMA: It is below 15% , which means less than 15% of all stocks trading on the $NYSE are below their 40DMA.
T2109 measures % of stocks over the 200 DMA
Looking at possible support lines
closer look
Thanks John,
I am really leaning to the lower range of 1800 and possibly to 1780-1750.
Just like Aug when the futures went down to around -120ish points.
Here we could so a span of over a few days.
Everyone is so convinced we will jump back at 1867. That is so bizarre on twitter finance.
Correction!
T2108 measures stocks over their 40 DMA: It is below 15% , which means less than 15% of all stocks trading on the $NYSE are ABOVE their 40DMA.
T2109 measures % of stocks over the 200 DMA
Options, Yes this could get really ugly!!!!
hi
All
Isn’t it amazing how the BULLS are so sure this market will bounce at the next support level? Just amazing how everyone is so confident in this market and how it works. This should be a big red flag I think. Just like when we got to SPX 2,116 everyone(I even got tricked as I temp gave up but jumped back on the horse being short thankfully) was so SURE we would hit NEW HIGHS but we all know it didn’t happen. Interesting week coming up for sure. Till Monday!
Regards,
Verne
This is also a possibility even with RSI hitting extremes matey, I went back to 2001:
Chart Summary:
PRICE FALLS FOR 9 days and only has 1 up day but total down -17%
Just to put into price target only. The equivalent for us is around 1630 from Fridays close of 1922….
North Korea has not been resolved as a geo political issue…
laters…
Verne,
This could be the setup matey!
Potential Chart Summary:
1. Decline an additional:
-7% to 1820-1800
2. Bounce up +3%
around 1880.
3. Delince about -8%
to 1730
no jinx…
Verne
I am also trying to understand the 3rd wave structure in more detail. So, correct me if i am wrong we are in the middle of the 3rd of the 3rd. Typically there are 5 subdividing waves within the 3rd wave. If we reach 1818 area what would the wave count be? 3rd of the 3rd or the beginning of 4th of the 3rd?
Thanks Matey!
I know this was directed to Verne, but I’ll answer too.
We are almost at the middle of the third wave.
It’s fractal. Like a set of Russian dolls. We have the smallest submicro (3) needs to pass its middle Monday or Tuesday, most likely Monday.
Then the next one up micro 3 has to end. And so on up to the largest intermediate (3).
As each third wave ends it will be followed by a fourth wave correction of the same degree, then a fifth wave of the same degree completes the third one degree higher.
Each third wave must subdivide as an impulse meeting all the EW rules for it. An impulse is made up of five waves.
At 1,818 we will have only minuette (iii) complete. Then a correction for minuette (iv) should begin, its counterpart minuette (ii) you can see on the daily chart so minuette (iv) should be a few days in duration.
The upcoming fourth waves may be more brief than the second waves were though.
Thanks Lara..
Great answer!!
Verne
I am trying to understand something more clear – maybe you can help me expand on that.
IF we breach the S&P500: 1,821.61 and Nasdaq: 4,117.84
and the RSI is reaching maximum oversold like Aug 2015 when we hit 1867 Area. Can we keep on dropping and how far have you seen RSI get before it MUST turn? You see why it is tricky?
Verne
I went back to year 2000 in more detail. Check out my analysis on the oversold RSI.
I do realize past is not the future but this is one of the greatest bull markets ever so we should compare it accordingly.
Chart Summary:
1. Once RSI hits 30 then delcline about 4 days around -6% to hit RSI 15 oversold.
2. Bounce for 2 days to relieve RSI. Index moves only +4%
3. Decilne after 2 day bounce down approx -6%
Feedback matey!
I don’t think there’s any maximum point where it must turn.
It’s just a strong warning.
I’ve noticed if it shows divergence with price, even between two consecutive days, that is a very high probability sign that the move in price will stop there.
The divergence doesn’t need to be much either. It can be slight. Almost every time that happens price stops.
Ok ditto, I am just trying to understand the best probabilities for a turn around. I have been there so so many times down on the sell off last days and then magically reversed and just wiped me out in 1-2 days later. So, I am learning to get out when it is clear.
Thanks Lara! I am definetly brushing up my skill sets…
Thanks Lara. Your videos are always quite helpful.
If one looks at the DJTA, one is able to see the subdivisions / count a bit more clearly. It definitely confirms the bear count on the monthly, weekly, daily, and hourly time frames. The same is true if one looks at the RUT, the NYA, and the Wilshire 5000. The middle of a large 3rd wave seems apparent to me on all these time frames. The bull triangle count is just not possible on these major indexes. The bull leading diagonal counts on these indexes, if possible, are calling for much more downside as well.
I am thinking the small stocks are leading and the larger which make up the SPX 500 are following. If correct, the bear count calling for a move to 1818 is right on or still too high of a target.
Added to all this is the fact that the global markets are all participating in the bear route.
Well, these are just some of my observations and thoughts.
Thanks again. I have learned so very much from you. Have a great weekend.
Rodney
Rodney my suspicion is that Lara would concur fully with your observations (as do I). Her inclusion of other possible wave counts, even ones of lower probability, is I think part of her commitment to being thorough and objective in her analysis- to account, in her words, for the “what if…” scenarios. 🙂
Yes, and that is very valuable.
Rodney
This past week the RUT lost near -8.3%. Look at that weekly candle – just massive.
You’re welcome.
I agree. The bullish triangle count won’t work for DJT or Russell. It would still work for DJIA and Nasdaq though. And they all would have somewhat different wave counts in that the correction would be structured differently.
DJT has moved the most downwards so far. It seems to be leading. I’ve just noticed a nice trend line it’s just come down to touch also.
Thank you Lara.
Superb analysis as usual Lara. You have a rare gift for clarity and thoroughness and that is so deeply appreciated by all your members. Thank You!
(UVXY bands just starting to expand and also suggesting strongest move just ahead)
Thanks for the added piece of info re UVXY bands. That adds a little more confidence.