
Again, there are three possibilities for downwards movement from the last major swing high of 3rd November.
Again, I have three daily charts looking at three possibilities.
Summary: A downwards trend is still in place. The preferred bear wave count expects a big third wave is in the early stages. The final invalidation point is at 2,116.48. The target for this third wave is at 1,428. In the short term, a second or B wave is incomplete, which may end when price finds resistance at the short term orange channel on the hourly chart. When the short term cyan trend line on the hourly chart which is providing support is breached to the downside, then the downwards trend may have resumed.
To see how each of the bull and bear wave counts fit within a larger time frame see the Grand Supercycle Analysis.
To see detail of the bull market from 2009 to the all time high on weekly charts, click here.
Last published monthly charts can be seen here.
If I was asked to pick a winner (which I am reluctant to do) I would say the bear wave count has a higher probability. It is better supported by regular technical analysis at the monthly chart level, it fits the Grand Supercycle analysis better, and it has overall the “right look”.
New updates to this analysis are in bold.
BULL ELLIOTT WAVE COUNT
DAILY CHART – COMBINATION OR FLAT
Click chart to enlarge.
This wave count is bullish at Super Cycle degree.
Cycle wave IV may not move into cycle wave I price territory below 1,370.58. If this bull wave count is invalidated by downwards movement, then the bear wave count shall be fully confirmed.
Cycle wave II was a shallow 0.41 zigzag lasting three months. Cycle wave IV should exhibit alternation in structure and maybe also alternation in depth. Cycle wave IV may be a flat, combination or triangle. The two daily charts look at these three possibilities.
Cycle wave IV may end within the price range of the fourth wave of one lesser degree. Because of the good Fibonacci ratio for primary wave 3 and the perfect subdivisions within it, I am confident that primary wave 4 has its range from 1,730 to 1,647.
If a zigzag is complete at the last major low as labelled, then cycle wave IV may be unfolding as a flat, combination or triangle.
Primary wave C should subdivide as a five and primary wave Y should begin with a zigzag downwards. This downwards movement is either intermediate waves (1)-(2)-(3) of an impulse for primary wave C or minor waves A-B-C of a zigzag for intermediate wave (A). Both these ideas need to see a five down complete towards the target, so at this stage there is no divergence in expectations regarding targets or direction.
Primary wave A or W lasted three months. Primary wave C or Y may be expected to also last about three months.
Within the new downwards wave of primary wave C or Y, a first and second wave, or A and B wave, is now complete. Intermediate wave (2) or minor wave B lasted a Fibonacci 13 days exactly. At 1,850 intermediate wave (3) or minor wave C would reach 2.618 the length of intermediate wave (1). At this stage, this will be the sole target for this third (or C) wave to end as it fits better with more short term targets calculated at the hourly chart level.
No second wave correction may move beyond its start above 2,104.27 within intermediate wave (3) or minor wave C. This invalidation point allows for the possibility that there may be a leading diagonal unfolding for a first wave down. Leading diagonals in first wave positions are often followed by very deep second wave corrections. When the structure of minor wave 1 is complete, then a deep zigzag for minor wave 2 would be expected which may find resistance at the upper cyan trend line.
DAILY CHART – TRIANGLE
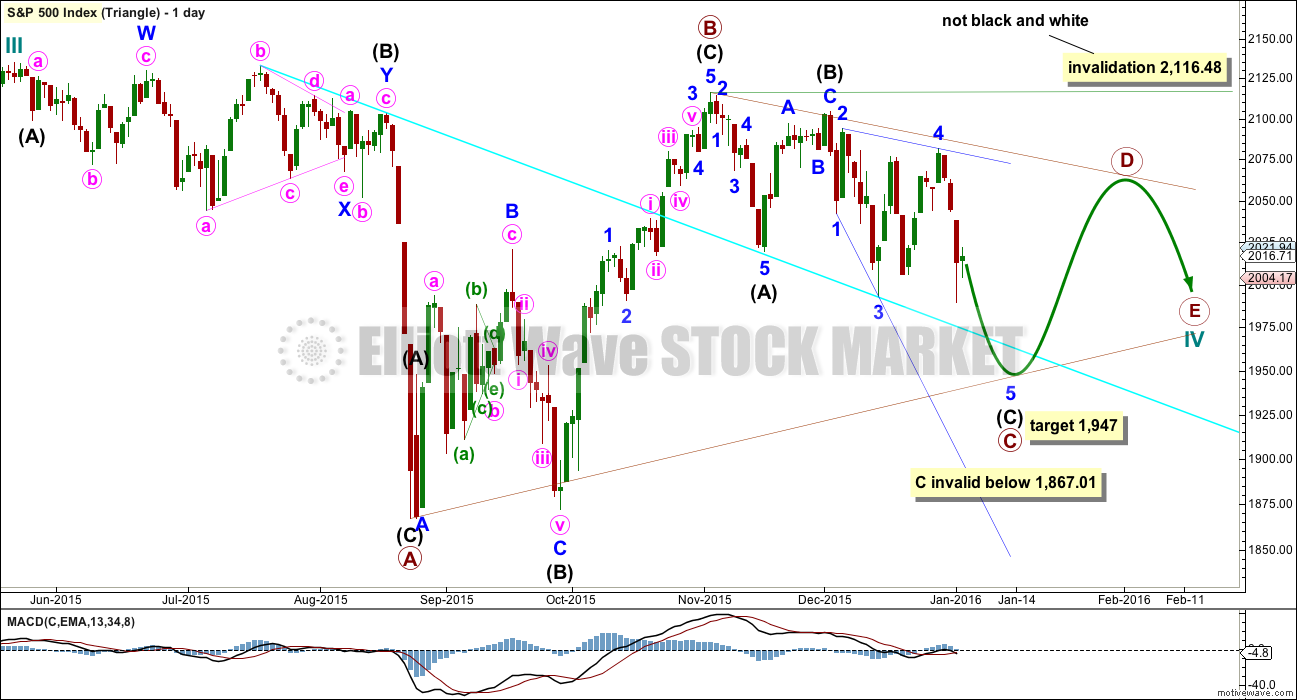
Click chart to enlarge.
Cycle wave IV may unfold as a shallow triangle. This would provide alternation with the 0.41 zigzag of cycle wave II.
The triangle may be either a regular contracting or regular barrier triangle. An expanding triangle would also be technically possible, but as they are the rarest of all Elliott wave structures I would only chart and consider it if it shows itself to be true. Prior to that, the probability is too low for consideration.
Primary wave B would be a complete zigzag. The subdivisions all fit and now it has a clearer three wave look to it.
Primary wave C should unfold downwards as a single or double zigzag. So far it may be a single zigzag, with intermediate wave (C) unfolding as an ending expanding diagonal. At 1,947 intermediate wave (C) would reach 1.618 the length of intermediate wave (A).
Primary wave C may not move below the end of primary wave A at 1,867.01. This invalidation point is black and white for both a contracting and barrier triangle.
When primary wave C is complete, then primary wave D upwards should unfold as a single or double zigzag. For a contracting triangle, primary wave D may not move beyond the end of primary wave B above 2,116.48. For a barrier triangle, primary wave D should end about the same level as primary wave B at 2,116.48. The triangle would remain valid as long as the B-D trend line remains essentially flat. This invalidation point is not black and white. This is the only Elliot wave rule with any grey area.
Thereafter, primary wave E downwards may not move beyond the end of primary wave C.
The whole structure moves sideways in an ever decreasing range. The purpose of triangles is to take up time and move price sideways. Price exits the triangle in the same direction that it entered, in this case up. When the triangle is complete, then the bull market would be expected to resume. This triangle should take several months yet to complete.
HOURLY CHART
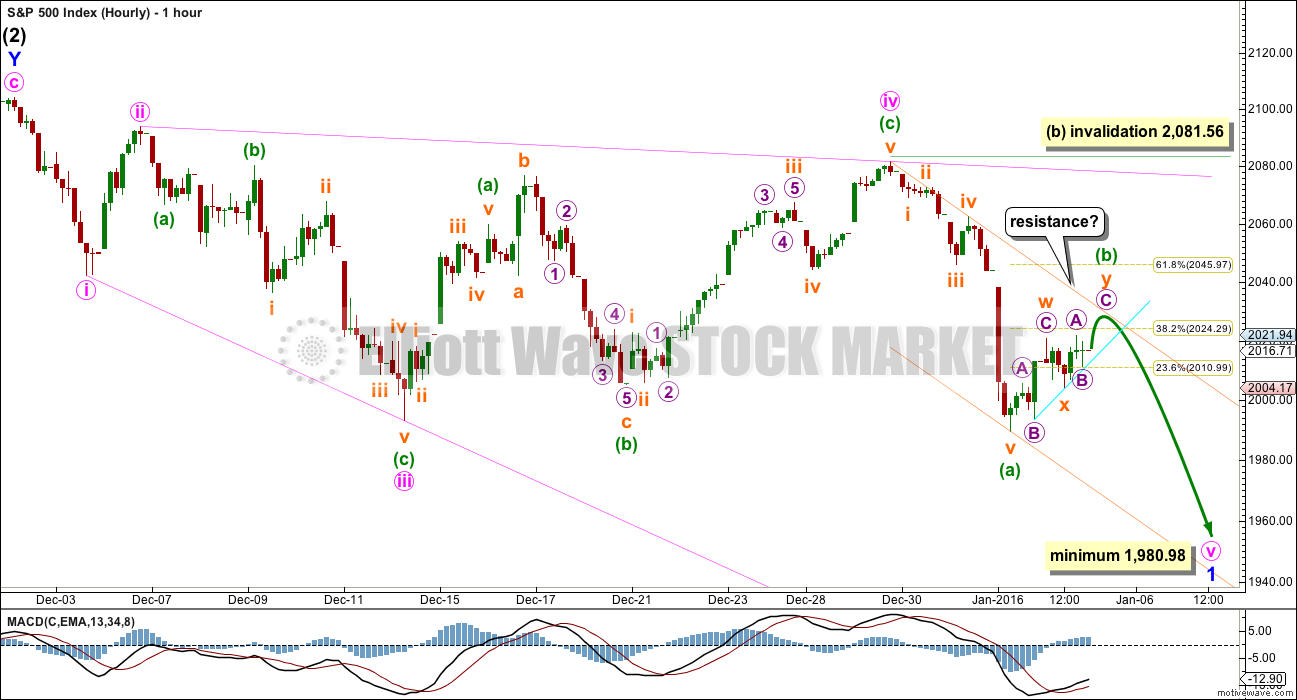
Click chart to enlarge.
This hourly chart follows on directly from the labelling of the main daily chart and shows all movement since the end of intermediate wave (2) as a possible leading expanding diagonal.
The final fifth wave of the diagonal is underway. It is most likely to subdivide as a zigzag.
The small green daily candlestick for Tuesday would make more sense if it is wave B within the zigzag and not a fourth wave within wave A as labelled yesterday. Because it shows up on the daily chart and subminuette wave ii did not, this is more likely to be minuette wave (b).
Minuette wave (a) will fit as an impulse with an extended fifth wave. This looks like an impulse more typical of commodities than the stock market, but sometimes the S&P does exhibit swift strong fifth waves.
Ratios within minuette wave (a) are: subminuette wave iii has no Fibonacci ratio to subminuette wave i, and subminuette wave v is 3.88 points longer than 2.618 the length of subminuette wave iii (this difference is less than 10% of the length of subminuette wave v, so I consider it close enough to be an acceptable Fibonacci relationship).
Minuette wave (b) may be any one of a possible 23 corrective structures (if all possible triangles and combinations are taken into consideration). Of all Elliott waves, it is B waves which are the most difficult to analyse and low degree B waves should never be traded. They exhibit the greatest variety in form and structure, and tend to be the most time consuming and complicated of all movements.
At this stage, minuette wave (b) may be an almost complete double zigzag as labelled. It may find resistance at the upper edge of the channel drawn about minuette wave (a). If it breaks above the upper edge of the channel, then look for it to reach up to the 0.618 Fibonacci ratio at 2,046.
It is also equally as likely that minuette wave (b) is only just beginning. The degree of labelling within it may be moved down one degree, so this may be only wave A of a more time consuming flat correction or triangle for minuette wave (b). The only thing which would eliminate this idea as a clear five down on the hourly chart.
So far upwards movement is finding support at the short term upwards sloping cyan trend line drawn along the lower edge of minuette wave (b). When this cyan trend line is breached by downwards movement, then it may be earliest indication that minuette wave (b) is over.
Because the diagonal for minor wave 1 would be expanding, the final fifth wave of minute wave v must be longer than equality in length with minute wave iii. At 1,980.98 minute wave v would reach equality with minute wave iii; it must end below this point.
When I have some confidence that minuette wave (b) is complete, then the ratio between minuette waves (a) and (c) may be used to calculate a final target for the zigzag to end. This cannot be done today.
Minuette wave (b) may not move beyond the start of minuette wave (a) above 2,081.56.
BULLISH ALTERNATE WAVE COUNT
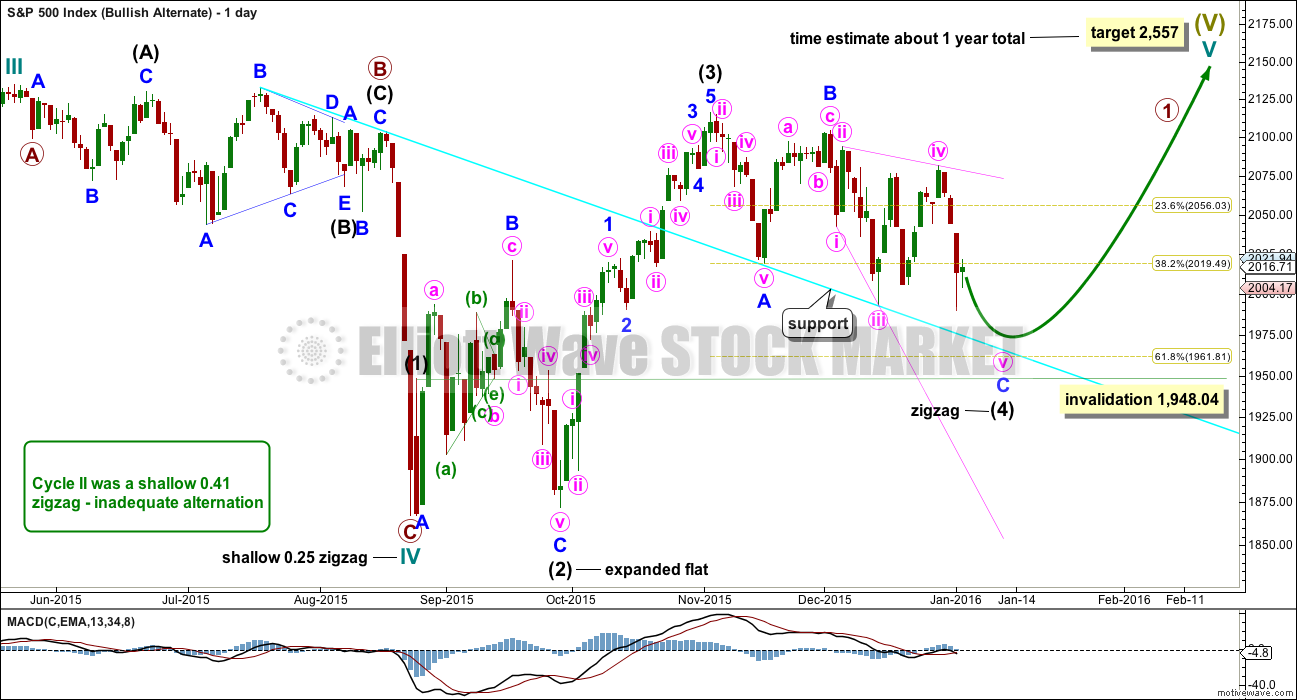
Click chart to enlarge.
I can again see the possibility that cycle wave IV is over and upwards movement may be the start of cycle wave V.
If cycle wave IV is over, as labelled, then there is inadequate alternation between cycle waves II and IV. Cycle wave II was a shallow 0.41 zigzag. Here, cycle wave IV is a more shallow 0.25 zigzag. Both are the same structure.
If cycle wave V has begun, then primary wave 1 within it may be an incomplete impulse. At 2,557 cycle wave V would reach equality in length with cycle wave I. If it also is the same in duration as cycle wave I, then it may last a year.
Intermediate wave (2) was a deep 0.94 expanded flat within primary wave 1. Intermediate wave (4) would be an incomplete zigzag which would also be relatively deep when it is complete. Minor wave C must complete as a five wave structure downwards, and at this stage it may be an incomplete ending expanding diagonal. Intermediate wave (4) may not move into intermediate wave (1) price territory below 1,948.04.
This wave count does not have any support from regular technical analysis. I do not have any confidence in it. It is presented as a “what if?” only, to consider all possibilities.
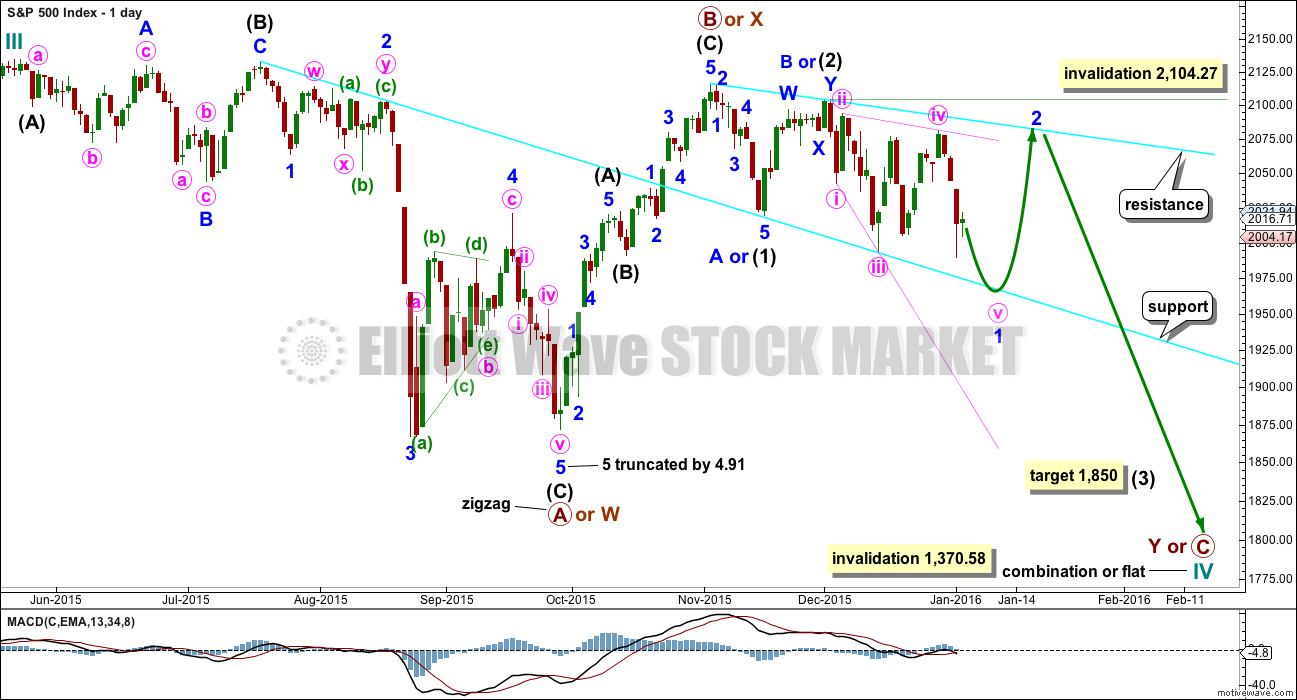
BEAR ELLIOTT WAVE COUNT
DAILY CHART
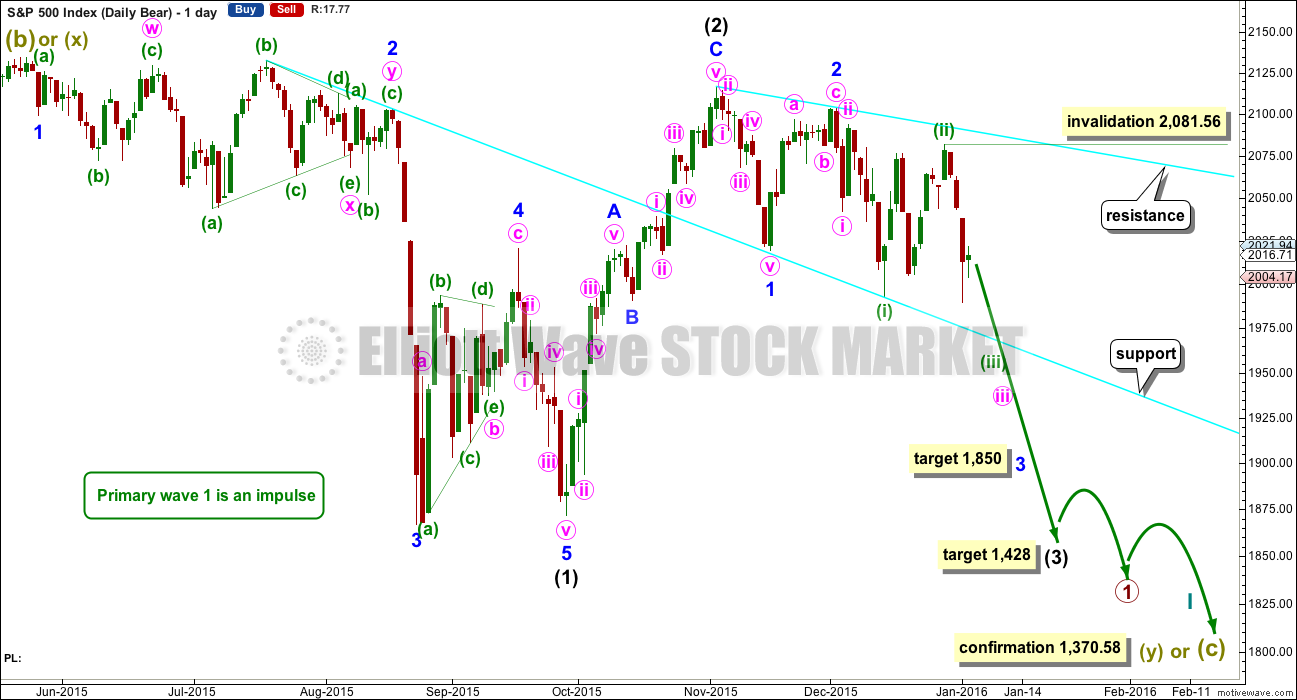
Click chart to enlarge.
This bear wave count fits better than the bull with the even larger picture, super cycle analysis found here. It is also well supported by regular technical analysis at the monthly chart level.
Importantly, there is no lower invalidation point for this wave count. That means there is no lower limit to this bear market.
The downwards movement labelled intermediate wave (1) looks like a five. If minor wave 2 is seen as a double flat with a triangle for wave X within it, then the subdivisions all fit nicely.
Ratios within intermediate wave (1) are: minor wave 3 is 7.13 points short of 6.854 the length of minor wave 1, and minor wave 5 is just 2.82 points longer than 0.618 the length of minor wave 3. These excellent Fibonacci ratios add some support to this wave count.
Intermediate wave (2) was a very deep 0.93 zigzag. Because intermediate wave (2) was so deep the best Fibonacci ratio to apply for the target of intermediate wave (3) is 2.618 which gives a target at 1,428. If intermediate wave (3) ends below this target, then the degree of labelling within this downwards movement may be moved up one degree; this may be primary wave 3 now unfolding and in its early stages.
Within intermediate wave (3), minor waves 1 and 2 are complete. The upwards movement for minor wave 2 does have a strong three wave look to it at the daily chart level. Minor wave 2 was another deep correction at 0.87 of minor wave 1. At 1,850 minor wave 3 would reach 2.618 the length of minor wave 1. If price falls through this first target, then the next Fibonacci ratio in the sequence is 4.236 which would be reached at 1,693. If minor wave 3 is very extended, then the degree of labelling for all downwards movement from the all time high will be moved up one degree.
It is still possible (but still less likely) that primary wave 1 is unfolding as a leading diagonal. I will keep that chart up to date and will publish it if and when it begins to diverge from the idea presented here. For now I want to keep the number of charts published more manageable.
A line from the ends of intermediate wave (2) to minor wave 2 is drawn. This line may show where any further upwards movement finds resistance.
For the bear wave count today, I have two ideas for downwards movement from the end of intermediate wave (2): either a series of overlapping first and second waves or a leading expanding diagonal. This first chart looks at a series of overlapping first and second waves. The only problem with this idea is the brevity of minute wave ii when compared to minuette wave (ii) one degree lower which lasted ten times the duration.
The idea presented with the bull wave count also works in the same way for the bear wave count: a leading expanding diagonal may have begun at the high labelled minute wave ii.
HOURLY CHART
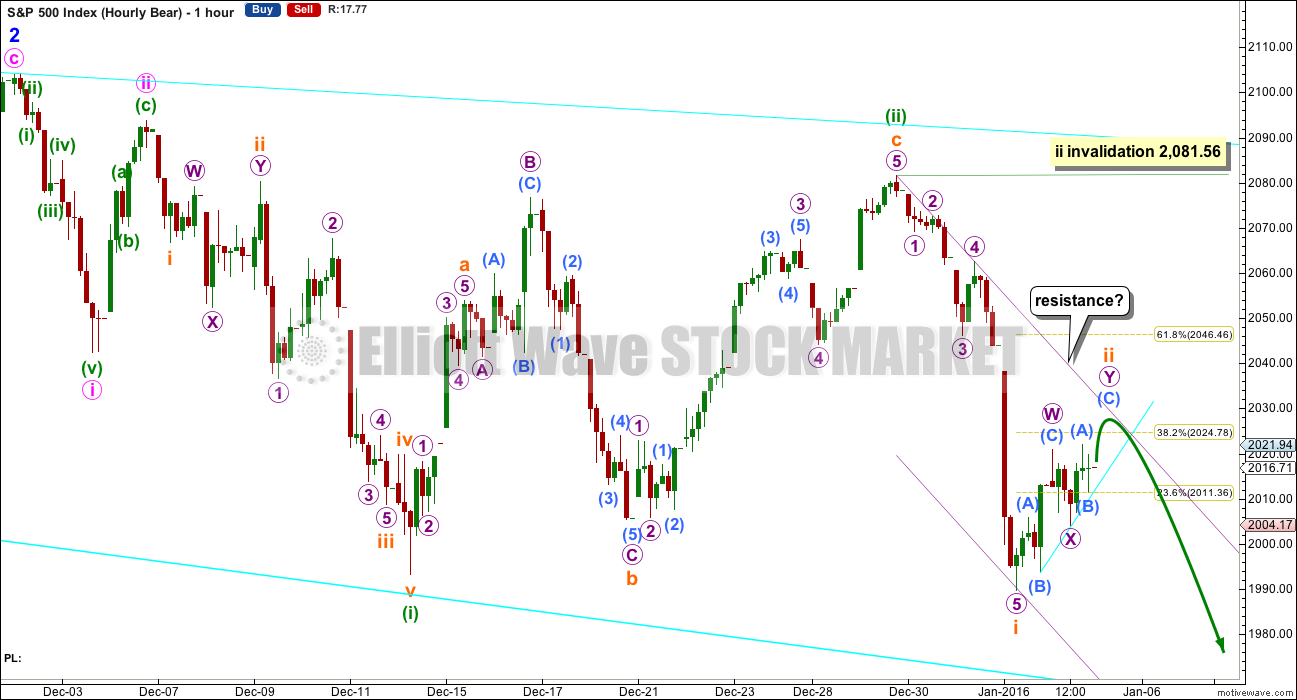
Click chart to enlarge.
In the short term, the structure of the last wave down and the current wave up is seen in exactly the same way again. The downwards impulse now looks more likely to have been complete with a strong extended fifth wave, and upwards movement may be an incomplete second wave correction unfolding as a double zigzag.
The only corrective structures that a second waves may not take are triangles (as the sole structure).
If the idea of a series of overlapping first and second waves is correct, then this current upwards movement should be almost complete. There should now be enough of a strong downwards pull from the middle of a big third wave to force subminuette wave ii to be more brief and maybe also more shallow than second wave corrections normally are. It may end close to the 0.382 Fibonacci ratio at 2,025.
If upwards movement continues higher, then the next reasonable expectation for it to end would be the 0.618 Fibonacci ratio at 2,046.
For the idea of overlapping first and second waves one more upwards day would be reasonable. But if this small correction continues much longer than that, it will start to look more and more unlikely and the idea may be discarded in favour of the alternate below.
Subminuette wave ii may not move beyond the start of subminuette wave i above 2,081.56.
ALTERNATE DAILY CHART
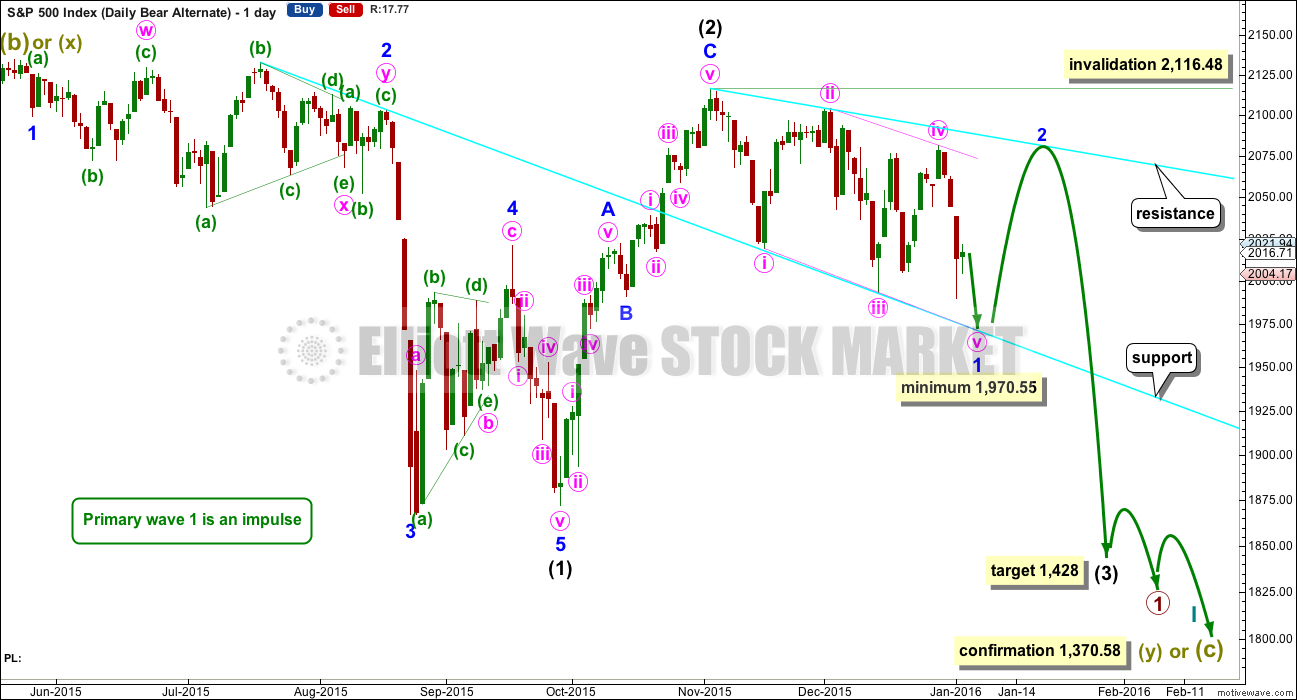
Click chart to enlarge.
This bear wave count is identical to the first bear daily chart right up to the high labelled intermediate wave (2).
Thereafter, it looks at the possibility that a first wave leading diagonal may be unfolding.
The diagonal would be expanding and may have begun earlier than the chart for the bull daily wave count. Minute wave iii is longer than minute wave i, and minute wave iv is longer than minute wave ii. The trend lines diverge, just.
Minute wave v must be longer than minute wave iii, so it must end below 1,970.55.
Leading diagonals in first wave positions are often followed by very deep second wave corrections. When minor wave 1 may be seen as complete, then minor wave 2 should unfold over a couple of weeks and may find resistance at the upper cyan trend line. It may not move beyond the start of minor wave 1 above 2,116.48.
The target for intermediate wave (3) is also the same, only the pathway along the way down here is seen differently.
In the short term, the structure on the hourly chart is also the same. A zigzag downwards for minute wave v would be unfolding and within it minuette wave (a) would be a complete impulse. Current movement for Tuesday would be the start of minuette wave (b). In the short term, minuette wave (b) may not move above the start of minuette wave (a) at 2,081.56.
Because all three ideas at the daily chart level today have exactly the same expectation for what happens next at the hourly chart level, I have a little more confidence in the short term outlook.
Once the zigzag downwards is complete, then how high the next bounce goes and how long it lasts may begin to illuminate which of the three ideas for this move since the high on 2nd November (here labelled intermediate wave (2) ) is correct.
TECHNICAL ANALYSIS
DAILY CHART
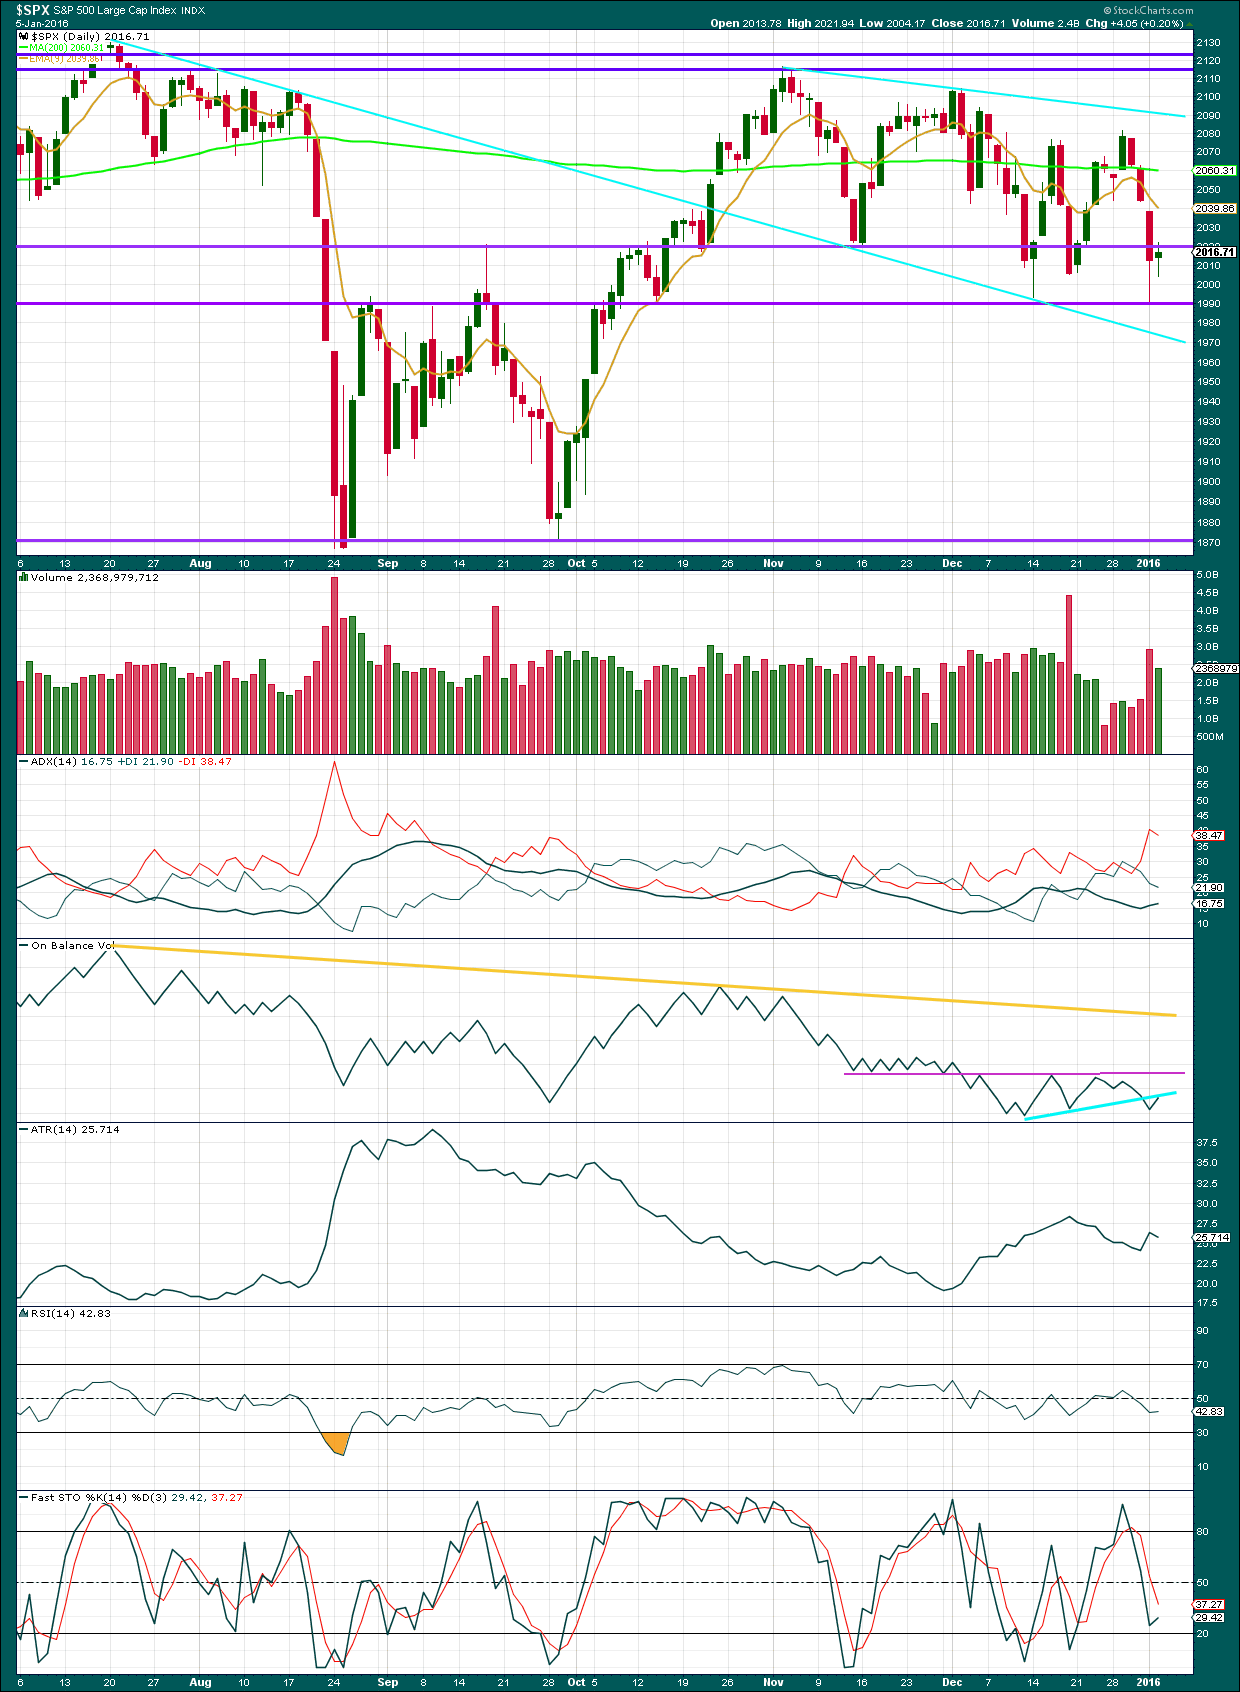
Click chart to enlarge. Chart courtesy of StockCharts.com.
Upwards movement for Tuesday comes with a decline in volume. The rise in price is again not supported by volume, so is suspicious.
The small green candlestick for Tuesday has a small real body. It is more bullish than bearish, but it is not convincingly bullish at all. Overall, it represents indecision, a balance between bulls and bears with the bulls slightly winning.
Price is finding resistance today about the purple horizontal trend line at 2,020, after bouncing up from the lower line about 1,990.
ADX is still overall increasing and above 15, indicating the start of a new downwards trend. ATR is less clear. It may be beginning to increase overall, but today it is declining.
On Balance Volume may again lead the way. It has turned upwards to find resistance at the small cyan trend line. This may provide resistance and halt the upwards move in price. If it does not, then the next line of resistance for OBV is the purple line which is not very far away at all.
RSI is still close to neutral. There is plenty of room for this market to fall.
DOW THEORY
For the bear wave count I am waiting for Dow Theory to confirm a market crash. I am choosing to use the S&P500, Dow Industrials, Dow Transportation, Nasdaq and I’ll add the Russell 2000 index. Major swing lows are noted below. So far the Industrials, Transportation and Russell 2000 have made new major swing lows. None of these indices have made new highs.
At this stage, if the S&P500 and Nasdaq also make new major swing lows, then Dow Theory would confirm a major new bear market. At that stage, my only wave count would be the bear wave count.
S&P500: 1,821.61
Nasdaq: 4,117.84
DJT: 7,700.49 – this price point was breached.
DJIA: 15,855.12 – this price point was breached.
Russell 2000: 1,343.51 – this price point was breached.
This analysis is published about 06:44 p.m. EST.
Looks like a temporary bottom. Adding a few upside short term hedges.
Still not much fear in this market IMHO…have a great evening everybody!
Olga was an early bird and smartly took profits this morning. For the rest of you guys with nerves of steel…now would be a good time to scoop some hard earned loot off the table…I know I am…I was hoping for UVXY 40 but close enough 🙂
Hit 1989.10 – first shot across the bow? Go above 1995.35 now and we could have bottomed short term.
Absent a 5 down from todays high this drop to todays low could well be wave b of (b) of wave 5 (diagonal), as suspected earlier
What about the possibility of five down from Dec 29 with yesterday being a fourth wave? Volatility not trading as if at an intermediate bottom but strange things in that department lately has been nothing new.
UVXY is total pants so far – got 35 at pre-open. Totally wasted day really.
Might regret it but I’m selling my UVXY position into this. Will keep VIXY just in case
Smart move. I am closing my short and medium term holdings too. The move up so far lacks inspiration…
Watch it gap down again tomorrow! Looks like the only way to make money at the moment it to gamble at holding overnight.
Been a few good days – don’t get enough of them so determined not to let Mr Market take a good chunk back.
Luckily I saw Lara’s update yesterday after market had closed so couldn’t sell my position otherwise would have sold half due to the poss wave b nightmare. But it was just that…. Luck.
Have rotated fully into VIXY with a smaller position until some dust settles
I think we are a ways away from the capitulation trade in UVXY. Until then scalping the pullbacks seems to be best approach in the short term. To that end sold some calls against my longer terms positions at the close. I expected a bigger pop today but bullishness lives on! 🙂
On the 5min looks like a falling wedge from the highs, if so expect another ramp into close
I expect you mean a spike up from the wedge. The pattern the last few days seem to be impulses down followed by sideways meandering in a down-trend.
Sorry up or down? Verne you trade options a lot, this is something im interested in, particularly for hedging, got any advise or tips?
I am starting to get a bit nervous about today’s action for the short-term bearish case. We should be accelerating to the downside and that is not happening. I can also count five down from December 29 so a sharp bounce may be in the works. I am looking to see what happens with DJI 17000 and SPX 2000. If they are re-taken it would make a strong case be at least for temporarily being on the sidelines (for bears) in anticipation of a sharp bounce.
Did I speak too soon??!!! 😀
Would not be the first time lol…
The safest kinds of option trades are debit and credit spreads as they offer both the advantage of limited losses and pivoting when you are wrong about the trade. Probably the most important thing I have learned is the importance of good risk management…always use small position sizes, generally no more that 3% of your portfolio-even when you think it’s a sure thing! 🙂
I will have a look into that, cheers for the advice 🙂
Someone said Europe was bought into the close but that should not happen here if this is a third wave down- momentum should be increasing. An awful lot of capital is at play stemming the tide but I would expect at least another hundred point dive into the close. If that does not happen it would be a strong case for B of the diagonal not being over.
These smaller degree waves, if that is what this is, are starting to get remarkable large…
I’m highly suspicious that the B wave was not over. That was very quick.
For the two diagonal scenarios we’re looking for a B wave, it really should last at least 2-3 days. Just one day? That quick and shallow? It doesn’t look right.
But if this is a series of overlapping first and second waves then I would expect the wave 2 may well be over. There is a big warning with that wave count: look out to the downside! That scenario is valid, and it means the indices, all of them, could fall off a cliff any moment now. Now this comment does NOT mean I favour that idea, I just want members to be mindful of the implications of it.
For the diagonal ideas I’m moving the degree of labelling within the B wave down one degree to see it as an expanded flat. Needing a C wave to move above the end of A to make a new high above 2,020.90. The A wave will be a three, a zigzag. The B wave (within the larger B wave) will be a three, an expanded flat. Now the C wave up should unfold.
The orange channel should provide resistance. The invalidation point will remain the same today at 2,081.56.
That’s all from me for now, I need to see the end of the session and then wait for StockCharts data to be ready for the analysis to be finished.
Good luck everybody!
What if–I know this is not conventional thinking but please consider. Maybe US markets are following Lara’s Bull scenario?
Eurozone and China are in horrible condition, big money looking for safety must go somewhere so begins moving to US markets–actually drives up US markets because US markets are viewed as best of the bad alternatives. A leaky lifeboat looks better than a sinking ship.
Totally agree from an EW point of view (not sure about the reason – I think the reason will follow EW, not the other way around).
At higher degreee there are still counts which would see new highs and have yet to be invalidated.
That is why I am still very much on edge about having long term positions.
Possible of course. The trillions in bonds about to go bad present formidable headwinds to global equities IMHO. That is the thing about a bear market of Grand Super Cycle degree if indeed that is what we have….there will be no place to hide…Also, lots of other TA evidence against it…
Vern-but if there is big bust in bonds, that is huge flows of money that must go somewhere. Where does it go? Certainly not to China or Europe. Maybe big bond bust money is almost forced to go to US equities?
Not saying I have an answer, just seems these are bizarre worldwide economic conditions and the established norms may not apply.
The money may just cease to exist.
It’s all based on debt. When debt is repaid the money ceases to exist.
And so when debtors default and the debt must be written off, that money ceases to exist.
So it doesn’t have to go anywhere.
Thank you Lara! You read my mind!
Lara, thanks. Your response proved my belief-surfing clears the mind which supports big picture thinking.
Poof money created from nothing . Poof money disappears into nothing. Central Bank creating money just a disturbance in The Force.
Totally agree Lara.
Money creation = inflation, money ceasing to exist = (possibly massive) deflation.
I what currency are the greatest number of loans worldwide denominated? – USD!!
Hence massive deflation in USD (huge appreciation of USD against other currencies and goods / commodities).
The fact that USD will need to be bought to ‘try’ and pay off USD debt will put more fuel on that fire. Not to mention unwinding the ‘easy years’ carry trades which are not under pressure.
That is my theory anyway!!
The thing you have to remember about bonds defaulting is that there is nowhere for the money to go…default means the capital vaporises! The bonds go to ZERO. Folk loosing that kind of money are then FORCED to sell every and anything of value just to survive, thus exacerbating the deflationary spiral.
When you start to think about the implications for things like pension funds the potential carnage is unimaginable. Another big clue about the markets is the remarkable weakness in breadth. If you take close look below the hood of most indices, you would discover that the vast majority of its components are ALREADY in bear markets and the indices are being held aloft by just a few members. Another thing is insider selling, they have bailed a long time ago, using buyback financed with investors’ money to get out of Dodge. The fact that the markets have held up this long in spite of all these headwinds is truly amazing. Just food for thought…
Vern, thanks, your point is taken.
If bond markets begin collapse does that money survive by jumping to another market and surge that market or maybe bond funds are trapped and can’t liquidate and so go to zero? I don’t know.
EW may be best tool but lots of space (danger) between validation / invalidation points for major bull or bear decisions.
So given the uncertainty, I appreciate comments by you , Lara, Olga and all.
The other thing about a bond market collapse is that is really screws with bullish sentiment. After all, bonds are supposed to be one of the safest places to be and where conservative people put their money when they want to preserve capital. The problem is the protracted ZIRP by the FED resulted in folk chasing yield and getting into lots of junk bonds that they had no business owning, but felt they had little choice. You would be surprised at how many pension fund and money market funds are holding these ticking time bonds. There are hundreds of billions associated with the devastated fracking industry that are still off the radar. The fear created by a collapsing bond market, which dwarfs the equities market in size, will certainly spread to all asset classes, particularly those perceived to be riskier than bonds, namely stocks! It could get ugly I am afraid.
At resistance
Top of the base channel off todays lows currently stalled the move up – hopefully should be done now – if not the invalidation (for this wave off todays lows to be (iv) of a 5 down from yesterdays high) I have as 2011.48 (poss wave (i) low).
A move below 1991.25 proves this move up from todays lows was corrective.
The whole move is still contained within the channel at the moment so still looks corrective
Looks like 3,3,5 upward correction…
Yeah – not sure if its done – could go all the way up to 2011 just to provide as much pain to us as possible.
That would cause it to go way out the channel (though Lara pointed out that happens quite often on the S&P).
I guess this could be (another!) wave ii in which case inval is at about 2019.50, but looks kinda sloppy for a wave ii
Just fallen out the channel – maybe things are heating up.
Hoping that was it for the correction. Earlier high (today) might have only been (a) of an abc up.
Still watching 1991.25
Yep! Considering the gusto of micro three down last week, this thing has not even BEGUN to get up a head of steam, we are still in warm-up stage I think…
Looks like Europe is buying into their close….
I don’t know about options but the VIX futures ETFs did not work as expected
Derivatives can be notoriously unreliable, and derivatives of derivatives even more so. I have never traded futures but I have seen some very strange inconsistencies. Take for example DUST which is supposed to be an inverse ETF for the gold miners. While they were putting in multi-decade lows it was nowhere near its high…very strange indeed. There are lots of them that are complete frauds and a total waste of time and capital.
Most folk who trade them understand they are not buy and hold instruments and still get smoked when they fail to properly follow even the DAILY movement of the underlying commodity or sentiment being measured. The current absence of even a hint of capitulation in the volatility instruments is I think extremely bearish…
The bears seem to enjoy playing with their food…make no mistake, a good old fashioned mauling is still on its way I think… 😀
USA markets are propping up the world indices, Europe is ready as is Asia imo.FTSE would be deep in the 5000s now if they were more bearish
So a low of 1983 so far!!
Where are we looking for the 1st target?
Presuming b finished @ (approx) 2016.96 (ES), I calc first fib target for c @ 0.618 * a would be around 1958.5 (ES)
If this is an expanding diagonal, I calc that wave v of the diagonal = wave iii @ 1969.39 (ES) (wave v should be longer than wave iii – so we should go below that).
I’m lightening up UVXY and rotating into VIXY to protect profits made on this latest drop, just in case we bounce these nearby levels. If we slice right through them I’ll be back in.
I’m probably leaving money on the table (nothing unusual for me there!!)
thanks Olga – your calculations also helped me restore my bear confidence just in the NICK of time 🙂
I’m very wary as current action could still be the b wave of the abc diagonal wave 5 (wave b it can make new lows in wave b(or x) of b).
UVXY has dropped like a stone from pre-market, even though the market just dropped further. Don’t like the look of that
I scooped up a mini-van load of Jan expiration 80 calls JUST FOR FUN mind you…they were practically giving em’ away! 😀
I think we’re just finishing off c of a small degree abc up – below 1995.41, then dropping out of this small degree up moves base channel and passing below 1990.46 would prove that to be the case
It is something to behold how firmly entrenched the buy-the-dip mentality remains. I know the banksters never sleep but WHO ELSE is riding the slope of hope on these corrective waves???!! The are still deep enough to make one wonder…
I know there will come a day, but at the moment I cannot (emotionally) imagine a time when the dip is not bought. This means we’ve got to be close to a BIG change.
If I did not have EW to keep me sane, I would most likely be with the buy the dip crowd
UVXY candle is looking a bit more muscular as compared to the emaciated skeletons of the past few sessions. It should behave properly and take out at least 40 today…thank you very much… 🙂
I’d be very happy with that!!
just sold a bit of my UVXY – will rebuy if (or when!) we go below 1990.46
You probably won’t have long to wait… 🙂
Wave i of (c) of this small degree abc up is at 1993.36 – below that this should be toast, otherwise we might still have one more little pop higher for wave v of (c).
Lets hope it is a simple correction and doesn’t go complex (as I am terrible at counting complex corrections!!)
Also, for the leading diagonal alternate bear count, the minimum target is 1970.55.
A lot lower. There is one very remote POSSIBLE red flag we should look for today and that is for both SPX and DJI to retake the 2000 and 17000 levels respectively. Remote, but not impossible and it would AGAIN temporarily delay the bearish denoument…
VIX ETFs seem to be (currently) dropping far faster than is warranted by this small move up. Complacency or does the crowd know something we don’t?
This small degree move up currently looks corrective to me
The persistent bullishness in the market is nothing short of astonishing and that is what I think you are seeing in the volatility price action. It suggests that this market has a long way to fall. I am leaning toward the series of 1,2 scenario. The fractal nature of the market may have signaled what’s ahead with the extended micro five wave of sub-min 1. That was a huge drop for a micro wave…a shot across the bow perhaps?!
so far the level of persistent bullishness psychology is consistent with the start of third wave. This could be a good news. Although, VIX is not running up as fast as I would like to see it.
You just wait…! A too rapid run-up means a too rapid retreat…nice and easy does it… 😀
Sounds good…
HANG IN THERE. I AM BEARISH!
OIL BROKE THE LOWS..
DONT GET DISTRACTED MATEY!
WE WORKED TO HARD FOR THIS!
abc up in progress I think…so far as the apparent volatility divergence, my suspicion is that hope springs eternal….probably headed back close to 2000 for a kiss good-bye 🙂
you beat me to it – was just saying same above
Great minds think alike…!!! 😀 😀 : D (Just kidding, I am really a kinda humble guy…I hope!)
Don’t think I’ve ever met anyone who trades (successfully) who isn’t – unless they belong to a company that gets inside information that is.
The market is very good at teaching you not to count your chickens until they have hatched!!
Verne
Looks like I had spoken to soon. THE PLUNGE PROTECTION TEAM HAS ARRIVED and THE ES back up to 1996 – Lets see if they can hold this down LOL
The banksters bought, and bought, and bought….all to no avail. Those long-standing pivots will fall today. The UVXY gap open Monday is in all likelihood a break-away gap and may NEVER be filled.
I’M ALL IN! 😀 😀 😀
Special thanks to awesome Lara
And Thank you Verne
It truly feels great to hear members making market progress
It was a bold call on my side the past few weeks some
Wrong but mostly right but I managed to wing it 😉
Verne
If this Korea nuclear test doesn’t help
sink The US market I have to admit this is getting absurd!
Hi Lara!
It’s 10pm EST. Do you think wave 3 has started?
Dr Mohan
I used to play the PIANO.
Enjoy!
https://www.youtube.com/watch?v=kuWPumAP3us
Verne
If this is persistent into the CASH open and about -20 or -25 handles we could GO EVEN MORE DOWN DURING REGULAR TRADING. HANG ON. PLUS FRIDAY IS A REPORT WHICH SHOULD SINK IT MORE!
Whoa…!! Futures down triple digits AGAIN…can the banksters throw another few billions at all that red like they did last night?! They do have very deep pockets you know….what they did last night resulted in our being overbought in a down-trend…really smart aren’t they? 🙂
VERNE,
SIT TIGHT MATEY!
THIS COULD BE IT
ITS HARD TO HOLD ON TO AN IDEA!
HANG IN THERE!
CHEERS!
I AM GETTING SOME FOOD WILL BE UP FOR HOURS TO SEE THIS DEVELOP!
I WROTE UPPER CASE BECAUSE THIS IS IMPORTANT 🙂
Verne
Hold your ideas back a few days
We are dumping now
Thank heavens!
I vote we close below 2,000 it’s game over
No gaps need to be filled
2116 can’t be achieved with the bollinger band compressing and down at 2089 now I don’t see highs or near at all!
UVXY gap from Dec 31 was 28.50 intra day high, 28.35 close. One or both will in all likelihood be filled, and represent the last best buying opportunity for next leg down…
Just because futures are down does not mean the market will be at the open. The banksters bought it from deep in negative territory last night. I think Lara is right about the power of a potential third wave down to limit upwards movement so futures deep in the red would be good for the third down case…finally??!!!!!! ( and I don’t mean at sub-minuette degree. 🙂 )
LAST NIGHT WAS NOT AS BAD AS TONIGHT! THIS IS BAD!
just like august
Dow Futures Plunge 170 Points After Yuan Crashes To 5-Year Lows As PBOC Loses Control
zero hedge
or this could be it:
01.05 21:05 ET – BREAKING NEWS – 5.1 Earthquake Near N. Korea Nuke Test Site
The count showing the extended fifth wave completing on Monday fits perfectly with price action in UVXY. The gap up opening, a mini spike of sorts, and really a fractal of how UVXY behaves on completion of impulsive declines at a higher degree is exactly what I expect to see at the conclusion of an impulse down. I like it…although I missed the tell on Monday…some folk commented on how tepid the volatility spike was considering what was happening in the markets, and the answer is that as ugly as the downside action was, it was just a warm-up performance….that gap from Monday will in all likelihood be filled before the next leg higher…the third was really a five!