
This is the last analysis for 2015. The next analysis will be done after market close for Monday, 4th January, 2016.
This analysis will cover the bigger picture at the monthly chart level and will provide as many alternate ideas as I can see (within reason) at the daily chart level.
May you all have a very Merry Christmas and a Happy New Year!
Summary: A downwards trend is still expected to be in place while price remains below 2,104.27. In the short term, the current downwards wave is either an impulse or a leading diagonal; both are about equally as likely. There are two hourly charts in this analysis that look at these two possibilities and both require downwards movement to a minimum at 1,976.13. Additionally, both expect price is in the early stages of a big third wave down. But if the diagonal scenario is correct, we may yet see another deep second wave correction coming up soon.
To see how each of the bull and bear wave counts fit within a larger time frame see the Grand Supercycle Analysis.
To see detail of the bull market from 2009 to the all time high on weekly charts, click here.
If I was asked to pick a winner (which I am reluctant to do) I would say the bear wave count has a higher probability. It is better supported by regular technical analysis at the monthly chart level, it fits the Grand Supercycle analysis better, and it has overall the “right look”.
New updates to this analysis are in bold.
BULL ELLIOTT WAVE COUNT
MONTHLY CHART
Click chart to enlarge.
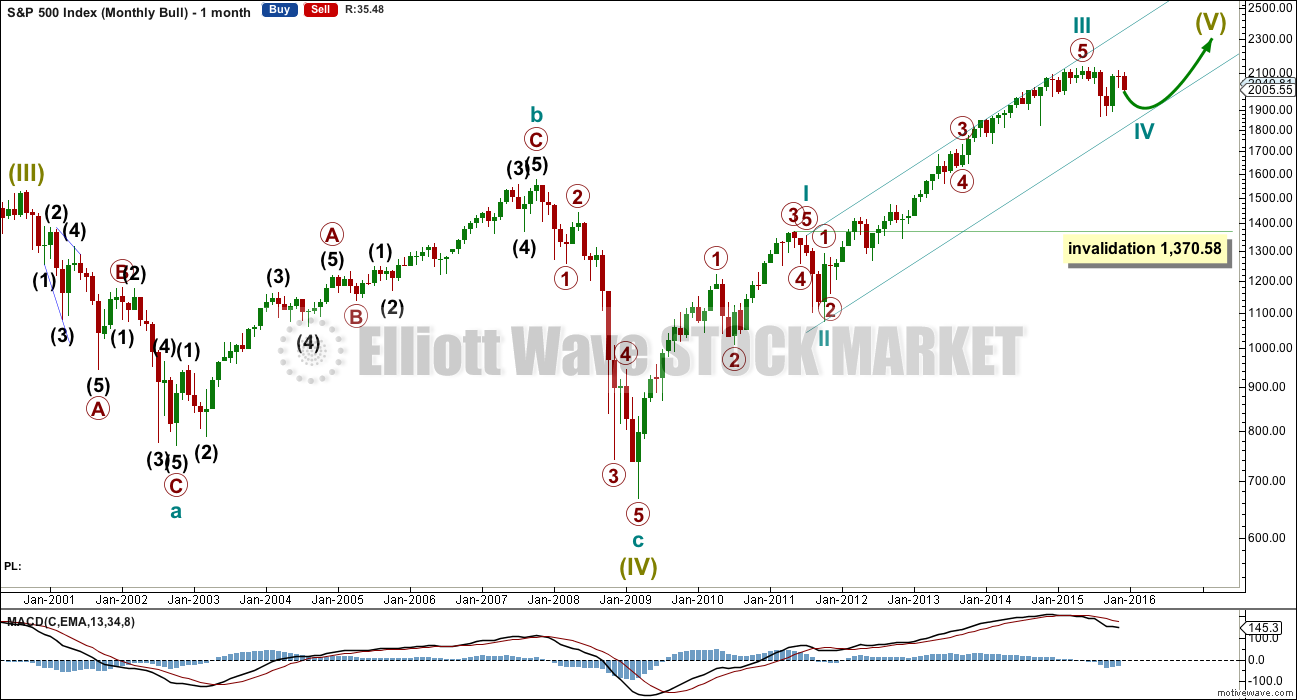
This wave count is bullish at Super Cycle degree.
The two big bear markets of 2000 – 2002 and 2007 – 2009 may have been waves A and C within a large flat correction for a Super Cycle wave IV. The bull market since 2009 may be Super Cycle wave V.
Cycle waves I, II and III are complete within Super Cycle wave V. Cycle wave II was a relatively shallow 0.41 zigzag lasting 12 weeks. Cycle wave III is 55.97 points short of 1.618 the length of cycle wave I. This is a reasonable difference, but as it is less than 10% the length of primary wave 3 (it is 5.2%) I consider this an acceptable Fibonacci ratio.
Draw an Elliott channel about this bull market: draw the first trend line from the ends of cycle waves I to III, then place a parallel copy on the end of cycle wave II. Cycle wave IV may find support at the lower edge of this channel.
Cycle wave IV may not move into cycle wave I price territory below 1,370.58. If this bull wave count is invalidated by downwards movement, then the bear wave count shall be fully confirmed.
Cycle wave III shows an increase in upwards momentum beyond cycle wave I.
Cycle wave II was a shallow 0.41 zigzag lasting three months. Cycle wave IV should exhibit alternation in structure and maybe also alternation in depth. Cycle wave IV may be a flat, combination or triangle. The two daily charts below look at these three possibilities.
Cycle wave IV may end within the price range of the fourth wave of one lesser degree. Because of the good Fibonacci ratio for primary wave 3 and the perfect subdivisions within it, I am confident that primary wave 4 has its range from 1,730 to 1,647.
DAILY CHART – COMBINATION OR FLAT
Click chart to enlarge.
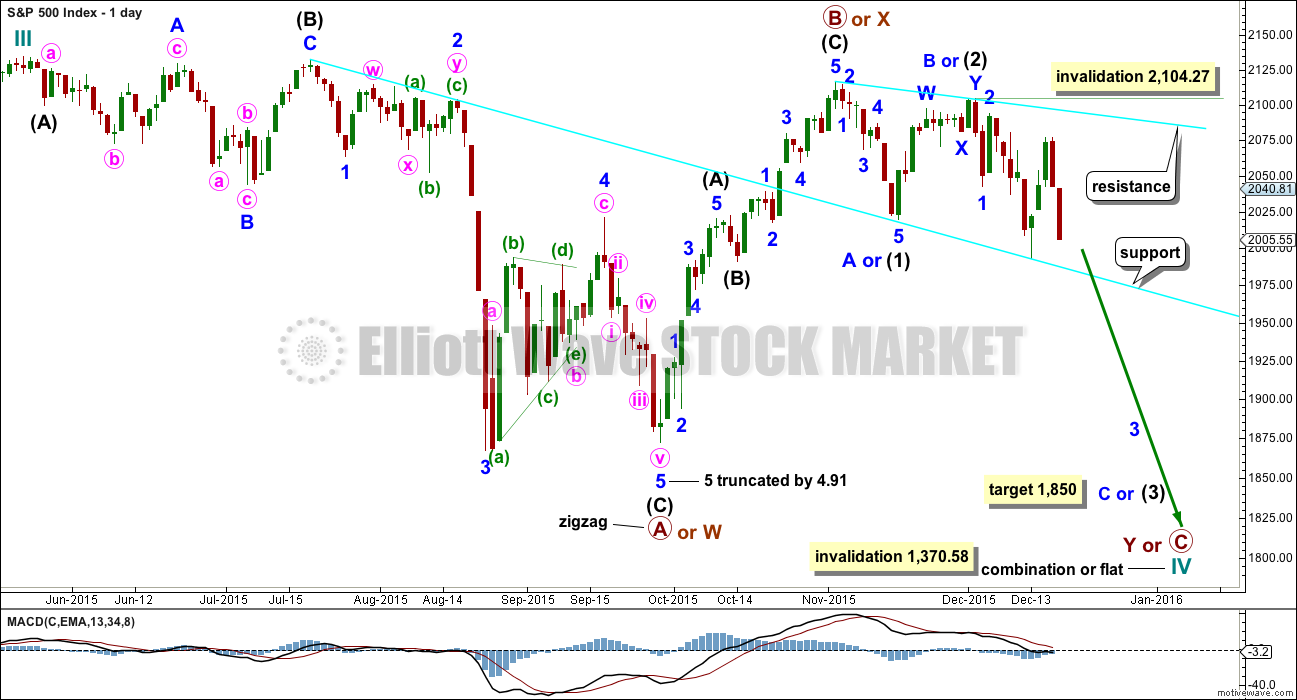
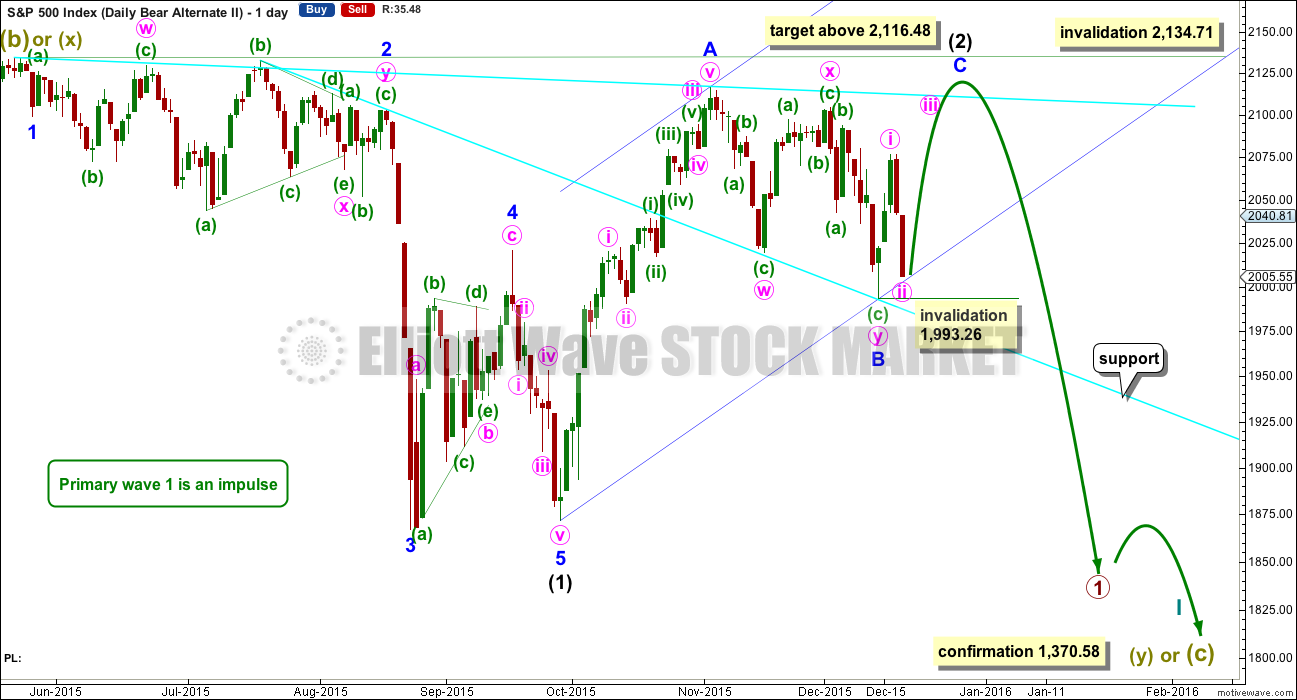
If a zigzag is complete at the last major low as labelled, then cycle wave IV may be unfolding as a flat, combination or triangle.
Primary wave C should subdivide as a five and primary wave Y should begin with a zigzag downwards. This downwards movement is either intermediate waves (1)-(2)-(3) of an impulse for primary wave C or minor waves A-B-C of a zigzag for intermediate wave (A). Both these ideas need to see a five down complete towards the target, so at this stage there is no divergence in expectations regarding targets or direction.
Primary wave A or W lasted three months. Primary wave C or Y may be expected to also last about three months.
Within the new downwards wave of primary wave C or Y, a first and second wave, or A and B wave, is now complete. Intermediate wave (2) or minor wave B lasted a Fibonacci 13 days exactly. At 1,850 intermediate wave (3) or minor wave C would reach 2.618 the length of intermediate wave (1). At this stage, this will be the sole target for this third (or C) wave to end as it fits better with more short term targets calculated at the hourly chart level.
No second wave correction may move beyond its start above 2,104.27 within intermediate wave (3) or minor wave C. This invalidation point allows for the possibility that there may be a leading diagonal unfolding for a first wave down (charted with the bear below).
DAILY CHART – TRIANGLE
Click chart to enlarge.
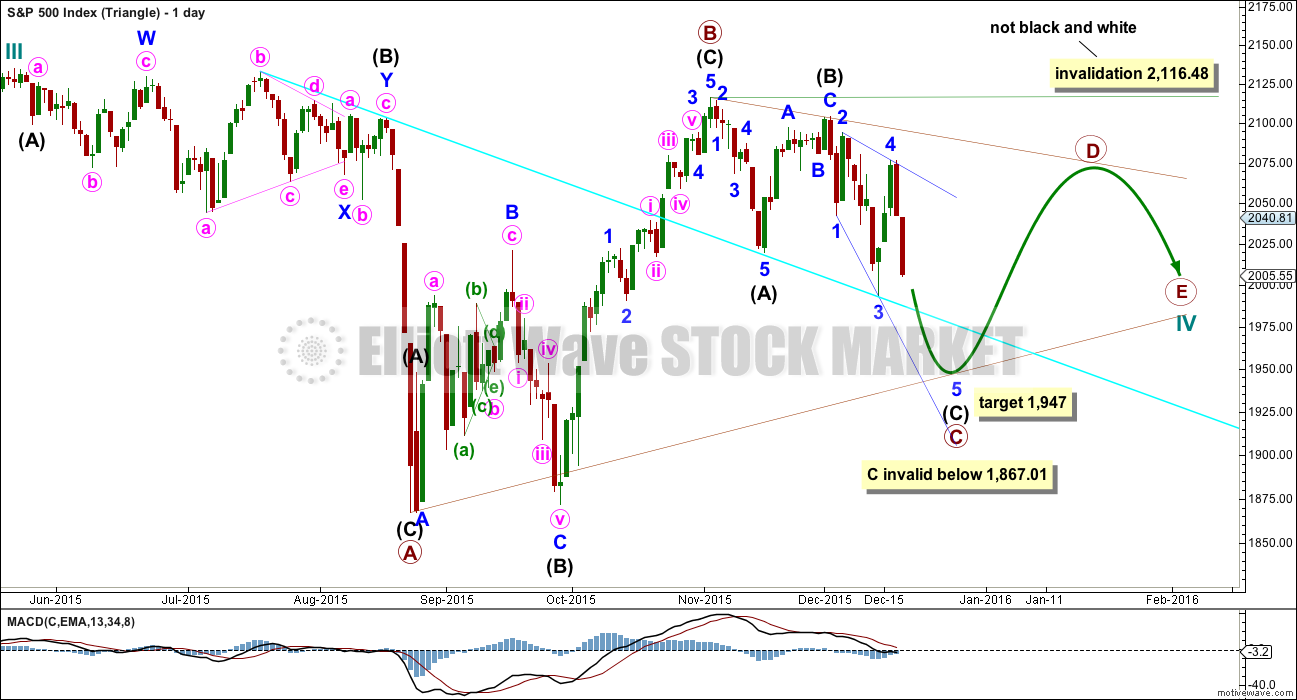
Cycle wave IV may unfold as a shallow triangle. This would provide alternation with the 0.41 zigzag of cycle wave II.
The subdivisions within the triangle are changed today. This has a better fit.
The triangle may be either a regular contracting or regular barrier triangle. An expanding triangle would also be technically possible, but as they are the rarest of all Elliott wave structures I would only chart and consider it if it shows itself to be true. Prior to that, the probability is too low for consideration.
Primary wave B would be a complete zigzag. The subdivisions all fit and now it has a clearer three wave look to it.
Primary wave C should unfold downwards as a single or double zigzag. So far it may be a single zigzag, with intermediate wave (C) unfolding as an ending expanding diagonal. At 1,947 intermediate wave (C) would reach 1.618 the length of intermediate wave (A).
Primary wave C may not move below the end of primary wave A at 1,867.01. This invalidation point is black and white for both a contracting and barrier triangle.
When primary wave C is complete, then primary wave D upwards should unfold as a single or double zigzag. For a contracting triangle, primary wave D may not move beyond the end of primary wave B above 2,116.48. For a barrier triangle, primary wave D should end about the same level as primary wave B at 2,116.48. The triangle would remain valid as long as the B-D trend line remains essentially flat. This invalidation point is not black and white. This is the only Elliot wave rule with any grey area.
Thereafter, primary wave E downwards may not move beyond the end of primary wave C.
The whole structure moves sideways in an ever decreasing range. The purpose of triangles is to take up time and move price sideways. Price exits the triangle in the same direction that it entered, in this case up. When the triangle is complete, then the bull market would be expected to resume. This triangle should take several months yet to complete.
HOURLY CHART
Click chart to enlarge.
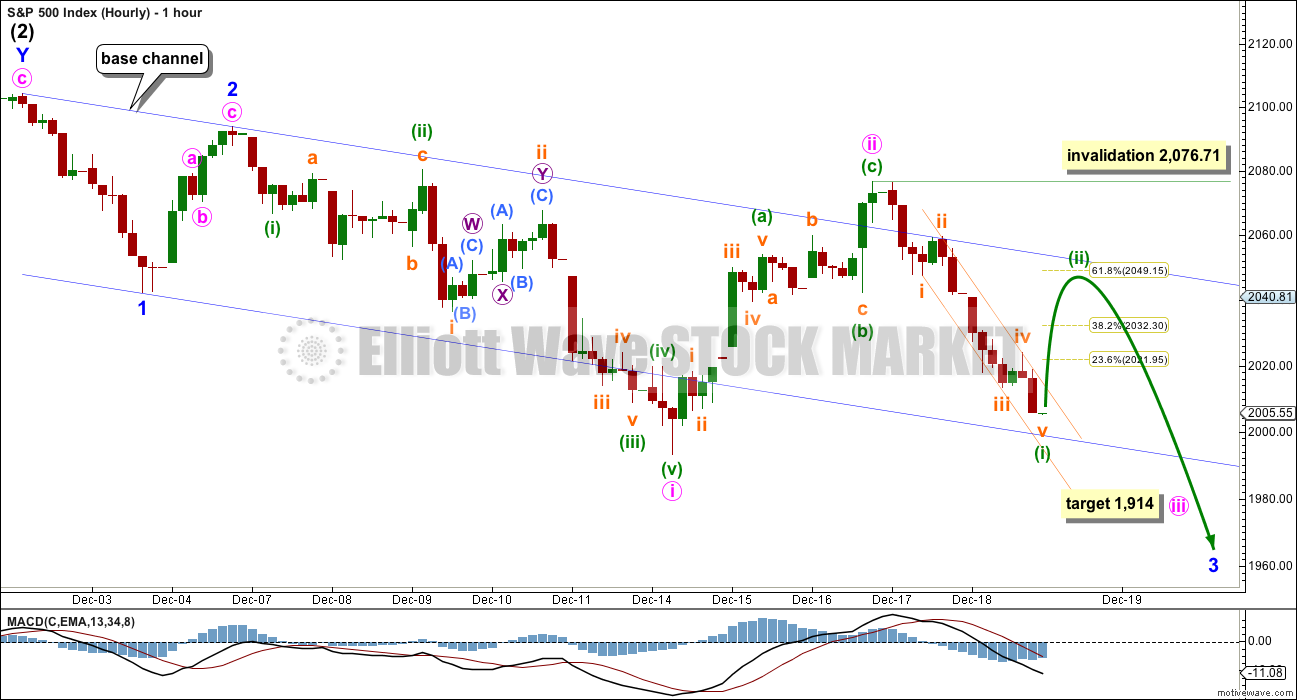
A third wave (or C wave) down is expected to be unfolding for both bull and bear wave counts. It is either beginning with a series of overlapping first and second waves, or it is beginning with a leading expanding diagonal for a first wave.
This first hourly wave count looks at the idea of overlapping first and second waves. The hourly wave count presented for the bear looks at a diagonal unfolding and works in the same way for this bull.
Both hourly wave counts work for bull and bear.
There may be two overlapping first and second waves complete. For the bull, this would be minor waves 1 and 2 and minute waves i and ii. For the bear, this degree of labelling would be one lower.
At 1,914 minute wave iii would reach 1.618 the length of minute wave i.
Although my direction arrow shows we should expect a bounce on Monday, this needs confirmation. First a breach of the small narrow channel about minuette wave (i) is required. If price opens on Monday with downwards movement, then subminuette wave v may be continuing. If that happens, redraw the Fiboancci retracement.
When the channel about minuette wave (i) is very clearly breached, then expect a bounce has begun. Expect minuette wave (ii) to retrace to either the 0.382 or 0.618 Fibonacci ratio of minuette wave (i). Minuette wave (ii) may not move beyond the start of minuette wave (i) above 2,076.71.
I have given some thought to what we would need to see to eliminate the diagonal idea and confirm the idea presented here. Because the diagonal is expanding there is technically no limit to the downwards end of it, and it may even overshoot its lower trend line. There is no lower price point which would confirm this idea and invalidate the diagonal. My conclusion must be to expect a strong third wave down and look out for surprises to the downside, UNLESS price breaks above 1,993.26 (after further downwards movement to 1,976.13 or below). When minute wave iii may be complete, then the following correction for minute wave iv may not move into minute wave i price territory above 1,993.26.
BULLISH ALTERNATE WAVE COUNT
Click chart to enlarge.
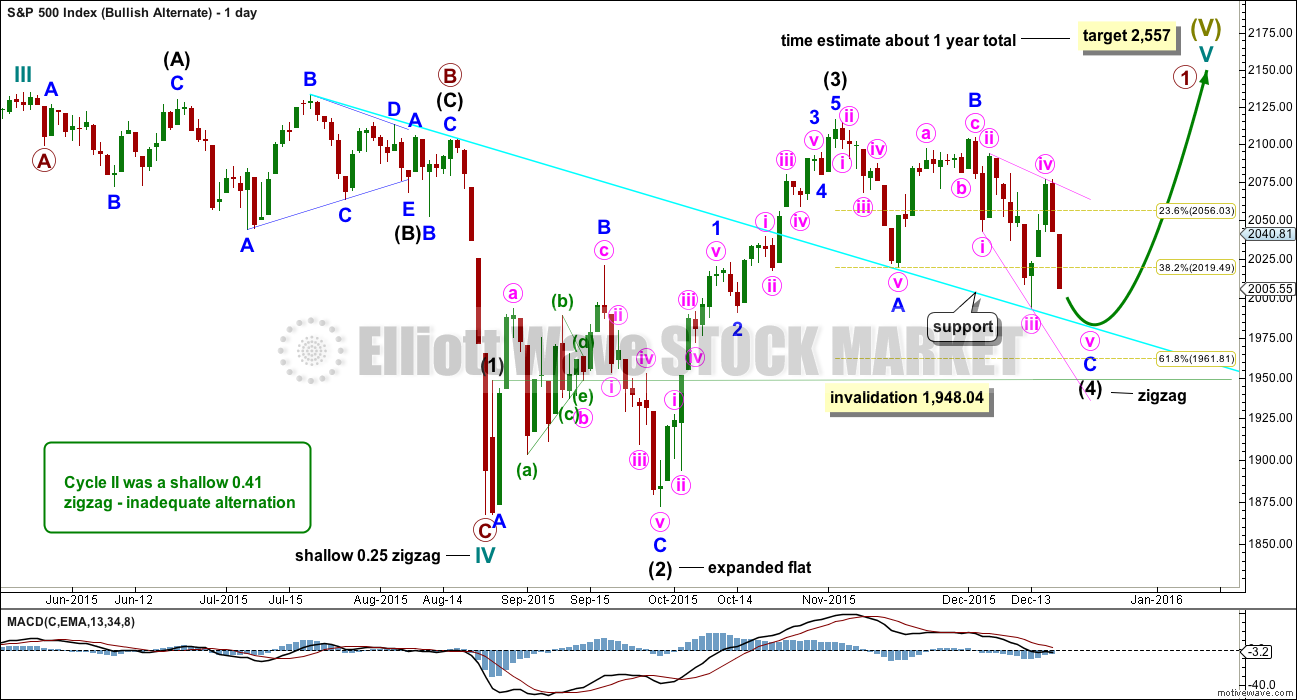
I can again see the possibility that cycle wave IV is over and upwards movement may be the start of cycle wave V.
If cycle wave IV is over, as labelled, then there is inadequate alternation between cycle waves II and IV. Cycle wave II was a shallow 0.41 zigzag. Here, cycle wave IV is a more shallow 0.25 zigzag. Both are the same structure.
If cycle wave V has begun, then primary wave 1 within it may be an incomplete impulse. At 2,557 cycle wave V would reach equality in length with cycle wave I. If it also is the same in duration as cycle wave I, then it may last a year.
Intermediate wave (2) was a deep 0.94 expanded flat within primary wave 1. Intermediate wave (4) would be an incomplete zigzag which would also be relatively deep when it is complete. Minor wave C must complete as a five wave impulse downwards. Intermediate wave (4) may not move into intermediate wave (1) price territory below 1,948.04.
Intermediate wave (4) would be unfolding as a big zigzag. Within intermediate wave (4), the structure of minor wave C is incomplete and must complete as a five wave structure. It may be unfolding as an ending expanding diagonal. The fifth wave must end below 1,976.13, so that it is longer than the third wave and meets the rules for wave lengths of an expanding diagonal. It may find support at the cyan trend line.
This wave count does not have any support from regular technical analysis. I do not have any confidence in it. It is presented as a “what if?” only, to consider all possibilities.
BEAR ELLIOTT WAVE COUNT
MONTHLY CHART
Click chart to enlarge.
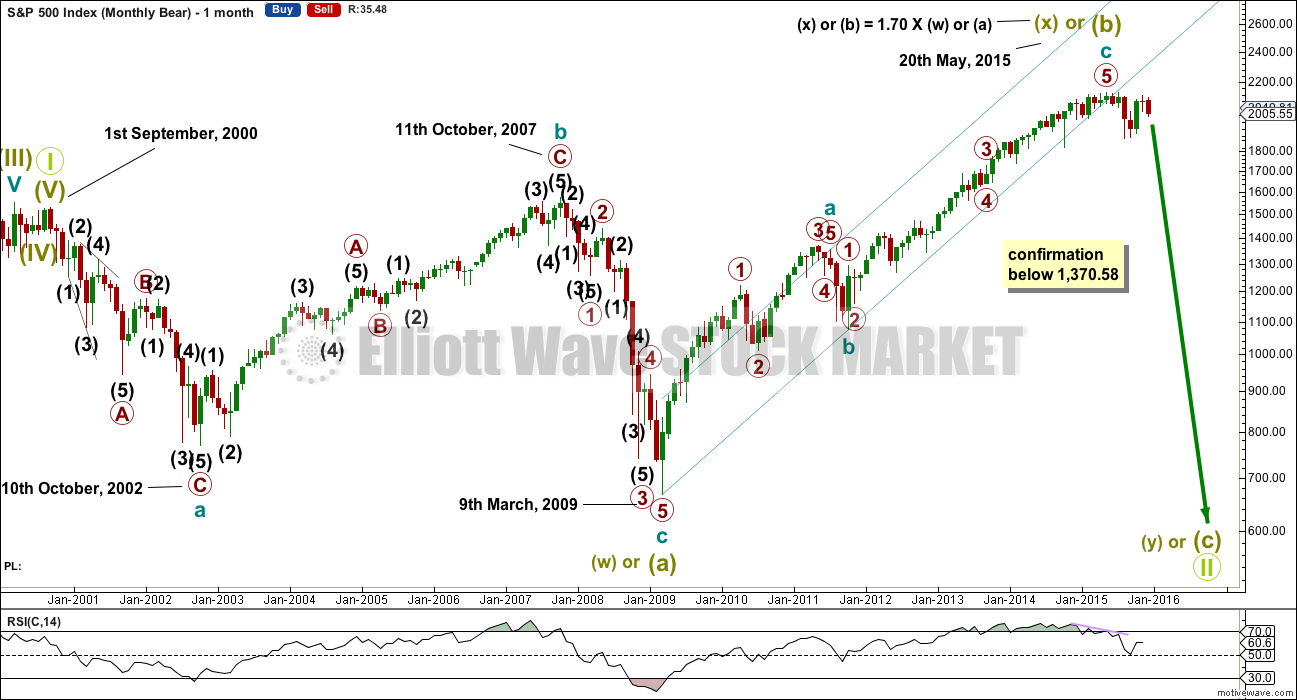
What if the big flat correction labelled super cycle wave (w) or (a) was only the first three in a larger correction?
This bear wave count fits better than the bull with the even larger picture, super cycle analysis found here. It is also well supported by regular technical analysis at the monthly chart level.
There are two ideas presented in this chart: a huge flat correction or a double flat / double combination. The huge flat is more likely. They more commonly have deep B waves than combinations have deep X waves (in my experience).
A huge flat correction would be labelled super cycle (a)-(b)-(c). It now expects a huge super cycle wave (c) to move substantially below the end of (a) at 666.79. C waves can behave like third waves. This idea expects a devastating bear market, and a huge crash to be much bigger than the last two bear markets on this chart.
The second idea is a combination which would be labelled super cycle (w)-(x)-(y). The second structure for super cycle wave (y) would be a huge sideways repeat of super cycle wave (a) for a double flat, or a quicker zigzag for a double combination. It is also possible (least likely) that price could drift sideways in big movements for over 10 years for a huge triangle for super cycle wave (y).
Importantly, there is no lower invalidation point for this wave count. That means there is no lower limit to this bear market.
DAILY CHART
Click chart to enlarge.
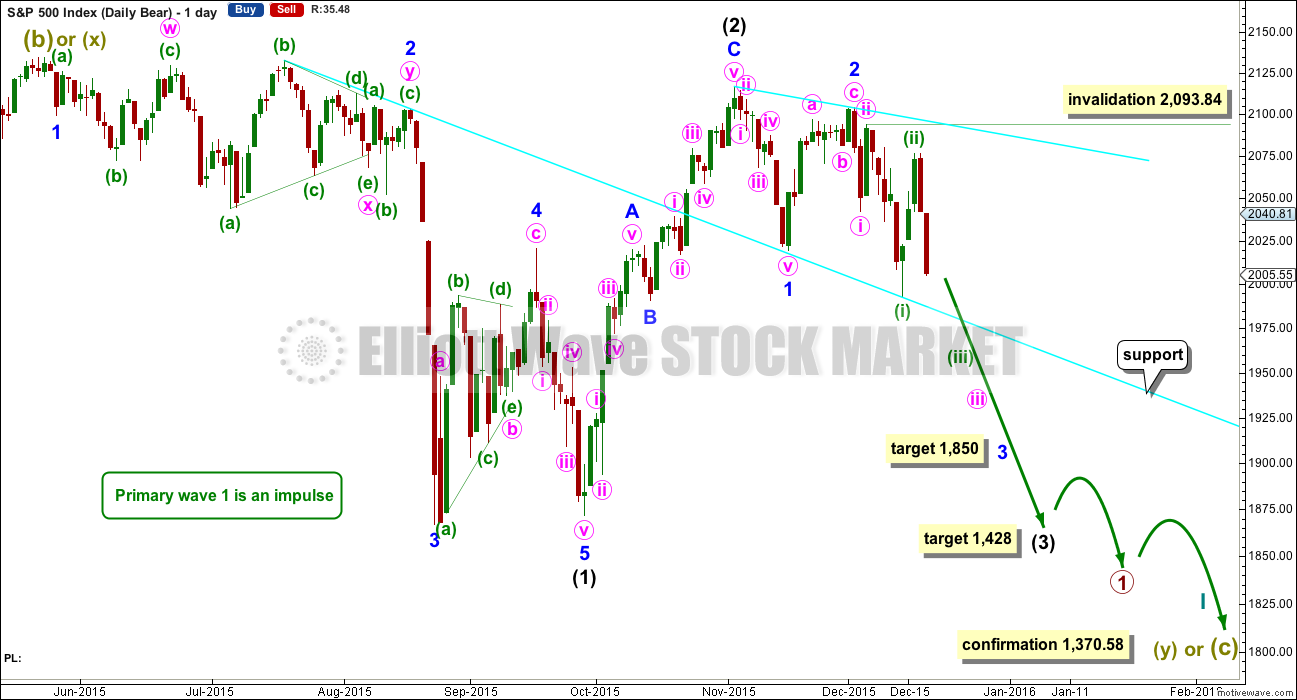
The downwards movement labelled intermediate wave (1) looks like a five. If minor wave 2 is seen as a double zigzag with a triangle for wave X within it, then the subdivisions all fit nicely.
Ratios within intermediate wave (1) are: minor wave 3 is 7.13 points short of 6.854 the length of minor wave 1, and minor wave 5 is just 2.82 points longer than 0.618 the length of minor wave 3. These excellent Fibonacci ratios add some support to this wave count.
Intermediate wave (2) was a very deep 0.93 zigzag (it will also subdivide as a double zigzag). Because intermediate wave (2) was so deep the best Fibonacci ratio to apply for the target of intermediate wave (3) is 2.618 which gives a target at 1,428. If intermediate wave (3) ends below this target, then the degree of labelling within this downwards movement may be moved up one degree; this may be primary wave 3 now unfolding and in its early stages.
Within intermediate wave (3), minor waves 1 and 2 are complete. The upwards movement for minor wave 2 does have a strong three wave look to it at the daily chart level. Minor wave 2 was another deep correction at 0.87 of minor wave 1. At 1,850 minor wave 3 would reach 2.618 the length of minor wave 1. If price falls through this first target, then the next Fibonacci ratio in the sequence is 4.236 which would be reached at 1,693. If minor wave 3 is very extended, then the degree of labelling for all downwards movement from the all time high will be moved up one degree.
It is still possible (but still less likely) that primary wave 1 is unfolding as a leading diagonal. I will keep that chart up to date and will publish it if and when it begins to diverge from the idea presented here. For now I want to keep the number of charts published more manageable.
A line from the ends of intermediate wave (2) to minor wave 2 is drawn. This line may show where any further upwards movement finds resistance.
From the end of minor wave 2, the following downwards movement is either a series of two overlapping first and second waves as labelled here (see detail for this idea on the hourly bull chart) or a leading expanding diagonal charted below.
ALTERNATE DAILY CHART
Click chart to enlarge.
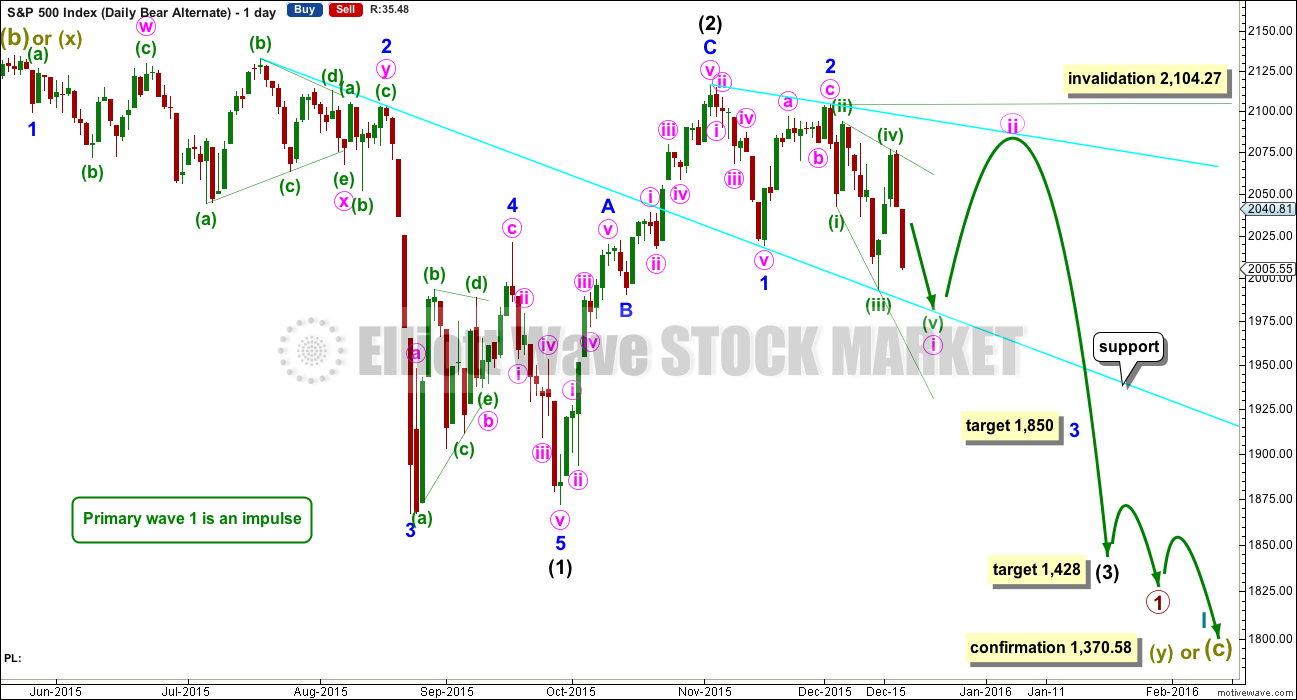
This bear wave count is identical to the first bear daily chart right up to the high labelled minor wave 2.
Thereafter, it looks at the possibility that a first wave leading diagonal may be unfolding.
When minute wave i is complete, then minute wave ii may not move beyond its start above 2,104.27. Second wave corrections to follow leading diagonals in first wave positions are commonly very deep. When the diagonal may be complete, then draw a Fibonacci retracement along its length. Look for minute wave ii to correct at least to the 0.618 Fibonacci ratio of minute wave i, but it may be even deeper. It should look like a clear three on the daily chart.
The target for minor wave 3 is still the same. At 1,850 it would reach 2.618 the length of minor wave 1.
HOURLY CHART

Click chart to enlarge.
At this stage, this overlapping downwards movement does look suspiciously like an expanding diagonal. This resolves the problem that the first hourly chart has of a breach of the base channel. All the subdivisions here fit well.
Leading diagonals require sub waves 2 and 4 to be zigzags. Subwaves 1, 3 and 5 are also most commonly zigzags but they may also be impulses. Ending diagonals require them to be zigzags.
Minuette wave (iii) does have a slightly better fit as a zigzag and does look more like a zigzag.
Second and fourth waves of diagonals are normally very deep. The normal range is from 0.66 to 0.81 of the first and third waves. Here, both minuette waves (ii) and (iv) are 0.83 of minuette waves (i) and (iii). Slightly deeper than normal but not by too much. This gives the structure a reasonably typical look for a diagonal.
Minuette wave (iii) is longer than minuette wave (i) and minuette wave (iv) is longer than minuette wave (ii). The trend lines diverge. The diagonal is expanding. Minuette wave (v) must end below the end of minuette wave (ii) as the fifth wave of a leading diagonal may not be truncated. It must also be longer than the third wave, so that the rules for wave lengths of an expanding diagonal are met. It must end below 1,976.13.
Minuette wave (v) is most likely to subdivide as a zigzag. Subminuette wave b may not move beyond the start of subminuette wave a above 2,076.71 within the zigzag. Subminuette wave b should find strong resistance at the upper (ii)-(iv) diagonal trend line. Diagonals normally adhere very well to their trend lines.
Again, this is unconfirmed although my arrow shows to expect upwards movement for Monday. First, expect that price can continue lower while it remains within the small channel drawn here about subminuette wave a. Only when that small channel is breached, then should a bounce for subminuette wave b be expected.
The diagonal may find support and may end about the lower cyan trend line which is copied over here from the daily chart. But in order to meet the minimum price of 1,976.13, the diagonal may need to overshoot that trend line. It depends how time consuming subminuette wave b turns out to be.
When the diagonal may potentially be complete, then the price point which will differentiate this diagonal idea from the other idea of overlapping first and second waves on the first hourly chart will be 1,993.26. The first idea will need to see a series of fourth wave corrections which may not move back into their first wave price territories, so for that idea price should remain below 1,993.26.
But for this diagonal idea a deep second wave correction should unfold upwards.
If price moves lower to 1,976.13 or below and then turns around and moves above 1,993.26, then this should be the wave count which is used. At that stage, a diagonal would be complete and a deep second wave should be underway.
Minute wave ii may find resistance at the upper cyan trend line copied over from the daily chart.
ALTERNATE BEAR ELLIOTT WAVE COUNT
DAILY CHART
Click chart to enlarge.
Intermediate wave (2) may not be over. It may be continuing further as an even deeper zigzag.
This wave count is changed slightly today.
Minor wave B may be over as a double zigzag. Minor wave C upwards may have begun. Minor wave C may not exhibit a Fibonacci ratio to minor wave A. A target calculation using 0.618 of A is invalid and using 0.382 of A results in a truncation.
Minor wave C is highly likely to make at least a slight new high above the end of minor wave A at 2,116.48 to avoid a truncation.
Intermediate wave (2) may not move beyond the start of intermediate wave (1) at 2,134.71. This invalidation point may not be breached by any amount at any time frame for the bear wave count to remain valid.
Minor wave C must subdivide as a five wave structure. Within minor wave C, minute wave ii may not move beyond the start of minute wave i below 1,993.26.
At the end of this week, the depth and strength of the downwards move labelled minute wave ii does not look like a correction. This wave count has a low probability. It is presented only as a “what if” to consider all possibilities.
TECHNICAL ANALYSIS
MONTHLY CHART
Click chart to enlarge. Chart courtesy of StockCharts.com.
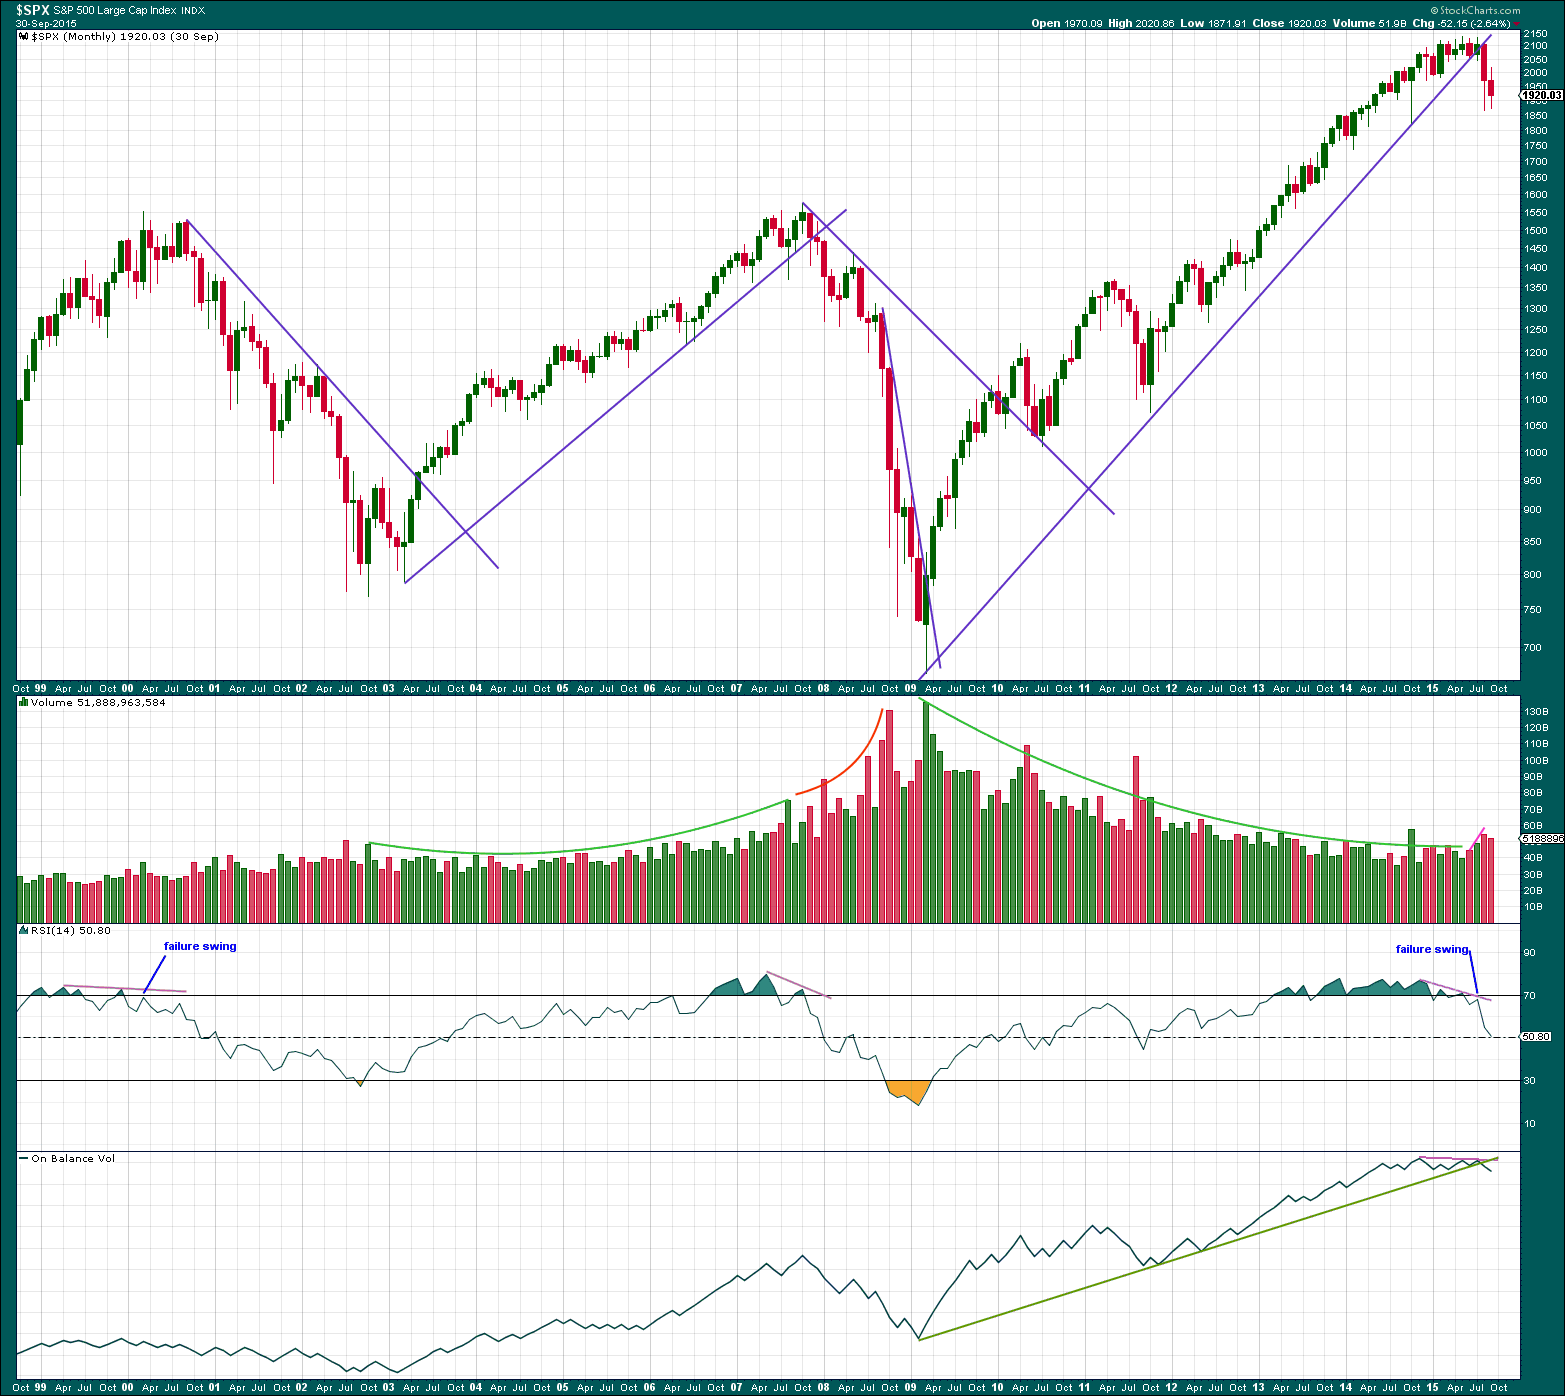
The long trend line on price is drawn from the low of March 2009, at 666.79 to the low in October 2011. This trend line was repeatedly tested, breached, and then provided resistance in August 2015. Price has closed well over 3% of market value below it. Trend lines like this one which are reasonably shallow, long held and repeatedly tested are highly technically significant. The breach tells us the market has switched from bull to bear. This supports the bear wave count over the bull.
Volume has overall declined during the bull market spanning over 6 years. The rise in price was not supported by volume at the monthly chart level. This also supports the bear wave count over the bull.
RSI shows double negative divergence with price as the final highs were made. Finally, a failure swing on RSI completes a pattern which was last seen in September 2000, and October 2007. This pattern indicates a large bear market may begin from here and supports the bear wave count over the bull.
On Balance Volume also shows divergence with price (pink line) as the final highs were made. On Balance Volume has breached a very long held trend line (green). This is further support for the bear wave count over the bull.
Since the all time high in May, downwards movement is coming with an increase in volume at the monthly chart level. This further supports the bear wave count over the bull
Not only is there nothing bullish about this picture at the monthly chart level, it is very bearish indeed. It indicates that recent downwards movement is more likely to be the start of a large bear market than it is to be another correction within a continuing bull market.
DAILY CHART
Click chart to enlarge. Chart courtesy of StockCharts.com.
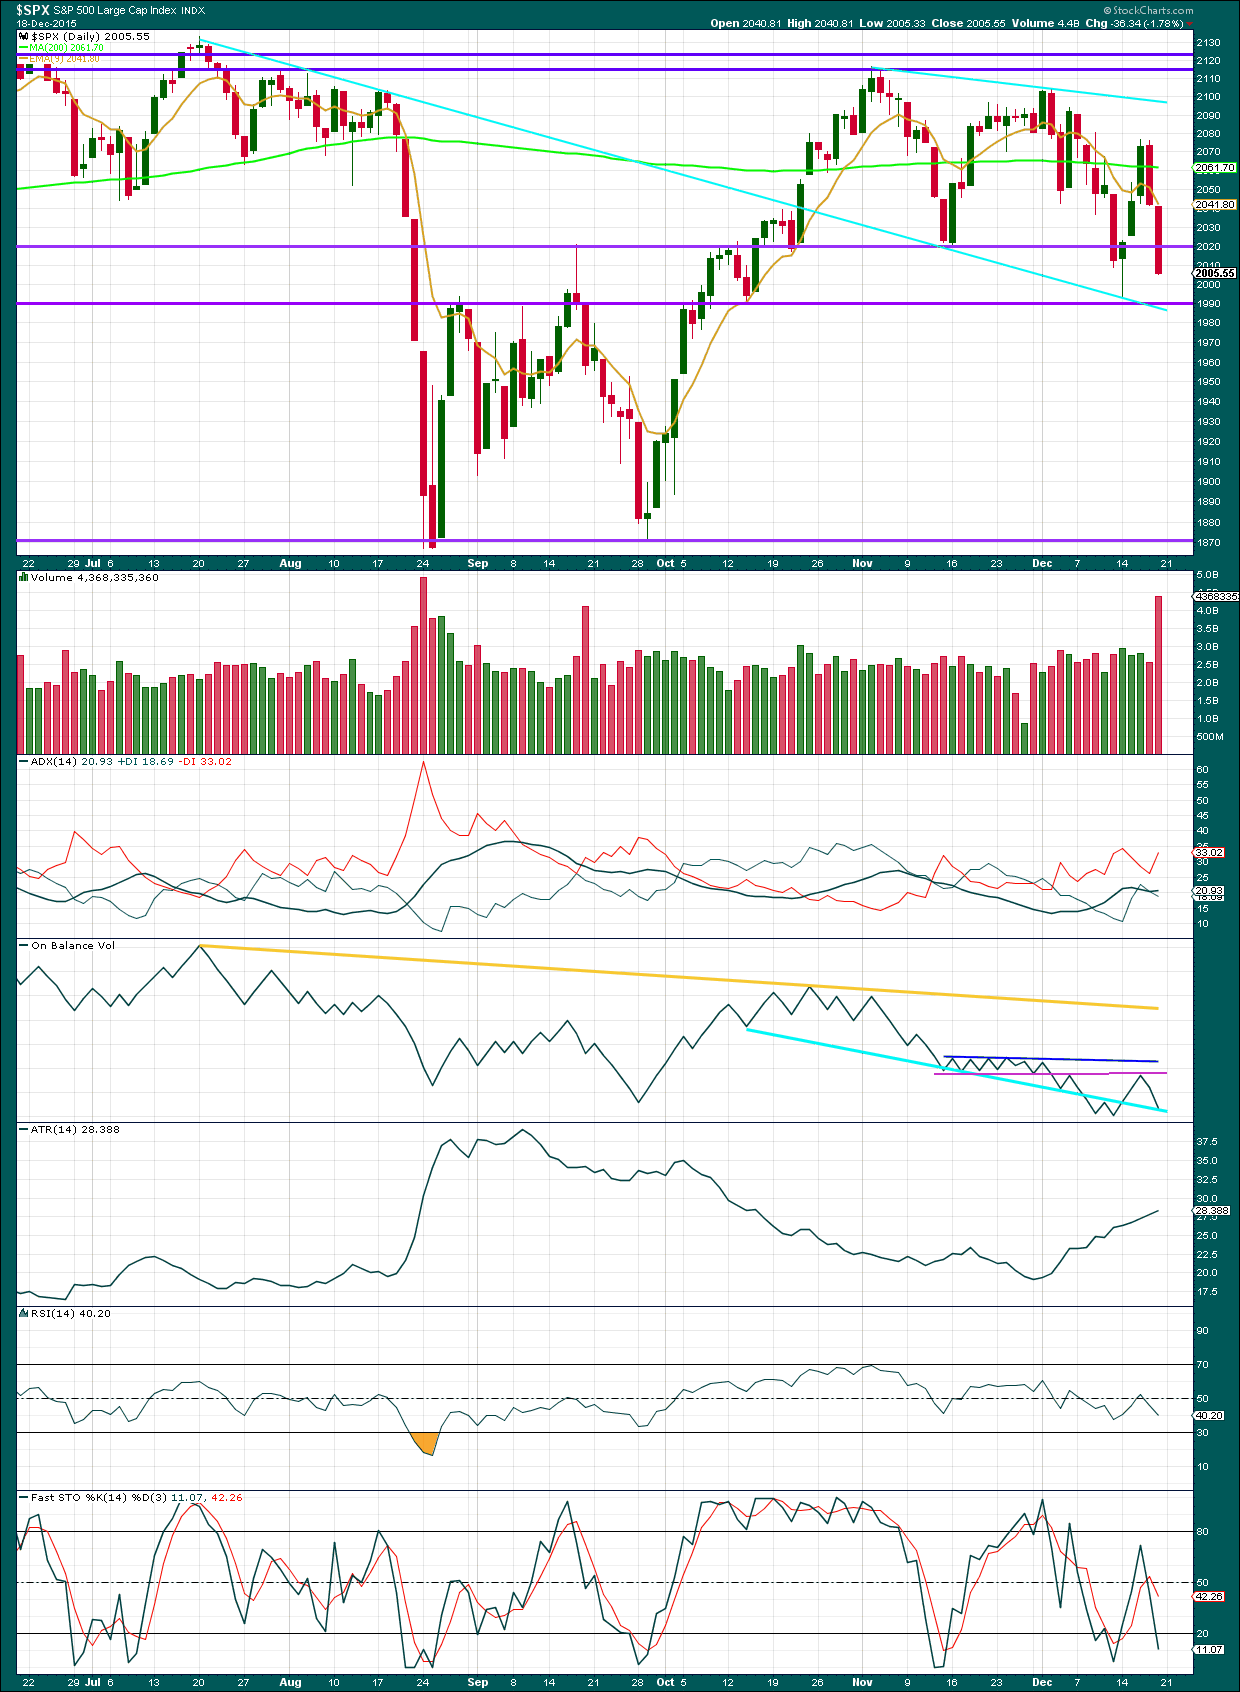
Volume for Friday’s downwards day strongly increased. The downwards move in price was supported by volume.
ADX turned upwards and is above 20 for Friday. There is a downwards trend indicated with the -DX line above the +DX line. ATR agrees. The range price is moving in is increasing which is typical this market when it is trending.
Price is below the 200 day moving average. The trend looks to be very clearly down.
On Balance Volume found strong resistance at the pink trend line. It may now find some support at the cyan trend line. A break below that cyan line would be further bearishness from OBV.
RSI is not yet oversold. There is plenty of room for this market to fall. I would not expect this downwards trend to have another major interruption until RSI shows oversold and then also shows some divergence with price. This is a common pattern at lows for the S&P.
DOW THEORY
For the bear wave count I am waiting for Dow Theory to confirm a market crash. I am choosing to use the S&P500, Dow Industrials, Dow Transportation, Nasdaq and I’ll add the Russell 2000 index. Major swing lows are noted below. So far the Industrials, Transportation and Russell 2000 have made new major swing lows. None of these indices have made new highs.
At this stage, if the S&P500 and Nasdaq also make new major swing lows, then Dow Theory would confirm a major new bear market. At that stage, my only wave count would be the bear wave count.
S&P500: 1,821.61
Nasdaq: 4,117.84
DJT: 7,700.49 – this price point was breached.
DJIA: 15,855.12 – this price point was breached.
Russell 2000: 1,343.51 – this price point was breached.
This analysis is published about 03:29 a.m. EST on 19th December, 2015.
I am wondering if what Lara labelled the end of minuette three on the alternate chart could have been actually the end of minute one down, and we have now had a five three five correction up for minute two. If that is the case we should now be in minute three down with sharply increasing momentum today. If not, I would be inclined to think intermediate two is not done.
2093.84 is invalidation point for the first daily chart as this is where a possible wave four would enter wave one territory for the count at one lesser degree. The best fit now is daily chart for upward minute two for the alternate count which would have seen a truncated minuette five of minute one down. Cannot exceed 2104.27 to remain valid.
Does current action conform to Lara’s yesterday’s (23 Dec) hourly bear update?
Currently (in my opinion) yes – unless (or indeed until!) 2076.71 is taken out.
The upper trendline of the diagonal was breached today but not by much and the market has now impulsively retreated below it, so I’m cautiously overlooking the breach.
The risk reward here is very good, as Lara stated. I’ve been pecking at long volatility since early yesterday, so my risk is a bit higher than someone who jumped in around todays highs, though volatility has not been falling that much over the last couple days despite the markets rise. That and a few other metrics have provided me more confidence.
I’m now back ‘all in’ with a tiny bit of power left dry just in case we go to the wire. We’ll soon see if Mr Market intends taking back some of my earlier profits.
Merry Xmas to all
Olga–thanks for your comments.
Many blessings to all on Christmas and in the New Year.
Did she give an update yesterday??!! Yikes!! I missed it! How could I have missed it?? 🙁
I did ask you if you’d seen it! (11.54 am below) 🙂
Must be the distraction of Xmas; sorry I missed the query Olga… 🙂
Hey Verne, there is a cool notification feature that will send you an email whenever Lara makes a new post. You may want to check that out. Merry Christmas everyone!
Thanks for the tip. I will get signed up! 🙂
Another huge SPY block purchase just prior to the close. Either we go on to new highs at years end, or that third wave down finally puts in an appearance. The market is on life support IMHO…
Blessings and a Merry Christmas to Everyone! 🙂 🙂 🙂
Interesting. Last DJI low unconfirmed by SPX. Today’s high in SPX unconfirmed by DJI…
MERRY XMAS TO ALL!!!
What do think!!! 2070 is very close……….will we go higher???????
Starting to take a closer look at the wave count with an unfinished intermediate 2 up but still thinking that 2070 should provide stiff resistance. If not tested today, it sets up a violent move one way or the other for Monday’s trading which I think futures will telegraph on Sunday…
Son of a gun : broke resistance
Bigger chart : Might me more resistance ahead (Dashed line)
SPX is at resistance now
STATS
Battle around 200 dma continues. Kind of surprising considering low volume and absence of sellers. I thought we would run up to at least 2070.00
Stats
Not sure if you guys have seen Lara’s short hourly bear update – I only just noticed it
ES broke above the fib line and is testing the black dashed line ………..
Happy Holly Days to you all!
Big spike in the $trin index which is bearish
but this is still the opening 1/2HR
ES Daily……… Anyone care to try a wave count on the ES ? There is a lot more data on the ES vs Cash
This is the ES HR.
For anyone interested, here is the site (Add www )
investing.com/indices/us-spx-500-futures
Hi
All
I’m only taking 4 days off. Keep it simple out there. I remain neutral until
2,000 breaks then turn really bearish….
Bye
Verne
Waiting for my flight soon. FUTURES RIPPING HIGHER. 3% in 3 days for the S&P 500 that is nothing for this maniac bull market. I have seen the DOW do about 1,000 points in 5 days LOL.
Probably get to 2116 in no time. I wouldn’t bother making anymore counts for 2015. EUPHORIA IS TO POWERFUL WITH SANTA AROUND!
later matey!
The higher they rip, the harder they fall…talk to me in two weeks… 🙂
Flight delayed – what luck.
I’m really bearish but in the face of all this 3 day rally I honestly give up – it’s hard to be bearish when you see option contracts drop so fast.
I am at a loss of words and I don’t know what this all means for 2016.
I just am not feeling good!
Good time with family is all I can cherish which is priceless.
If you’ve given up then are you REALLY bearish?! 🙂
i am flexible. I have been a stubborn trader before and that is a lose situation…
It is always good to have a number that says you are wrong , no question. It is also important to have the courage of your convictions once you have done due diligence, and remain in your position until that number tells you to get out… 🙂
SPX punched to 0.01 point new high after mini five down. Interestingly, SPY hit the exact previous high at 206.07. Still hanging on to a few in-the-money calls expiring tomorrow and sure hope to cash em in but I have a feeling I may not get to…markets close at 1.00 pm Thursday in shortened holiday trading…’Bye all…
I think it safe to consider this correction up likely to be at least at minute degree. Technically a sub-min b up for minuette five still possible but I don’t think so…I guess we will know if the next decline bounces after 1976 area and goes past 1993…
I am seeing a mini five down as well…
So, just one thing. what is your target for this correction up 2070-2100ish? please explain. I am on my iPhone and still have internet….
Anything above 2076.71 will invalidate several hourly wave counts. Most of us do not expect that level to be exceeded…
I drew this last night. Something to ponder…
As one wise person opined…”The trend is your friend!” Take care… 🙂
There is no trend in this market. FLAT FOR THE YEAR 2015.. 😉
There is ALWAYS a trend my friend; it simply depends on your time-frame…hope you have a great time of relaxation… 🙂
oh and I follow energy so it took me years to master market direction based on sectors. Just saying. CHK on a tear 😉
verne, john and olga,
I am taking off in my cab now and won’t be back until around sometime in 2016. Market is going higher and sideways as I originally predicted. Stats don’t mean anything, trend lines don’t mean anything. Euphoria dominates. The BULL MARKET is here to stay. So, think about that today at the awesome closing print…
Happy holidays!
All the best for the new year options 2014…
thank you you too – I dont drink but toast for the past month with you on this blog mattey! So, just one thing. what is your target for this correction up 2070-2100ish? please explain. I am on my iPhone and still have internet….
Christmas Eve Trading stats
ES Daily Test of the bottom line of the upper channel should happen this afternoon
Testint on the SPX HR ……….$TRIN is at .44
ES Daily testing now too Hmmmm
Gaps
I’ve got very small degree 5 down 3 up from the days high at the moment. End of this wave b up (if that’s what it is) seems about as easy to find as Lord Lucan but it’s all good fun.
Initially confirmed below 2055.81 (I have that as end of wave b – we are in wave c up now) – invalidated above todays high
the search (and RSI divergence) continues
Look for UVXY to fill gap from yesterday’s close at 27.65.
SPX now also getting cozy with underside smooch of 200 dma at 2061.00 Would like to see it edge a bit higher toward 2070 for my final dump…maybe tomorrow?
The VIX futures are remaining subdued: XIV not rising inline with the market today TVIX non falling
Yep. Volatility signaling a top is forming. I have been steadily picking up calls on the run to the upside. UVXY heading North…
Ditto – I’m still being quite cautious, but UVXY action today is supportive so far.
Currently averaging 28 so a bit underwater
No worries…averaging 30…
verne, olga and john,
Sometimes our own views are insightful..
A couple days back I said:
have a great day!
!!!!!!!!!!!!
!!!!!!!! Euro close should be interesting
SPX at the Middle BB
Resistance holding price down for the moment
John,
what is really crazy is the candle sizes. Just look at how crazy they look. I am not sure what to make of that. Seems like a drift sideways. I sure wish Springhill wouldn’t have taken time off this week. He could have commented on his site as well..
SHJ is very good ………..The candle action is HFT in action !
i can’t comment on SHJ overall as I dont know his past calls for more 4 months. But he seems to be hit or miss with his calls and 50/50 from what I have seen.
verne, olga, john,
You probably want to look at northman trader on twitter. He has some very interesting charts. he doesn’t do elliot wave but has a very comprehensive technical analyst outlook. I used to have his subscription but not anymore as I dont do futures anymore. Something to keep as a gist of market direction….
laters….
DJI has kissed the underside of the 200 dma in what may be an absolutely classic prelude to a swan dive. SPX sporting a shooting star on the five minute chart….could be saying “ciao” from a distance…. 🙂
nothing is going to happen until we break SPX 2,000.
I’m out – done packing. This is going to chop around and close flat for 2015. No point to look at it. Unless we get a meltdown which you already know the BANKSTERS won’t let happen 😉
later…
200 dma and 2.618*a at 2053 seems to have pushed it back for now – we’ll see if it stays that way.
If we get a small 5 down and 3 up now I’ll be all over it
Olga,
You mean to the down side?
you really a truly very bearish. You ever write down what you think and see if it plays out? Or try virtual trading on the side? This market is tricky…
ES HR Skinny black line now support
The !TRIN is averaging around 0.60 which is bullish :Over 1.00 starts to be bearish
The $TRIN measures up Vol vs Down Vol + Advance /decline ratio.
As I type price fell below the thin B L : Perhaps we will slowly ride the line up
well seems like spring hills target 1980 is not going to happen anytime soon. That is the problem with channels they dont always work. Hard to make calls on just trend lines….
This pop today looking like a massive head fake. It comes with pathetic volume and a market trading “heavy”- even in the absence of determined selling it is having difficulty making headway. Was Europe supposed to bring the bulls running?
It looks as if Buy the Dip; Sell the Rip… Still in play…
verne and olga
Follow the DAX – the S&P is nothing alone. The DAX is the direction of the S&P imo.
take care….
Most times that is true, but the tape today is definitely looking sickly…I still have a few upside hedges in place but I am very close to dumping all long positions…I smell a rat…
NDX above 200 dma
DJI at 200 dma
SPX lagging’
Either SPX punches through along with DJI to maintain the upward push or the the Santy rally dies an early death. The action in Europe point higher…A green print today of VIX or UVXY, whatever the market does, means this move up is done.
what about russell 2000? It can’t be ignored.. Looks like a triple bottom about to go higher across all indices…
Vix hit my target 16 by today and over shot. 😉
ES hr Thin black line could be resistance for some unknown reason but otherwise the thick black dashed line looks like the target…….Is this the Christmas rally? What qualifies something as a rally?
As mentioned before : stats for no Christmas rally are very bearish
ES HR FIB support for the moment
Traditionally, the rally has always been viewed as resulting from robust Xmas sales and would come in the second half (which I guess we are in ) of the month after report of sales data. I am thinking a final “kiss goodbye” of the 200 dma is in the works.
It is in the same area as Lara’s cyan resistance line and would probably make the case for a minute two up underway. Not sure how robust sales have been so far but the last I heard is not as robust as last year.
Europe much higher so same thing in store for US market in all probability. Futures up almost 0.5 %
For bull count it means minute two of minor three continuing toward invalidation point of 2076.72
For bear leading diagonal idea sub-min b of minuette five of minute one headed toward same invalidation point.
Alternate impulses for the bear are:
1. Minute two up after a truncation of minuette five of minor one, to an invalidation point of 2104.27
2. What I assume would be sub-min 2 of minuette three down, again invalidated at 2076.72
Finally a possibility that intermediate two is continuing higher in minute three up of minor C, invalidation 2134.71
Probably on the sidelines today for final run-up.
Sorry, meant truncation of minuette five on MINUTE one.
Before I officially take time off.
What is a market? Buyers and seller I thought?
Well not really, in this MARKET ONLY BUYERS DOMINATE..
How many more saves, how many more swings up. How many more years?
What is going on ? Computers are in control?
ANOTHER tight range. Another triangle possible. This is getting beyond funny!
Vix crushed 20% in 2 days lol. You don’t need to be an expert on Elliot wave to know based solely on that The spx is not going down before near New Years or 2016.
Sideways enjoy…
Gap filled at high of 2042.74
Closing SPX gap from Friday’s close ( 2041.89)…getting quite close and will probably close by the close… 🙂
it already filled
bye
2100-2134.71 just call it a year… bull market lives on…..
looks like a killer tripple bottom on spx LOL
till 2016…..
Unloaded some upside hedges. Market makers are driving trend changes at the close to keep traders off balance. Tomorrow will be interesting to be sure…bye’ all…
Now in area of fourth wave of one less degree, a possible reversal area. If we continue higher into close probably looking at around 2050.00- 2065.00
Magic, V is for recovery.
I’m taking 2 weeks off this price corrective action is annoying….
See ya in two weeks…again… 🙂 🙂
See ya enjoy time with family
c (of b up) = 2.618*a at 2053. Divergence on RSI so not sure it will make it that far.
Perhaps the top of the base channel (currently around 2046) will stop it.
i give up – this is a crazy market….
Looks like reversal already underway…
All
Very lightly volume with very little down movement. Happy Christmas week and new years. We would all be lucky to drop to 2000 or 1980. Probability favors the bulls to keep it here at 2020+. Im not looking at the screens. Unless something happens “A FUND” or something goes bust things can be delayed till 2016. Don’t hold your breath for a drop here on 7 days left for 2015….imo waste of energy.
Cheers!
We have broken the down channel shown on Lara’s hourly bear chart. In the video she indicated this was important to watch. It means we are in one of many possible corrections at various degrees. So the picture from a week to week viewpoint is still up in the air.
Thank you Rodney! That is insightful! Sometimes I just get glued with the analysis but those videos are very helpful!
Rising triangle (black line) Maybe a break out coming
Broke up …..but these robots are tricky
70% of all breakouts fail
Oops ……..there is a wedge there
Waiting for someone to pull the rug
I missed this: SPY gap filling
Those etfs are just coincidence. It happens all the time just remember that’s based on spx movement not the other way around. There is a break away gap at 2040s on the spx just zoom in.
I don’t put that much energy anymore following etfs. Just follow the index.
If it gets filled it’s probably not a break-away gap. They generally do not get filled…and certainly not so soon…
It sure looks like that’s where it’s headed. Steep decline in UVXY suggesting a second wave up underway…
Well I hate to say I told you so 2040 was my target.
i doubt it. the only rug that gets pulled is on the bears….
I have nothing useful to say to day……I am just annoyed my the choppy action .
Yeah sure seems odd. That guy springhill jack was looking for 1980 but bailed out due to holiday. He has had some decent calls probably 50/50 on market direction when I have looked at his work.
Action pretty much in line with the wave counts with one key curve ball. SPX did on Monday the exact same thing it did in September and that is end an impulse with a truncated fifth. It completely screwed up my trading plan and made me as mad as a hornet when I realised what had happened. This upward move again caught me a bit off guard as it did the exact same thing. DJI made a quick new low, SPX was truncated. I am not sure what to make of this anomaly and really hope it does not continue. Could be due to algo trading gone completely wild….
b waves should correct at least 90% of the a wave so this move should probably go higher. If it stalls today we could be seeing a shallow second wave instead…
Last high might have been wave b of iv – still poss have wave v to go
Vern, Olga, John, Ben–I always appreciate your comments on wave direction and counts etc, especially as Lara is on well deserved vacation.
And options2014–well lets be honest, you may not be an EW guru but I do enjoy your enthusiasm.
I know we are all going to greatly miss Lara. Thankfully she has given us a great road map to consult during her time off.
I’d be very suprised if Lara doesn’t quietly log in every so often to ensure her ‘children’ don’t go too far astray 😉
Indeed! 😀
Well Davey the market sure seems to favor my calls. Ew or not 😉
7 days left they should be able to keep it in the range and we consolidate! I said 2020-2040 max pain up and here we are I’m open to 2060-2070.
Oh and I said Vix could get crushed to 16 by wed and here we are Tuesday at 17. I think that’s a remarkable call …
Good luck matey!
Davey
I’m not a day trader either I think that’s gambling.
So let’s be positive. Haven’t seen any of your work lately would be delighted to chime in on your views if you have any.
Options–I am not a day trader so I don’t have much to say about daily action. I’m here primarily for Lara’s expertise but do appreciate hearing running commentary by others on the EW options Lara provides.
Oh o.k. Well learning EW in itself takes years to master. I just got a couple books – you can probably look into that if you want…
We had a slight new low in DJI yesterday unconfirmed by SPX (truncation?) ahead of the current upward correction…
Either minuette two of minute three for the bull count, or sub-min b of minuette five zig-zag for leading expanding diagonal bear count continuing higher…
verne
Probably nothing happens till jan 2016 at most 2000 or 1980(that would be to much to ask here)
On what aspect of the wave count are you basing that decision?
I am using a combination of ideas. Mostly seasonality and bullish bias along with updated wave counts. 1-2 waves here….I dont see a third wave….
There isn’t enough trading to move the markets. Just look at this mess…
No volume – no volatility – no point of watching this …
later
I agree this does not look like a third wave up. Too much overlapping.
I am leaning toward the leading diagonal. If so we should get sub-min wave c down to the 1976 area followed by a very deep second wave to end the year with a Santa Rally…of sorts….
Agreed – I have us in wave iv of c of Sub min b up with a 1.618 target of 2037
If correct, c down should start after one more small push higher for wave v, though this wave iv might go sideways for a short while. I have end of wave i of c at 2017.25 – once we are below there c down should have started (provided we have 5 up)
Verne
What is the deep second wave target for the year end with ew ?
All
Look at the volume today. What a joke! Must be bullish..
Your chart does not show Monday’s volume which was about 600 million I think it is showing last Friday’s volume of about 1.8 billion
stock charts doesn’t update properly. NYSE is my data feed.
Verne,
We are probably sitting for another couple of months for this to play out.
Google this:
how long do market corrections last?
Answer:
25% of these corrections over the last 66 years occurred during the 1970’s (the Golden Age of Market Timers), another 20% occurred during the secular bear market of 2000-2010. * The average decline during these 27 episodes has been 13.3% and they’ve taken an average of 71 days to play out (just over three months).Aug 20, 2013
I am not sure what relevance that has to, or influences the trading plan of anyone relying on EW analysis.
The decline time horizon can be pro longed…
Looks like fourth wave not quite done. Should conclude intra-day tomorrow followed by five down. Upward correction for minuette or minute two will probably close out the shortened trading week…volume muted…
I dont think we go anywhere UNITL the DAX is done doing its good old head fake tricks. I read Chris Kimble’s work and he mentioned months back the S&P and DAX have a strong correlation. Look at the DAX today. Up ~3% then slammed lower -1% LOL
Of course the last 15 minutes of trading to push this market ever so higher. How could I miss that LOL. This game is so fun!
FULL FAITH AND CREDIT HERE IN THE STATES! MERRY XMAS!
MIRACLE BUYER OF LAST RESORT NEVER FAILS THE US MARKETS!
We could have seen micro four and five of sub-min five down to complete minuette one down for the bull count. Minuette two cannot exceed 2076.71 if this count is correct. For the bear count, it would be for minuette five down with minute two up underway…
i dont think we can go that high. Where would the buying come from?
The market didn’t just make 2 HUGE Bearish engulfing candles to get wiped out the following week.
The S&P could be trying to make a doji by the close today. It still going to have tons of work to do to bust higher….
I agree. The upwards movement looks unconvincing. It is possible the fourth wave is still in progress…The next wave down at minuette or minute degree will take out 2000 when it arrives. Until then, we are still in correction mode…2022.90 should be exceeded if the correction up is real…
Interesting…DJI made very slight new low today, diamond ETF (DIA) did not…banksters buying the latter in all probabbility…
This thing is going to fall out of bed. It is having a hard time going up….
Give it 2 months we should have closure…
This game is honestly getting annoying….
market stalled… grind sideways till we drop!
Verne
I think this could very well just drop to 1770-80 the weekly 200 DMA…
Eyeing Dec 24 expiration SPY 199 puts for clues. Now trading for under a buck. Should pop to at least 1.25 today if market makers sniff a break of SPX 2000.
Next key level is 1976.13 as this will distinguish between an impulse or a diagonal for the wave down. A strong reversal just past 1976.13 and retrace up past 1993.26 would make a leading expanding diagonal and very deep upward retracement likely.
Still waiting for a break of DJI 17,000 and SPX 2000 to pile in…otherwise, caution is warranted….
well put matey!
Verne
Looks very unstable. Usually corrections are sharp and fast in my experience. So it seems like its not going to wait for Santa 😉
Sloppy price action. Looks like it is fading. But you never know these days…
Nice fade then buy back. Good old tricks…
Verne
When you get a chance later today – How does the price action look so far today? Still expect more upward movements ? Or do you think a revisit to 1993 is still here today?
What is really interesting is OIL. Down -1.5%
Not sure if they can keep brushing that off…
Could be a perfect time for a rotation into commodities
possibly – just getting crushed.
OT , X ……….When do these stocks go up? X is at a 20 year low
Commodities due for a bounce. Cycle lows still ahead though.
Magic, V is for recovery.
That V got thrown out the window at this point of the day ….
What does Lara refer to when saying her directional arrow is pointing up for monday. Don’t remember her using that term before and what is it based on.
Look at her wave counts. They all expect corrections upwards, with the exception of the bullish alternate.
The alternate bear count in which intermediate two is incomplete expects the deepest retracement above 2116.48
The bull counts differ in that we are in either minuette three down or minuette five down (the alternate) for the impulses. For the bear count, minute one down is labelled as a leading expanding diagonal and we are looking at an abc down for minuette 5 five, with sub-min b up unfolding today.
Sorry guys, the bull count actually has us in minor three down. There are two degrees of labelling for the bearish count that sees us in either minuette three or five down, with one (the latter) being a possible leading expanding diagonal as opposed to an impulse down.
If they manage to get the VIX down to 16 by this Wed. Watch out we may get a rally….
1993 out of the cards today and seems likely the next few days. What a bear trap….
Key level for Monday is 1993.26
Until it is broken both bear wave counts expect upwards movement.
The first bear count expects sub-min b of minuette five to reach as high as the 2070 area (invalidation 2076.71).
The alternate bear count sees minute two down of Minor C completed on Friday, with minute three up to above 2116.47
(invalidation 2134.71) starting today. This would complete an unfinished intermediate 2 up.
The bullish count sees minuette one of minute three down completed on Friday with minuette two up to as high as the 2050 area starting today. Invalidation is again 2076.71
How high the corrections goes will tell us which is the more likely count to be correct.
Watching from the sidelines for the reversal.
I expect it to be brutal.
Futures up around 0.75 % so far…
Good summary Vern!
Nice summary. Good to be on the sidelines for this one.
Yeah, they sure pulled a good thrust up today. I thought maybe we could gap down and pop but that didn’t happen – the tape should be boring slow this week with an upward bias given the thrust this AM and seasonality. Probably the best pin is at 2050-2060. Vix expiration this week should push it down to 16 by Wed…
Second that…good summary Vern,
Verne
Gap down -20 handles on Monday perhaps then buy the dip after Europe closes?
Thank you Lara!
Thank you for the full analysis. Have a fabulous holiday Lara!