
Yesterday’s analysis expected a downwards trend should be assumed to remain in place while price remains below 2,093.84.
We have another strong downwards day to complete another bearish engulfing candlestick pattern. This fits the Elliott wave count.
Summary: A downwards trend is still expected to be in place while price remains below 2,093.84. The middle of a big third wave down is still expected to begin sooner rather than later and the target remains the same at 1,850. All wave counts bar one expect downwards movement short term.
To see how each of the bull and bear wave counts fit within a larger time frame see the Grand Supercycle Analysis.
To see last analysis of weekly and monthly charts click here.
If I was asked to pick a winner (which I am reluctant to do) I would say the bear wave count has a higher probability. It is better supported by regular technical analysis at the monthly chart level, it fits the Grand Supercycle analysis better, and it has overall the “right look”.
New updates to this analysis are in bold.
BULL ELLIOTT WAVE COUNT
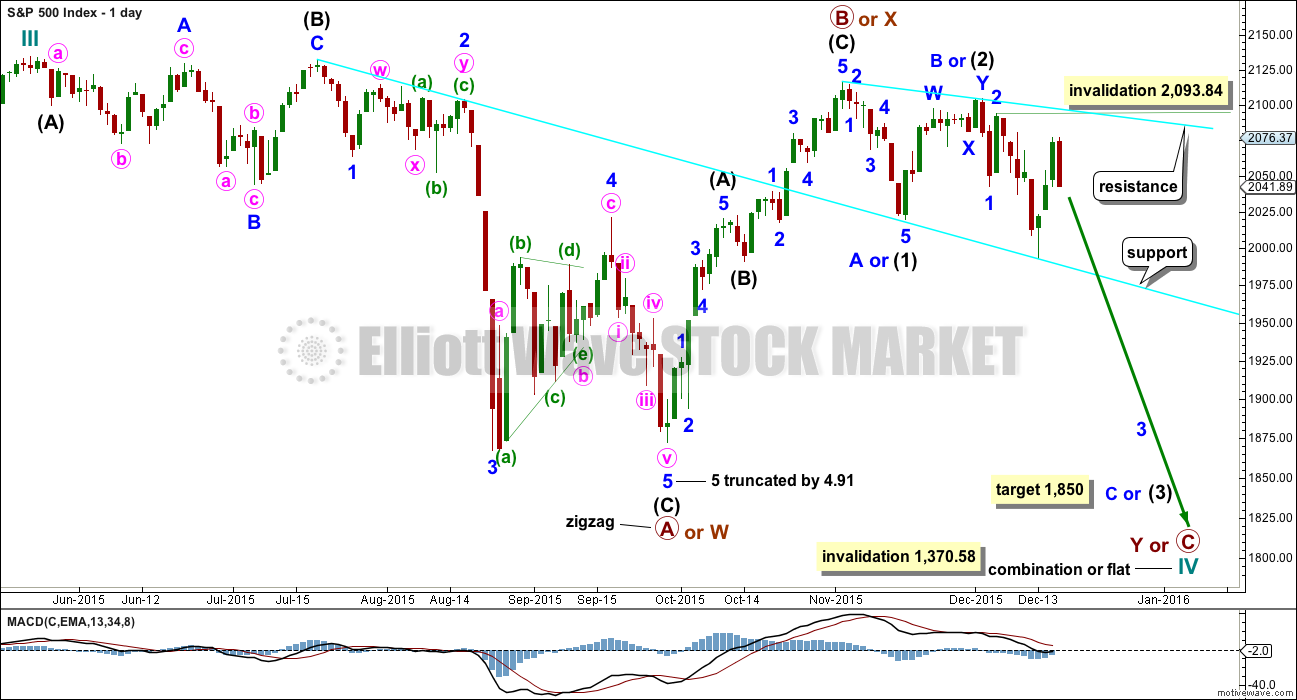
DAILY CHART – COMBINATION OR FLAT
Click chart to enlarge.
Cycle wave IV should exhibit alternation to cycle wave II.
Cycle wave II was a shallow 0.41 zigzag lasting three months. Cycle wave IV should exhibit alternation in structure and maybe also alternation in depth. Cycle wave IV may end when price comes to touch the lower edge of the teal channel which is drawn about super cycle wave V using Elliott’s technique (see this channel on weekly and monthly charts).
Cycle wave IV may end within the price range of the fourth wave of one lesser degree. Because of the good Fibonacci ratio for primary wave 3 and the perfect subdivisions within it, I am confident that primary wave 4 has its range from 1,730 to 1,647.
If a zigzag is complete at the last major low as labelled, then cycle wave IV may be unfolding as a flat, combination or triangle.
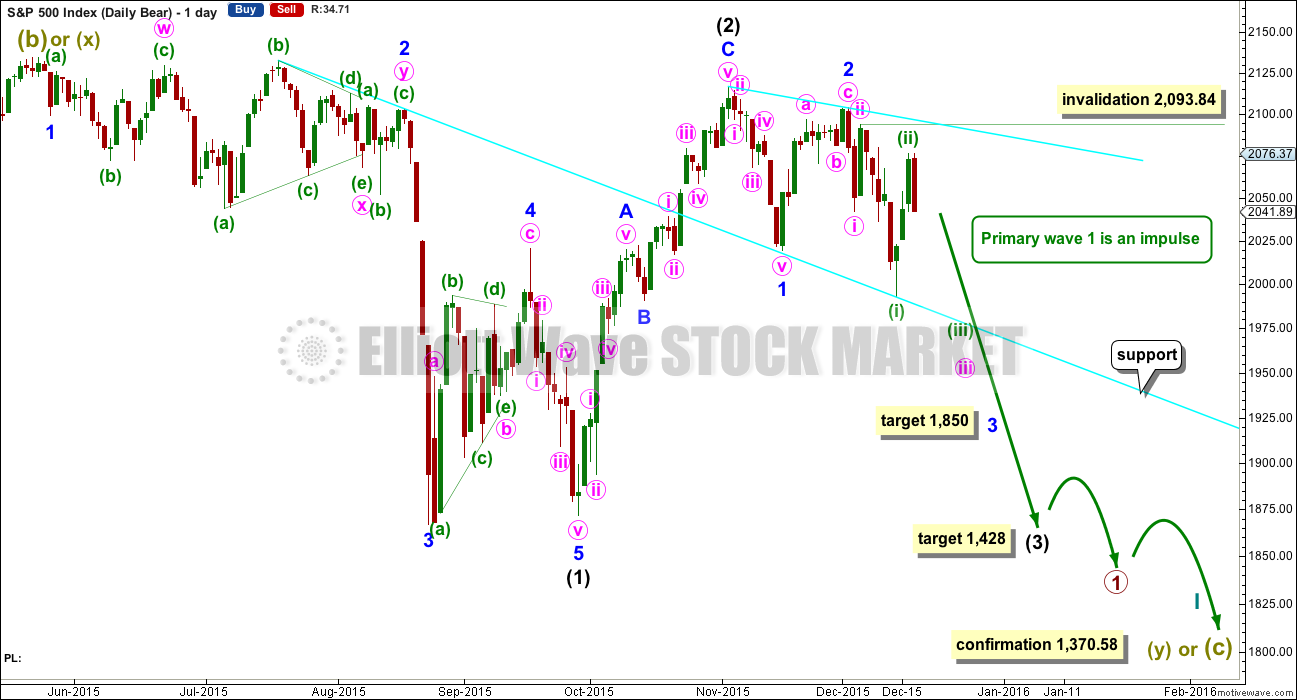
Primary wave C should subdivide as a five and primary wave Y should begin with a zigzag downwards. This downwards movement is either intermediate waves (1)-(2)-(3) of an impulse for primary wave C or minor waves A-B-C of a zigzag for intermediate wave (A). Both these ideas need to see a five down complete towards the target, so at this stage there is no divergence in expectations regarding targets or direction.
Primary wave A or W lasted three months. Primary wave C or Y may be expected to also last about three months.
Within the new downwards wave of primary wave C or Y, a first and second wave, or A and B wave, is now complete. Intermediate wave (2) or minor wave B lasted a Fibonacci 13 days exactly. At 1,850 intermediate wave (3) or minor wave C would reach 2.618 the length of intermediate wave (1). At this stage, this will be the sole target for this third (or C) wave to end as it fits better with more short term targets calculated at the hourly chart level.
No second wave correction may move beyond the start of its first wave above 2,093.84 within minor wave 3.
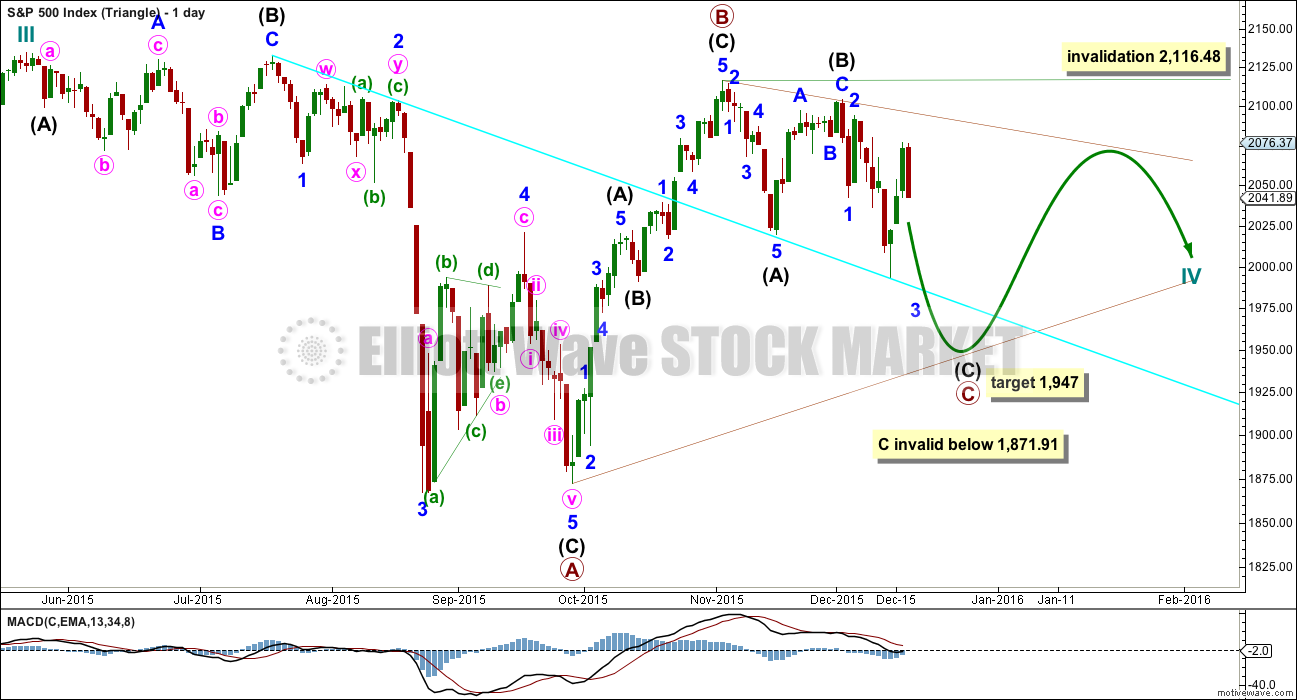
DAILY CHART – TRIANGLE
Click chart to enlarge.
Cycle wave IV may unfold as a shallow triangle. This would provide alternation with the 0.41 zigzag of cycle wave II.
Primary wave B may be a complete zigzag. Primary wave C downwards may be underway and within it intermediate waves (A) and (B) are complete.
The whole structure moves sideways in an ever decreasing range. The purpose of triangles is to take up time and move price sideways. A possible time expectation for this idea may be a total Fibonacci eight or thirteen months, with thirteen more likely. So far cycle wave IV has lasted six months.
The target for primary wave C to end is 1,947 where intermediate wave (C) would reach 1.618 the length of intermediate wave (A).
HOURLY CHART
Click chart to enlarge.
Hourly charts again are the same.
BULLISH ALTERNATE WAVE COUNT
Click chart to enlarge.
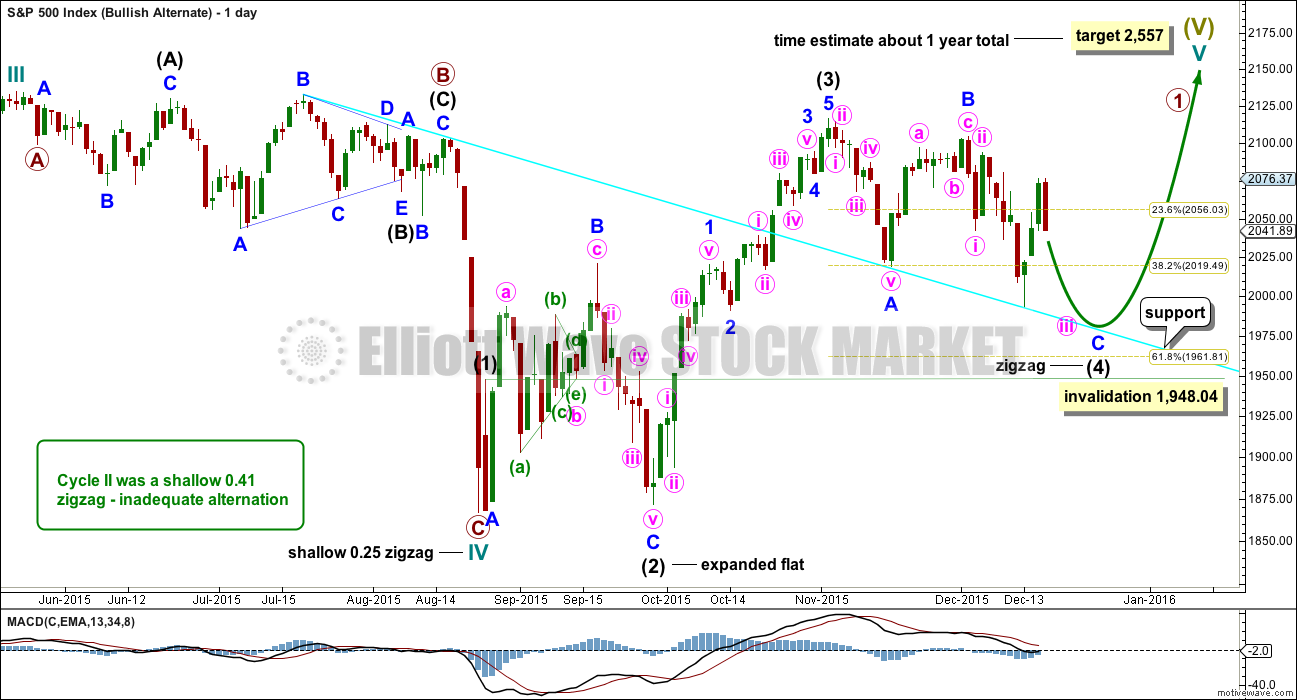
I can again see the possibility that cycle wave IV is over and upwards movement may be the start of cycle wave V.
If cycle wave IV is over, as labelled, then there is inadequate alternation between cycle waves II and IV. Cycle wave II was a shallow 0.41 zigzag. Here, cycle wave IV is a more shallow 0.25 zigzag. Both are the same structure.
If cycle wave V has begun, then primary wave 1 within it may be an incomplete impulse. At 2,557 cycle wave V would reach equality in length with cycle wave I. If it also is the same in duration as cycle wave I, then it may last a year.
Intermediate wave (2) was a deep 0.94 expanded flat within primary wave 1. Intermediate wave (4) would be an incomplete zigzag which would also be relatively deep when it is complete. Minor wave C must complete as a five wave impulse downwards. Intermediate wave (4) may not move into intermediate wave (1) price territory below 1,948.04.
Intermediate wave (4) would be unfolding as a big zigzag. Within intermediate wave (4), the structure of minor wave C is incomplete and must complete as a five wave structure. It may be unfolding as an ending expanding diagonal. The fifth wave must end below 1,976.13, so that it is longer than the third wave and meets the rules for wave lengths of an expanding diagonal. It may find support at the cyan trend line.
This wave count does not have any support from regular technical analysis. I do not have any confidence in it. It is presented as a “what if?” only, to consider all possibilities.
BEAR ELLIOTT WAVE COUNT
DAILY CHART
Click chart to enlarge.
This bear wave count has a better fit at Grand Super Cycle degree and is better supported by regular technical analysis at the monthly chart level. But it is a huge call to make, so I present it second, after a more bullish wave count, and until all other options have been eliminated.
There are two ideas presented in this chart: a huge flat correction or a double flat / double combination. The huge flat is more likely. They more commonly have deep B waves than combinations have deep X waves (in my experience).
A huge flat correction would be labelled super cycle (a)-(b)-(c). It now expects a huge super cycle wave (c) to move substantially below the end of (a) at 666.79. C waves can behave like third waves. This idea expects a devastating bear market, and a huge crash to be much bigger than the last two bear markets on the monthly bear chart.
The second idea is a combination which would be labelled super cycle (w)-(x)-(y). The second structure for super cycle wave (y) would be a huge sideways repeat of super cycle wave (a) for a double flat, or a quicker zigzag for a double combination. It is also possible (least likely) that price could drift sideways in big movements for over 10 years for a huge triangle for super cycle wave (y).
The downwards movement labelled intermediate wave (1) looks like a five. If minor wave 2 is seen as a double zigzag with a triangle for wave X within it, then the subdivisions all fit nicely.
Ratios within intermediate wave (1) are: minor wave 3 is 7.13 points short of 6.854 the length of minor wave 1, and minor wave 5 is just 2.82 points longer than 0.618 the length of minor wave 3. These excellent Fibonacci ratios add some support to this wave count.
Intermediate wave (2) was a very deep 0.93 zigzag (it will also subdivide as a double zigzag). Because intermediate wave (2) was so deep the best Fibonacci ratio to apply for the target of intermediate wave (3) is 2.618 which gives a target at 1,428. If intermediate wave (3) ends below this target, then the degree of labelling within this downwards movement may be moved up one degree; this may be primary wave 3 now unfolding and in its early stages. Today, I have considered the degree of labelling by looking at the monthly chart and decided that this degree is most likely correct. This is still primary wave 1 incomplete. Considering how low this bear market should go, that looks right.
Within intermediate wave (3), minor waves 1 and 2 are complete. The upwards movement for minor wave 2 does have a strong three wave look to it at the daily chart level. Minor wave 2 was another deep correction at 0.87 of minor wave 1. At 1,850 minor wave 3 would reach 2.618 the length of minor wave 1. If price falls through this first target, then the next Fibonacci ratio in the sequence is 4.236 which would be reached at 1,693. If minor wave 3 is very extended, then the degree of labelling for all downwards movement from the all time high will be moved up one degree.
It is still possible (but still less likely) that primary wave 1 is unfolding as a leading diagonal. I will keep that chart up to date and will publish it if and when it begins to diverge from the idea presented here. For now I want to keep the number of charts published more manageable.
A line from the ends of intermediate wave (2) to minor wave 2 is drawn. This line may show where any further upwards movement finds resistance.
The invalidation point on the daily chart will now be the same as the hourly. Minuette wave (ii) may not move beyond the start of minuette wave (i) above 2,093.84.
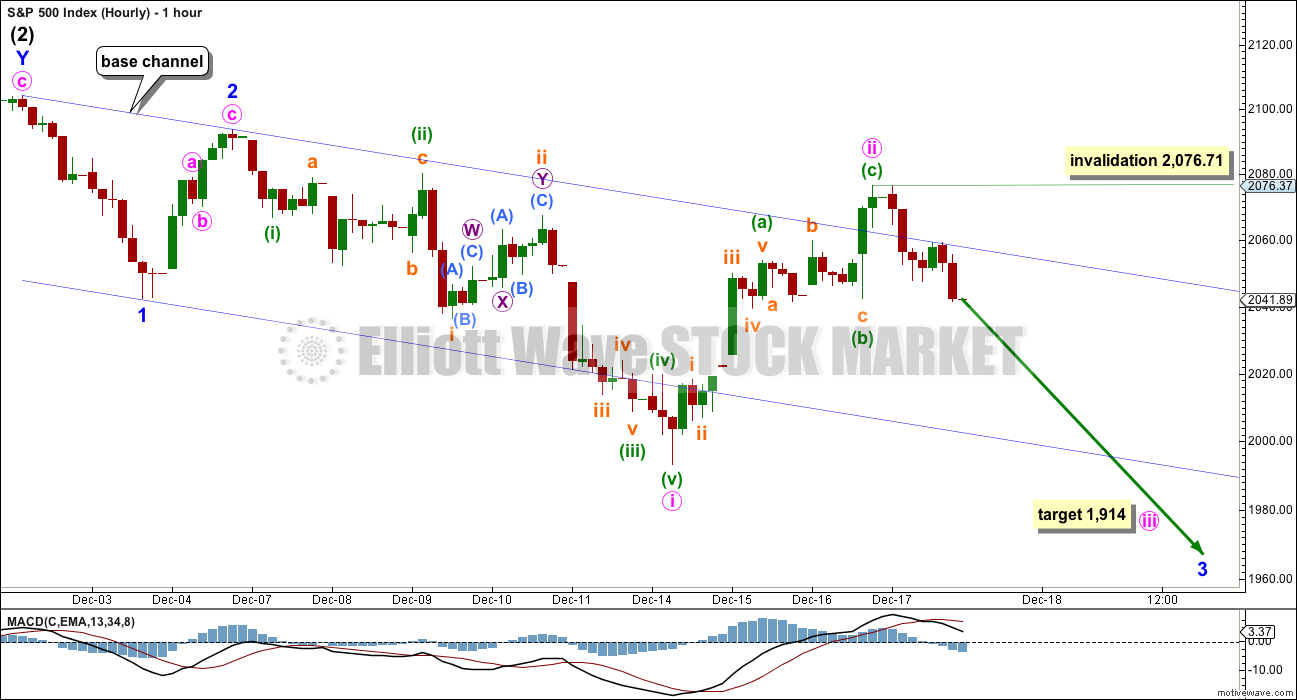
HOURLY CHART
Click chart to enlarge.
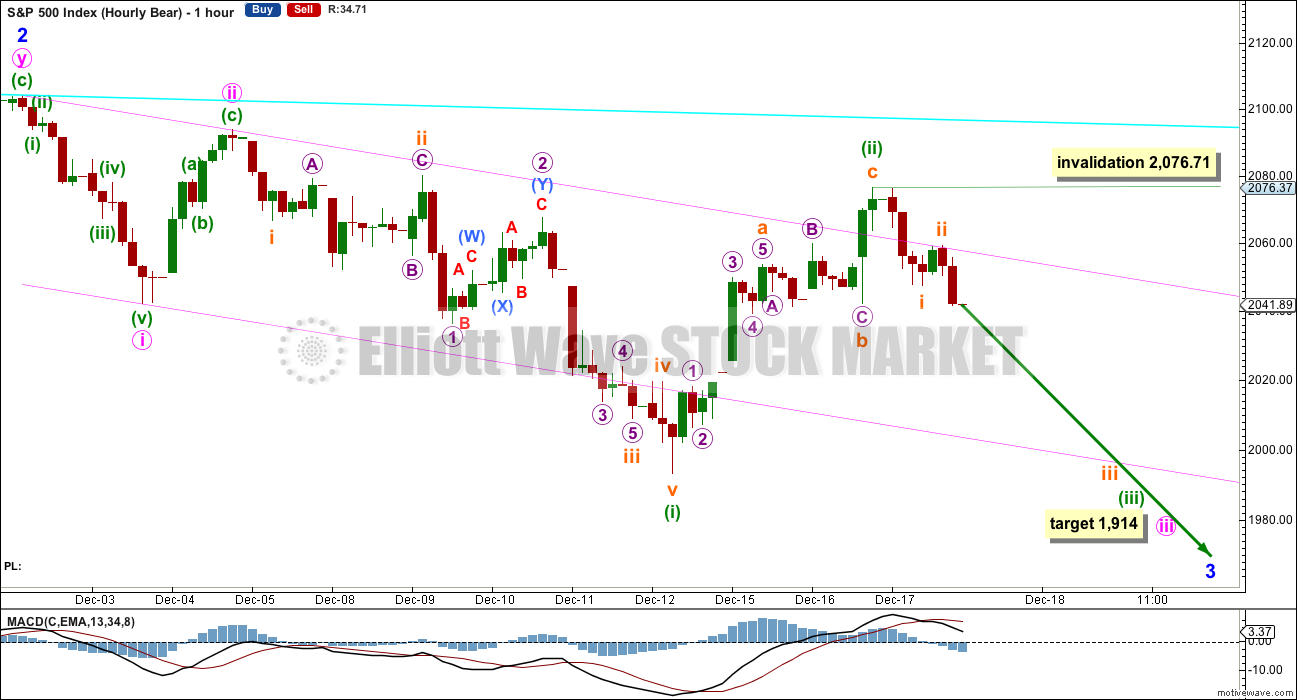
The base channel about minor waves 1 and 2 is breached by a full hourly candlestick. Base channels often work, but not always.
At 1,914 minuette wave (iii) would reach 1.618 the length of minuette wave (i). If this target is passed, the next Fibonacci ratio is 2.618 which would be reached at 1,813.
The channel drawn about minuette wave (ii) on yesterday’s hourly charts was breached by downwards movement indicating an end to minuette wave (ii) and the start of minuette wave (iii). On the five minute chart, so far subminuette wave i subdivides well as a five wave impulse (with an extended fifth wave) and subminuette wave ii as a zigzag.
Downwards momentum should increase, if this wave count is correct. Upwards movement is again finding resistance at the upper edge of the base channel about minute waves i and ii.
No second wave correction (if subminuette wave ii continues or if it has not yet begun) may move beyond the start of its first wave above 2,076.71 within minuette wave (iii).
ALTERNATE BEAR ELLIOTT WAVE COUNT
DAILY CHART
Click chart to enlarge.
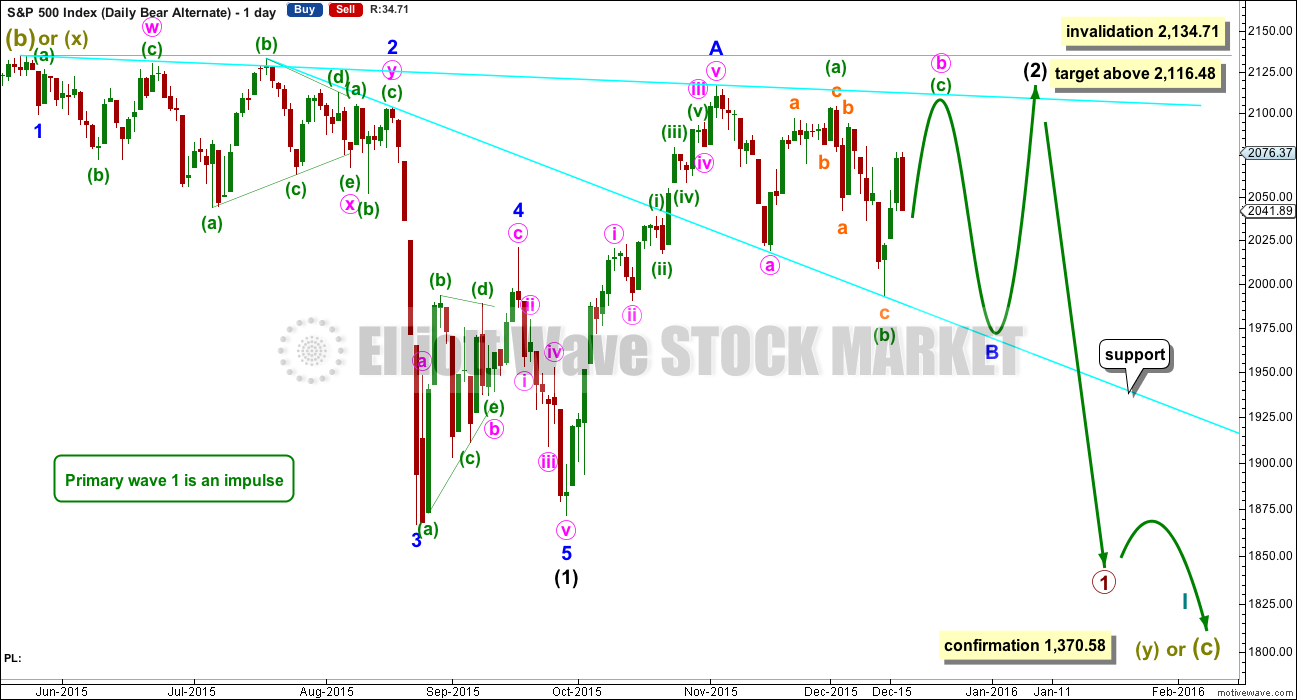
Intermediate wave (2) may not be over. It may be continuing further as an even deeper zigzag.
The degree of labelling for the wave up here labelled minor wave A has been moved down one degree. This move is ambiguous on the hourly chart, and on the daily chart it does have a better fit as a five wave impulse than it does as a zigzag.
If that wave up was a five, then intermediate wave (2) may not be over.
Minor wave B may be continuing as a flat correction.
Minute wave b may be an incomplete expanded flat and upwards movement may be a C wave to complete it. This would be extremely likely to make at least a slight new high above the end of minuette wave (a) at 2,104.27 to avoid a truncation and a very rare running flat.
Thereafter, a five down to make a new low below the end of minute wave a at 2,109.38 would complete the expanded flat for minor wave B. That downwards move may again find support at the downwards sloping cyan trend line.
Finally, another wave up for minor wave C to move above the end of minor wave A at 2,116.48 would unfold to complete a zigzag for intermediate wave (2).
This idea is entirely valid. It would expect big choppy overlapping movement for several weeks yet to complete a very deep time consuming second wave correction.
Intermediate wave (2) may not move beyond the start of intermediate wave (1) above 2,134.71. That is the final invalidation point for any bear wave count. Any movement of any amount at any time frame above that point would invalidate the bear wave count.
SECOND ALTERNATE BEAR ELLIOTT WAVE COUNT
DAILY CHART
Click chart to enlarge.
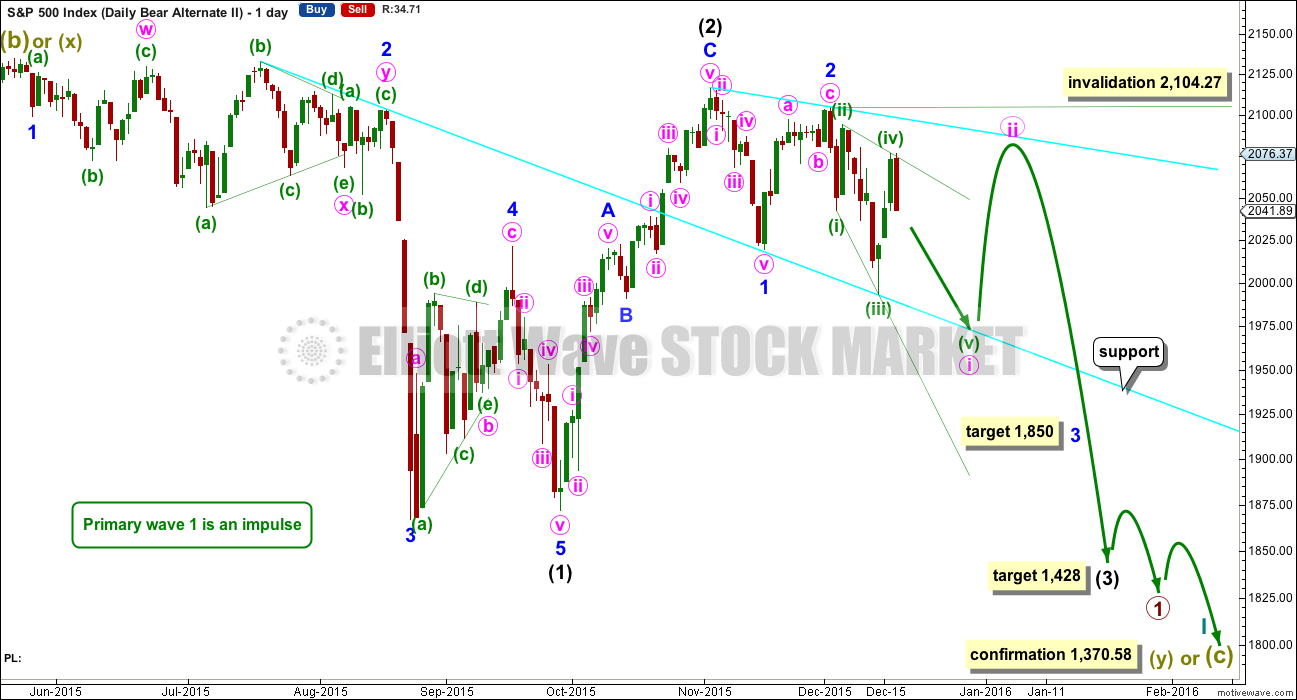
This second alternate idea is the same as the first main bear wave count up to the high labelled minor wave 2.
Overlapping movement of the last eleven days may be a leading expanding diagonal for a first wave. This nicely explains the overlapping and support at the cyan trend line.
The diagonal would be expanding. The fifth wave of minuette wave (v) must end at or below 1,976.13, so that it is longer than minuette wave (iii) and meets the rule for a fifth wave of an expanding diagonal. Furthermore, fifth waves of leading diagonals may not be truncated, so it must make a new low below the end of minuette wave (iii) at 1,993.26.
When the next wave down is complete, if it ends below 1,976.13, then this idea may be the main wave count.
Second wave corrections following leading diagonals in first wave positions are normally very deep. When the leading diagonal for minute wave i is complete, then the upwards correction for minute wave ii would be expected to be deeper than 0.618 the length of minute wave i. It may end when price again finds resistance at the new cyan trend line.
Minute wave ii may not move beyond the start of minute wave i above 2,104.27.
The target for minor wave 3 is the same. Just the pathway to get there is different.
TECHNICAL ANALYSIS
Click chart to enlarge. Chart courtesy of StockCharts.com.
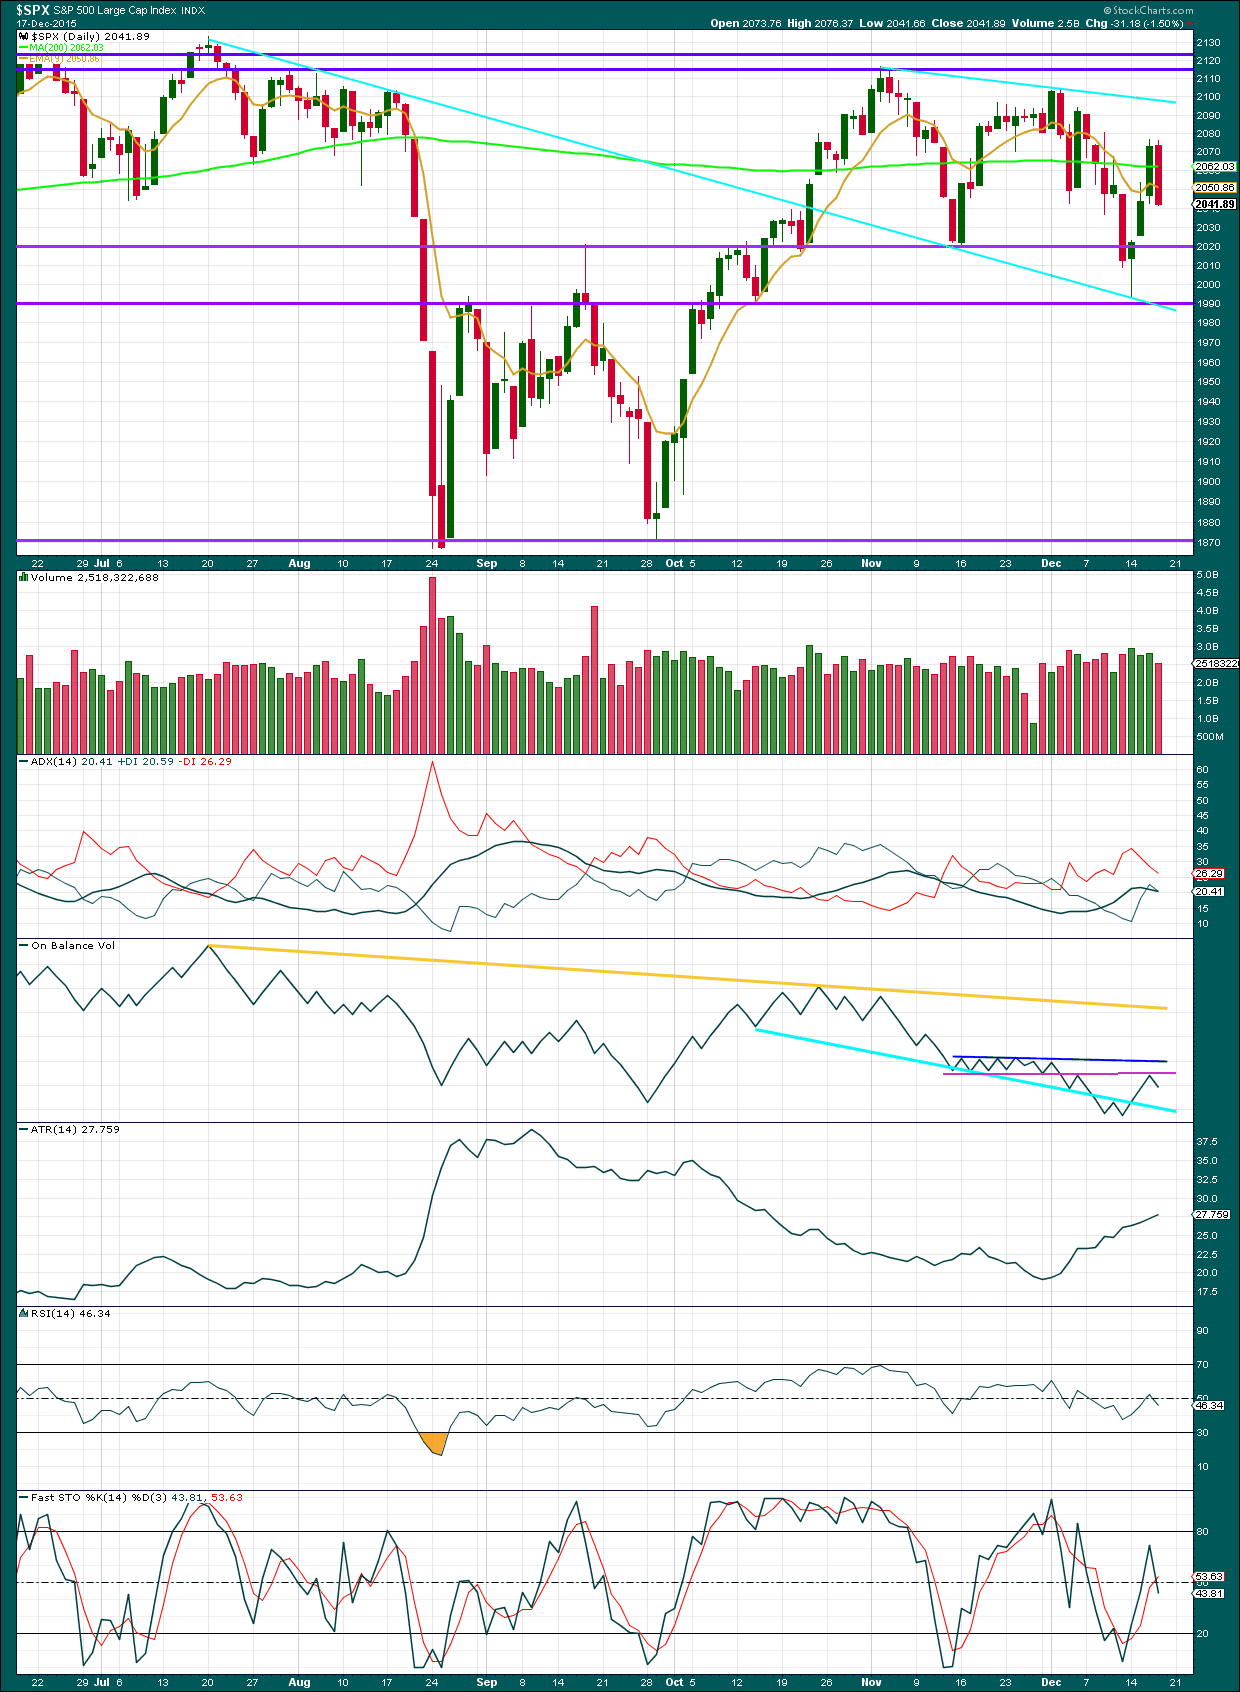
StockCharts finalised volume data after yesterday’s analysis was published. Yesterday’s rise in price had some support from volume. The first day of rising price was the strongest and the three days of upwards movement did end on slightly lighter volume. The volume profile up to that point is slightly more bearish than bullish, but only slightly.
Of further concern today is lighter volume for a strong downwards day. Volume does not support this fall in price. This is the reason for the two new alternate bear wave counts, which may fit the volume profile better.
Overall though, since the high of 3rd November, price has made lower highs and lower lows. The -DX line is above the +DX line, so if there is a trend developing, then it would be down. Price has closed below the 200 day moving average again. Price action is more bearish than bullish, and at the end of the day it is price which is most important.
Price can fall on declining volume; the market can fall of its own weight. This is because an absence of buyers can push price lower. Price does not need greater volume of sellers to achieve the same outcome. Rising price on lighter volume is more suspicious than falling price on lighter volume.
There is a bearish engulfing candlestick pattern at each of the last swing highs on the daily chart: at the high of 3rd November, 2nd December, and now 16th December. The bearish engulfing candlestick pattern is the strongest bearish reversal pattern. With three now in a row, that is very bearish indeed and should be taken seriously.
The ADX line is still flat to declining, so no trend is indicated at this time. ADX is based on a moving average though, so it does tend to be a lagging indicator. ATR is increasing which indicates a new trend.
On Balance Volume is a fairly reliable leading indicator. It is again bearish today. OBV has found resistance at the pink trend line. The strength of that line is reinforced. OBV may next find support at the cyan trend line.
RSI is still closer to neutral. There is plenty of room for this market to fall.
DOW THEORY
For the bear wave count I am waiting for Dow Theory to confirm a market crash. I am choosing to use the S&P500, Dow Industrials, Dow Transportation, Nasdaq and I’ll add the Russell 2000 index. Major swing lows are noted below. So far the Industrials, Transportation and Russell 2000 have made new major swing lows. None of these indices have made new highs.
At this stage, if the S&P500 and Nasdaq also make new major swing lows, then Dow Theory would confirm a major new bear market. At that stage, my only wave count would be the bear wave count.
S&P500: 1,821.61
Nasdaq: 4,117.84
DJT: 7,700.49 – this price point was breached.
DJIA: 15,855.12 – this price point was breached.
Russell 2000: 1,343.51 – this price point was breached.
This analysis is published about 09:38 p.m. EST.
I wish I had seen this yesterday: SPX stopped just short of the weekly & monthly pivot. The tail on the last weekly candle on this chart was from Monday .
There are trading boards Princetontrader , Art of the chart , Channels & patterns for example, who place a lot of weight on the this pivot point and see the break of it as a bear signal and vice versa if it holds
A couple of possible channels………….made a higher low on the week
SPY Daily : Possible channels
Looking at the indicators suggest the channels won’t hold unless the Monday morning futures turn things around
Re ‘Dark Pools’ Copy and paste this: twitter.com/HFTAlert
Today across the S&P! 😉
hi
All
Have a great weekend. Season Greetings to all!
Cheers!
According to WSJ money flows for today- 1.4 billion went into SPY on the BUY side. This is a huge amount in an effort to get the fed selloff under control. Monday will be interesting.
I saw that. It was spooky as it happened this morning…
That’s interesting. If the volume was for the buy side then it completely failed. Price fell hard.
I notice todays volume after StockCharts have finalised their data is very high. My conclusion would be that this supports the downwards move in price very well indeed.
But if that high volume for today was not actually for selling, but for buying, that puts a different spin on it.
That was a pretty good downwards day.
Don’t get distracted. We know this is going to get crushed down. STICK WITH THE PLAN GUYS! STAY FOCUSED. Have a great weekend!
I saw something similar : There is a twitter poster pro that has feeds that show “dark pool” buy/sell activity, and he commented on HIGH buying activity ,which got me thinking there was a turn coming, ………………..which was wrong
Nevertheless, Monday will be interesting
So far on the hourly chart I can see what may possibly be a complete impulse downwards. The fourth and fifth waves just completed.
This indicates S&P may bounce from here.
The leading diagonal will be charted on the hourly for you all.
This next analysis will have to see you all through the next two weeks while I’m on holiday. So there will be a LOT of charts to digest, and a long video. I may not get it all done today, I want to take enough time to make it thorough. But it will be done.
Yes indeed. Hope everyone took intra-day profits. Go grow some gills and turn those arms into wet noodles; we will try to muddle along pending your return… :_(
Hi Lara,
Thank you for your patient, clear, and concise communication of Elliott Wave principals.
As someone who is very new to the study and practice of Elliott Wave, I find your posts and the posts of the other members incredibly valuable.
Have a wonderful Holiday/surfing vacation!
Thank you very much.
We have some fantastic members here! I expect you’ll all support each other for the next couple of weeks, or better yet, take a holiday too.
We shall all come back refreshed and rejuvenated. Ready for great profits to be made next year
All
I just ran the weekly from when I first joined and guess what. The Head and shoulders is playing out on the weekly. Albeit the week isn’t over. Just saying 😉
MACD Ready to Cross over down – yessss!
I’ll like to see DJIA decisively break 16933,
VIX scream higher,
S&P break 2000 and stay below it…+….get up in the morning consistently and Dow futures be down 300, then is gonna feel like 3rd of 3rd of 3rd of 3rd
Yep! Yep! Yep! A time to watch out for banksterism… 🙂
BTW…I like the head and shoulders thesis
thank you Jack!
Gotta run; if this market gives so much as the slightest hint of printing any green today, get ready for a final manic run up to 2100. Take care all!
WE ARE not going back up – NO JINX. The analysis of the bearish engulfing comment by Lara yesterday was confirmation we are going lower matey!
I am 99% confident!
No need to be in doubt here. Lara’s work is just amazing! I am signing up for 5 more years 🙂
Be careful. The decline is being contested and may display as a deep second wave correction for a leading diagonal. Anyone going short at the close is likely to wake up on Monday to stratospheric futures. I am praying to the God of all the universe that it is thus. It will present the opportunity of a lifetime…you know what to do…. ‘Bye… 🙂
I think we have a bit more room to fall 10-25 points before a meaningful bounce. The CLOSE was just fantastic and even if we do the BULLS have to much work to do to get it back up. Given we only have 6-8 trading days left in 2015. I think we will stay at most near GOLDMAN SACHS target of year end 2000 at most. They have a reputation to keep up 😉
Plus the hourly has more room to fall. We are barely touching the bollinger band.
cheers matey!
The VIX closed really bullish. It hit resistance today pulled back a little but still closed with a bullish candle. It is trying to expand the bands here. We should get continuation or just grind here….
Hey Verne, do we have to reach below 1976.13 before the leading diagonal is complete and we can begin a big 2nd wave? Or are you thinking of a correction within wave 5 of the diagonal? Thanks
I’ll be putting that idea on an hourly chart so you can all see the detail of it.
That should make it clearer.
I want to read Laras final thoughts this weekend to gauge how high. Shouldn’t be to much. To much technical damage done here…
2020-2040 possibly – I doubt it – Not worth chasing long.
DJT support at 7500 demolished. This market should be heading South and not looking back. I think there are some massive block buys behind the scenes to try to forestall the decline and the market is still trading “heavy”. We really need to take out DJI 17000 and SPX 2000 before I am “all in”.
A sudden 100 + drop will tell us the jig’s up…
So far today it is a tale of two tails
That’s a nice evening doji star there
Got a very strange signal from something I keep an eye on. Look out for a bankster ambush. If we retrace more than 50% of today’s decline, make sure you are properly hedged or take profits early….
Either three or five down. Three should take out 2000 very decisively.
A couple of speculative black dashed lines that could cause interferance
Vern, When trading options, are you subject to the same kind of chop we get in stocks?
It depends on the expiration time frame. For near dated options the volatility can actually be amplified; for longer dated one it’s more muted.
Pre market SPY short term indicators suggest a rising morning market
I must say the prospect of a developing leading diagonal has quite a bit of appeal. Futures also lending credence to what may only be an upcoming fifth wave. I would not be surprised to see the fifth wave down complete either intra-day or at the close so Mr. Market can do what he does- fool the most folk. I am playing this with bearish call credit spreads to try and catch the possible retracement for minute two as I suspect it will catch most people on the short side off guard….as usual! 🙂
Happy holidays Lara!
Thank you for all your work and for letting us use this page to share ideas and learn.
I look forward each day to reading the posts here.
Best wishes!
Thank you John, and to you too!
Thank you from myself and all other members for sharing your charts and expertise with us.
May we all have fabulous profits next year! With all this experience and expertise within the membership there is every reason to be positive.
I spent most of the Thursday session focused on the VIX futures and actually missed the last hr SPX drop. But have a look and compare the candles on the SPX vs the XIV……..I would have expected a much bigger move in the XIV
Thoughts?
The T2108 represents ALL the stocks traded on the NYSE , not just the SPX
But it did not have the extreme downward movement I would have expected.
There is definitely a persistent bullishness in the market, despite all the contrary signs. VIX backwardation is certainly one evidence of that. There is also I think, a CB induced fear of shorting the market because of so much of recent history, which may also account for the relatively low volume even on down days like Thursday.
Everyone is cautious and tentative, convinced that the “working group” is going to intervene to stem any serious decline. The psychology of the leading diagonal perfectly fits the price action but I suspect that will soon change. I imagine the recent gyrations dislodged quite a few short positions and I am sure some folk holding UVXY calls were scared out of their positions by the manic run-up the last few days. It was indeed a bit unusual to have two gap up open days and not have the index go on to the blow-off spike, but instead decline to fill those gaps after just a day or two. This is why it is so important to go a few months out after a new 52 week low when first trading UVXY, unless of course you are very nimble. Because of contango, options several weeks out are still a steal, and even market orders are being filled at reasonably less then the ask price despite lop-sided bid/ask spread. XIV is going much lower…I think the next VIX spike will come AFTER a DJI decline below 17,000.00 and a similar move under 2000 in SPX.
If the leading diagonal is correct, we should expect at least one more steep re-tracement before things get really going to the downside..
Quick query Lara:
You indicated the possibility that for the first bear count sub-min two may not have started which if that were true, means the current wave label would be moved down one degree to be micro 1 and 2 of sub-min one. At what point would you have confidence which was correct?
I imagine the latter would imply a really extended minuette three down…thanx
When the next small five down on the hourly chart is complete. If it looks like another impulse then it may be a slightly longer first wave than I have it labelled. But if it unfolds as a series of overlapping impulses and corrections then I should leave the labelling as is.
Looking at it today I think I will have to move the degree down. I don’t think subminuette i is complete yet.
Thank you Lara, it has been a wild few weeks.
You’re welcome, and yes, it’s been hard to analyse this mess.
I’m looking forward to the next fall off a cliff from the S&P. That’s a little easier to analyse 🙂
Thank you. Hope you have a great Christmas….
Thank you. I will. I just LOVE Christmas. Putting up my tree tomorrow after work, and I’m so excited!
Merry Christmas to you too.