
Upwards movement fits the scenario presented for the preferred hourly bear Elliott wave count.
Summary: A third wave down is most likely in the early stages. The target is 1,997 for the short term. The trend is down. Use resistance lines to show where corrections against the trend may end.
To see how each of the bull and bear wave counts fit within a larger time frame see the Grand Supercycle Analysis.
To see last analysis of weekly and monthly charts click here.
If I was asked to pick a winner (which I am reluctant to do) I would say the bear wave count has a higher probability. It is better supported by regular technical analysis at the monthly chart level, it fits the Grand Supercycle analysis better, and it has overall the “right look”.
New updates to this analysis are in bold.
BULL ELLIOTT WAVE COUNT
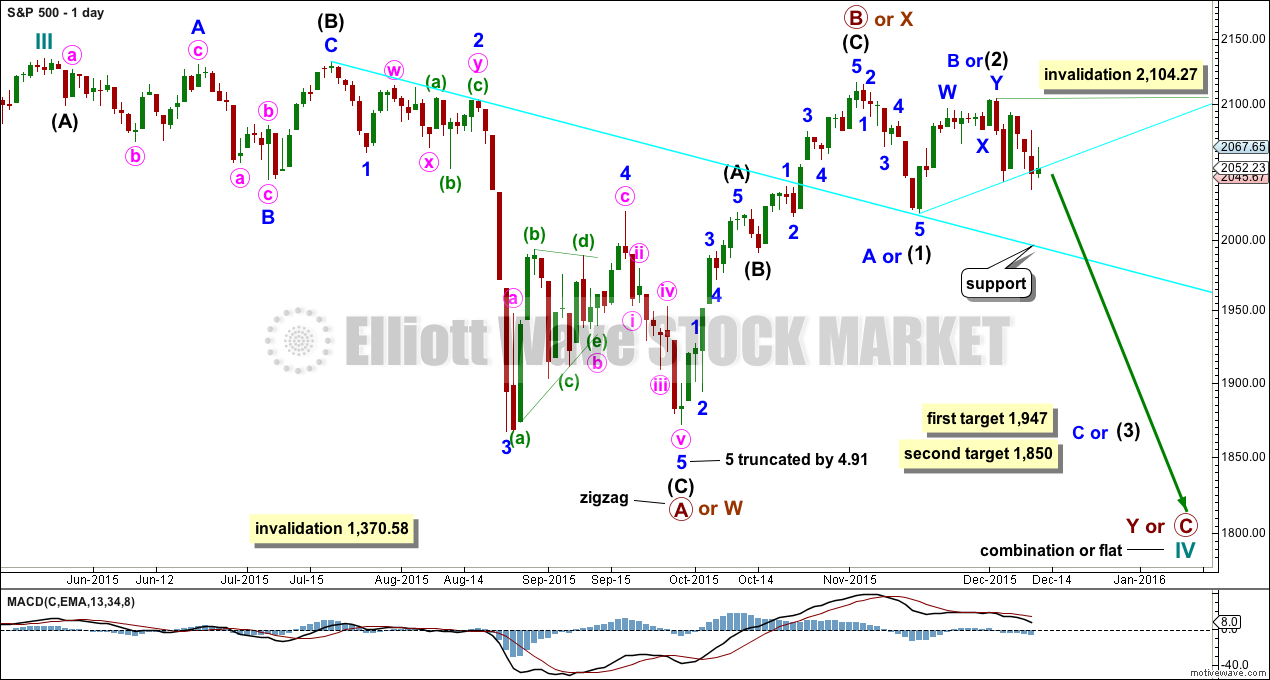
DAILY CHART – COMBINATION OR FLAT
Click chart to enlarge.
Cycle wave IV should exhibit alternation to cycle wave II.
Cycle wave II was a shallow 0.41 zigzag lasting three months. Cycle wave IV should exhibit alternation in structure and maybe also alternation in depth. Cycle wave IV may end when price comes to touch the lower edge of the teal channel which is drawn about super cycle wave V using Elliott’s technique (see this channel on weekly and monthly charts).
Cycle wave IV may end within the price range of the fourth wave of one lesser degree. Because of the good Fibonacci ratio for primary wave 3 and the perfect subdivisions within it, I am confident that primary wave 4 has its range from 1,730 to 1,647.
If a zigzag is complete at the last major low as labelled, then cycle wave IV may be unfolding as a flat, combination or triangle.
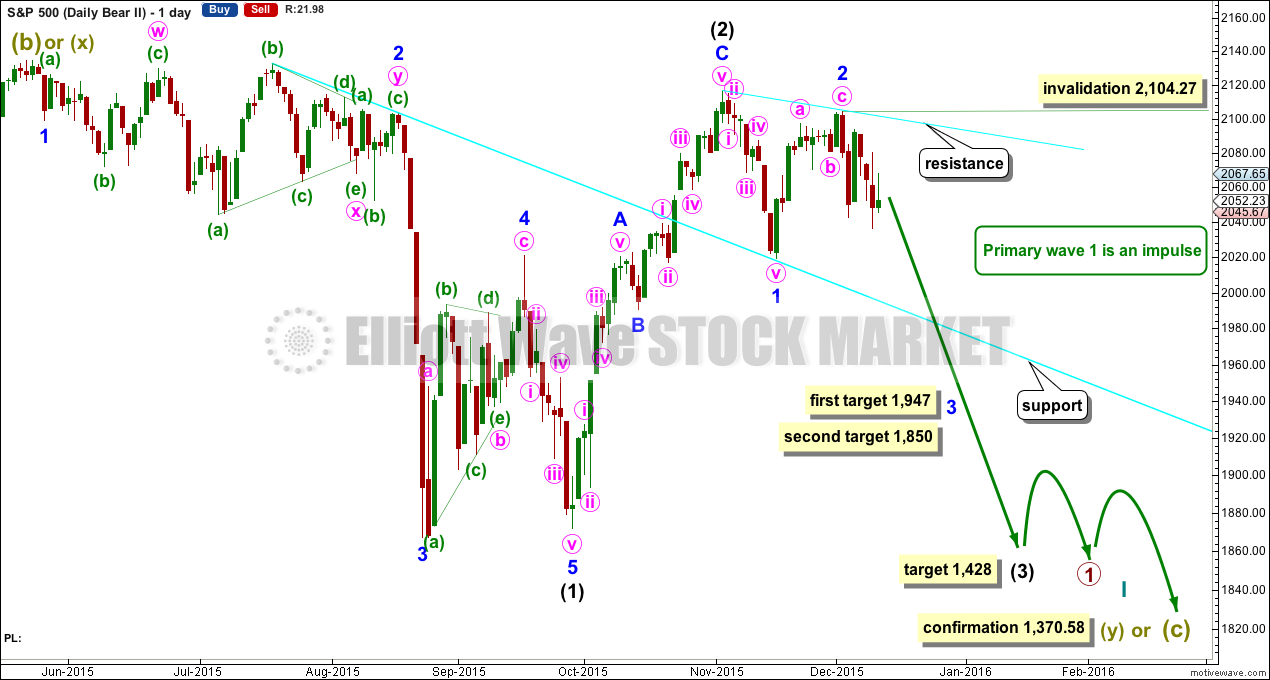
The wave count is changed today to again see primary wave B or X as a zigzag completed earlier. Primary wave C should subdivide as a five and primary wave Y should begin with a zigzag downwards. This downwards movement is either intermediate waves (1)-(2)-(3) of an impulse for primary wave C or minor waves A-B-C of a zigzag for intermediate wave (A). Both these ideas need to see a five down complete towards the target, so at this stage there is no divergence in expectations regarding targets or direction.
Primary wave A or W lasted three months. Primary wave Y or C may be expected to also last about three months.
Within the new downwards wave of primary wave C or Y, a first and second wave, or A and B wave, is now complete. Intermediate wave (2) or minor wave B lasted a Fibonacci 13 days exactly. At 1,947 intermediate wave (3) or minor wave C would reach 1.618 the length of intermediate wave (1) or minor wave A. If price falls through this first target, or gets there and the structure is incomplete, then the next target would be at 1,850 where intermediate wave (3) or minor wave C would reach 2.618 the length of intermediate wave (1).
No second wave correction may move beyond the start above 2,104.27 within intermediate wave (3) or minor wave C.
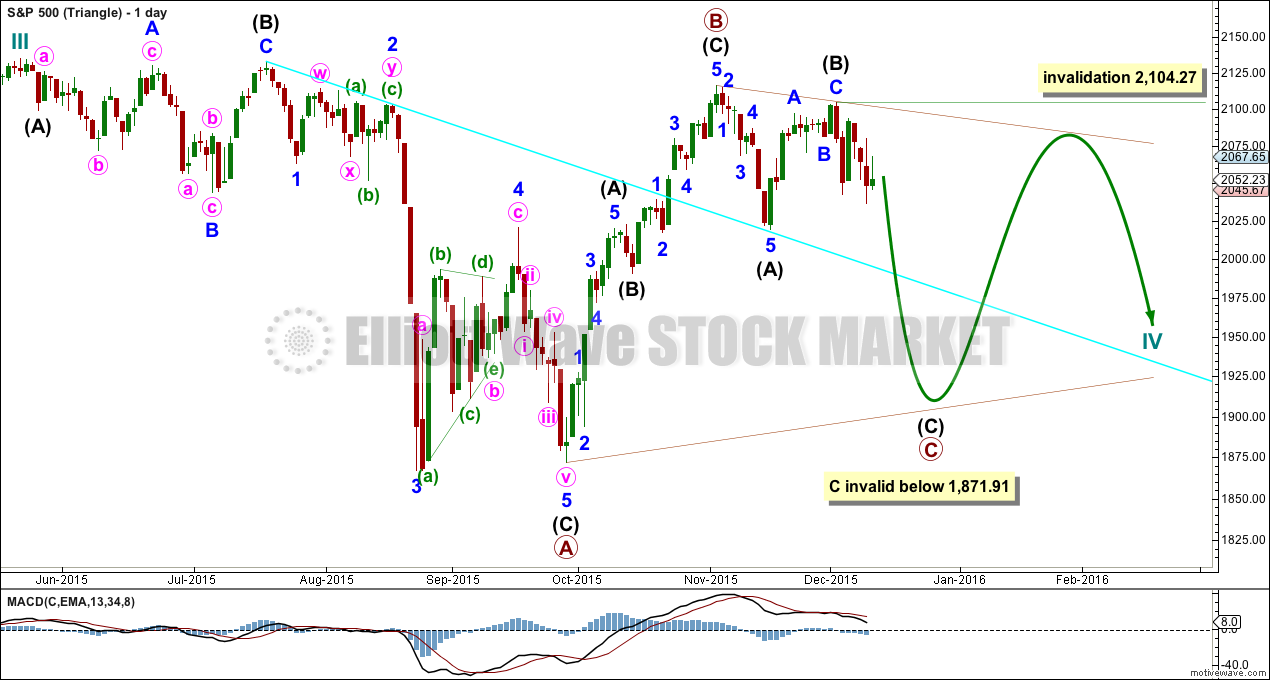
DAILY CHART – TRIANGLE
Click chart to enlarge.
Cycle wave IV may unfold as a shallow triangle. This would provide alternation with the 0.41 zigzag of cycle wave II.
Primary wave B may be a complete zigzag. Primary wave C downwards may be underway and within it intermediate waves (A) and (B) are complete. No second wave correction may move beyond its start above 2,104.27 within intermediate wave (C).
The whole structure moves sideways in an ever decreasing range. The purpose of triangles is to take up time and move price sideways. A possible time expectation for this idea may be a total Fibonacci eight or thirteen months, with thirteen more likely. So far cycle wave IV has lasted six months.
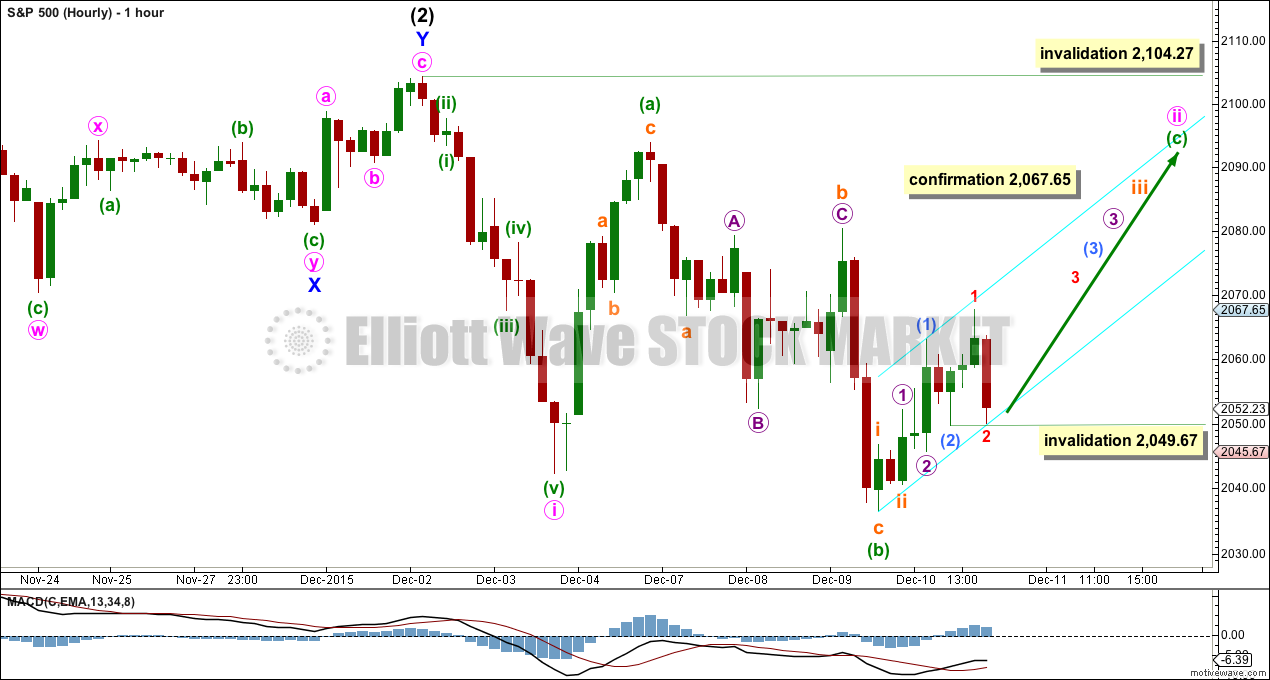
HOURLY CHART
Click chart to enlarge.
The two hourly wave counts will look at two different ways, and both work for bull and bear (the degree of labelling for this bull is one degree higher).
This first idea has a lower probability than the second idea presented with the hourly bear wave count. This idea is presented as a what if?
What if minute wave ii was not over as a quick zigzag? What if upwards movement today was the start of minuette wave (c) to complete an impulse? What if minute wave ii is continuing as a larger expanded flat correction?
Minuette wave (b) will subdivide perfectly as a zigzag. The subdivisions for this downwards movement are seen in exactly the same for both hourly wave counts. Minuette wave (b) was a 1.11 length of minuette wave (a), so the flat correction would be an expanded flat, the most common type. Minuette wave (c) has no target because if it were to reach 1.618 the length of minuette wave (a), it would end above the invalidation point, and if it were to reach only equality in length with minuette wave (a), it would be truncated.
Minuette wave (c) would be most likely to end at least slightly above minuette wave (a) at 2,093.84 to avoid a truncation and a very rare running flat.
Minuette wave (c) must subdivide as a five wave structure, either an impulse or an ending diagonal.
So far within minuette wave (c) a first wave is incomplete. Upwards movement for Thursday’s session will not subdivide as a complete five, either an impulse or leading diagonal, on the one minute chart. There is too much overlapping within the middle. It may be a series of overlapping first and second waves.
The structure within minuette wave (c) looks highly unlikely. Minuscule wave 2 particularly is too deep to have a normal look. It may not move below the start of minuscule wave 1 below 2,049.67.
Only if price moves above 2,067.65, should this wave count be seriously considered tomorrow. The scenario presented for the hourly bear wave count looks much more likely.
ALTERNATE BULL ELLIOTT WAVE COUNT
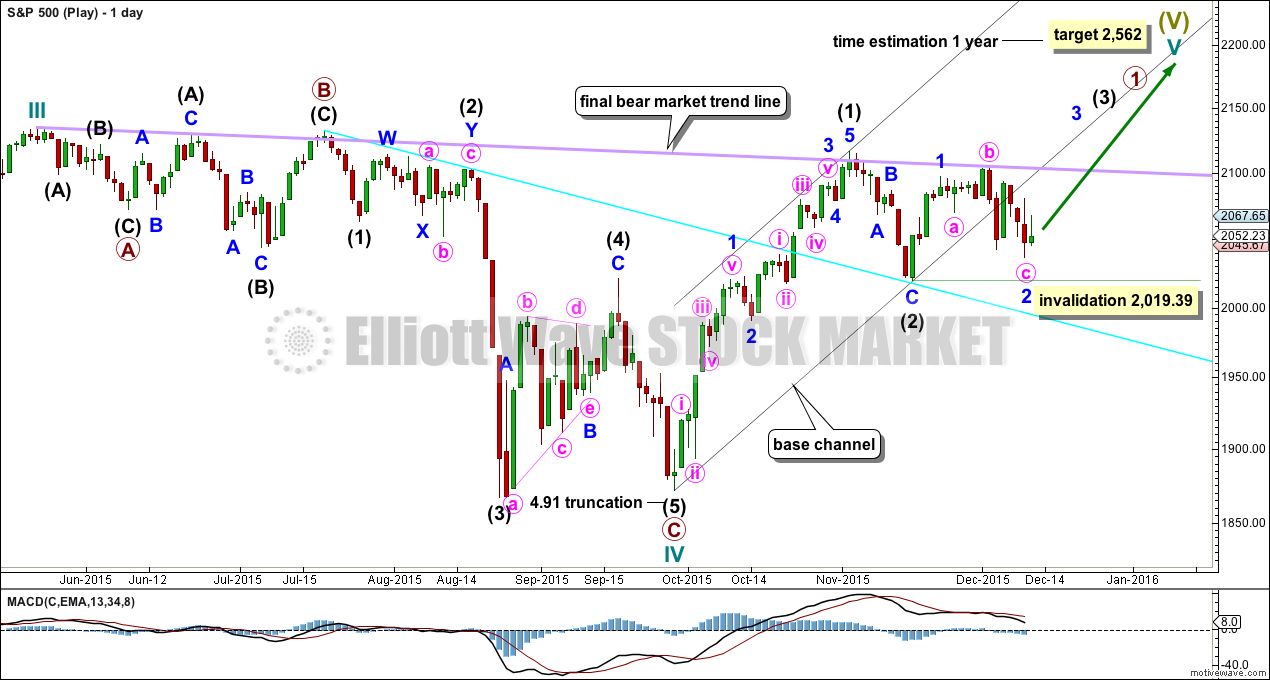
DAILY CHART
Click chart to enlarge.
It is possible to see cycle wave IV a completed flat correction. This would provide some structural alternation with the zigzag of cycle wave II.
This is a regular flat but does not have a normal regular flat look. Primary wave C is too long in relation to primary wave A. Primary wave C would be 3.84 short of 4.236 the length of primary wave A. While it is possible to also see cycle wave IV as a complete zigzag (the subdivisions for that idea would be labelled the same as the bear wave count below, daily chart) that would not provide structural alternation with the zigzag of cycle wave II, and so I am not considering it.
This idea requires not only a new high but that the new high must come with a clear five upwards, not a three.
At 2,562 cycle wave V would reach equality in length with cycle wave I. Cycle wave I was just over one year in duration so cycle wave V should be expected to also reach equality in duration. Cycle degree waves should be expected to last about one to several years, so this expectation is reasonable. It would be extremely unlikely for this idea that cycle wave V was close to completion, because it has not lasted nearly long enough for a cycle degree wave.
I added a bear market trend line drawn using the approach outlined by Magee in “Technical Analysis of Stock Trends”. When this lilac line is clearly breached by upwards movement that shall confirm a trend change from bear to bull. The breach must be by a close of 3% or more of market value. If it comes with a clear five up, then this wave count would be further confirmed.
While price remains below the bear market trend line, we should assume the trend remains the same: downwards.
Intermediate wave (1) is a complete five wave impulse and intermediate wave (2) is a complete three wave zigzag.
For this wave count, when the next five up is complete that would be intermediate wave (3). Within intermediate wave (3), no second wave correction may move beyond the start of its first wave below 2,019.39.
This wave count does not have support from regular technical analysis and it has a big problem of structure for Elliott wave analysis. I do not have confidence in this wave count. It is presented as a “what if?” to consider all possibilities.
I have added a black base channel about intermediate waves (1) and (2). Minor wave 2, one degree lower, has breached the base channel. Price remains below it so far. This further reduces the probability of this wave count. Base channels normally provide support or resistance for lower degree corrections, but not always. When a base channel is breached the probability of the wave count reduces but is not invalidated.
Minute wave c within minor wave 2 now looks like a three wave structure, but it should be a five. The probability of this wave count is exceptionally low.
BEAR ELLIOTT WAVE COUNT
DAILY CHART
Click chart to enlarge.
This bear wave count has a better fit at Grand Super Cycle degree and is better supported by regular technical analysis at the monthly chart level. But it is a huge call to make, so I present it second, after a more bullish wave count, and until all other options have been eliminated.
There are two ideas presented in this chart: a huge flat correction or a double flat / double combination. The huge flat is more likely. They more commonly have deep B waves than combinations have deep X waves (in my experience).
A huge flat correction would be labelled super cycle (a)-(b)-(c). It now expects a huge super cycle wave (c) to move substantially below the end of (a) at 666.79. C waves can behave like third waves. This idea expects a devastating bear market, and a huge crash to be much bigger than the last two bear markets on the monthly bear chart.
The second idea is a combination which would be labelled super cycle (w)-(x)-(y). The second structure for super cycle wave (y) would be a huge sideways repeat of super cycle wave (a) for a double flat, or a quicker zigzag for a double combination. It is also possible (least likely) that price could drift sideways in big movements for over 10 years for a huge triangle for super cycle wave (y).
The downwards movement labelled intermediate wave (1) looks like a five. If minor wave 2 is seen as a double zigzag with a triangle for wave X within it, then the subdivisions all fit nicely.
Ratios within intermediate wave (1) are: minor wave 3 is 7.13 points short of 6.854 the length of minor wave 1, and minor wave 5 is just 2.81 points longer than 0.618 the length of minor wave 3. These excellent Fibonacci ratios add some support to this wave count.
Intermediate wave (2) was a very deep 0.93 zigzag (it will also subdivide as a double zigzag). Because intermediate wave (2) was so deep the best Fibonacci ratio to apply for the target of intermediate wave (3) is 2.618 which gives a target at 1,428.
Within intermediate wave (3), minor waves 1 and 2 are complete. The upwards movement for minor wave 2 does have a strong three wave look to it at the daily chart level. Minor wave 2 was another deep correction at 0.87 of minor wave 1. Targets for minor wave 3 are 1.618 and 2.618 the length of minor wave 1.
It is still possible (but still less likely) that primary wave 1 is unfolding as a leading diagonal. I will keep that chart up to date and will publish it if and when it begins to diverge from the idea presented here. For now I want to keep the number of charts published more manageable.
HOURLY CHART
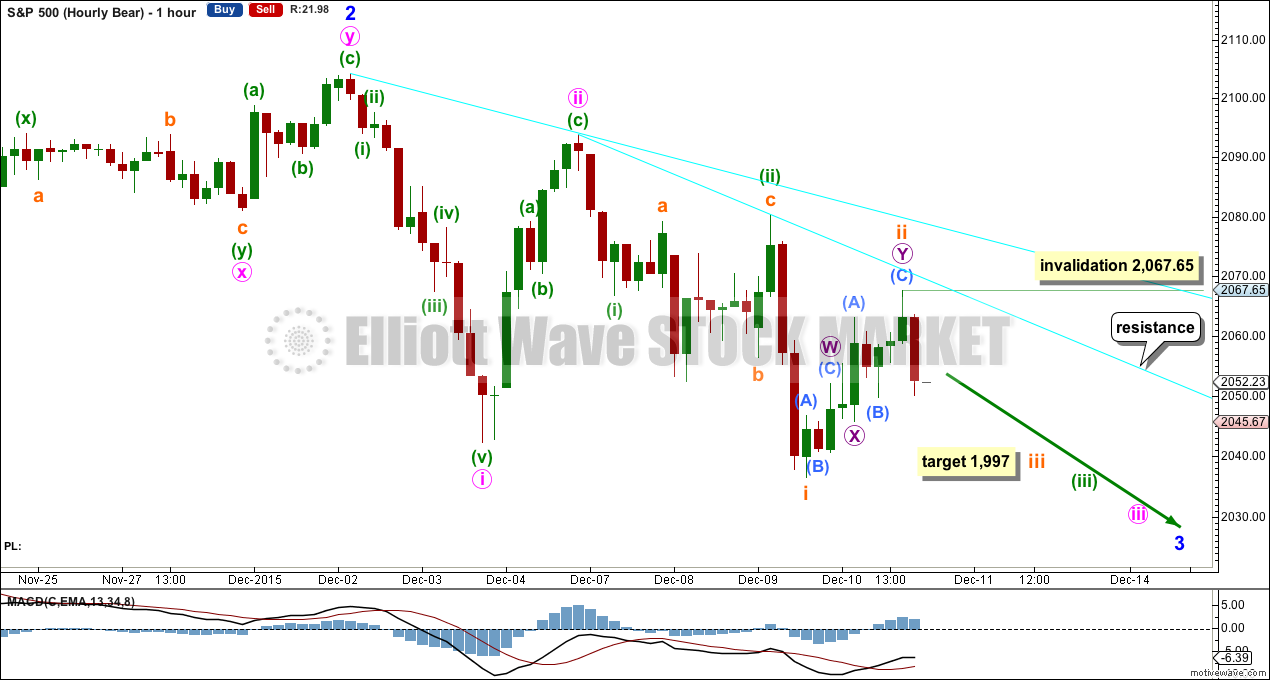
Click chart to enlarge.
This second scenario works in the same way for the hourly bull wave count.
There may now be three complete overlapping first and second waves. Subminuette wave ii continued higher and will subdivide perfectly on the five minute chart as a double zigzag.
At 1,997 subminuette wave iii would reach 1.618 the length of subminuette wave i. If this target is wrong, it may not be low enough. The next possibility would be 1,953 where subminuette wave iii would reach 2.618 the length of subminuette wave i.
Within subminuette wave iii, no second wave correction may move beyond the start of its first wave above 2,067.65.
Along the way down, upwards corrections may find resistance at the lower cyan trend line in the first instance.
This wave count expects to see an increase in downwards momentum.
TECHNICAL ANALYSIS
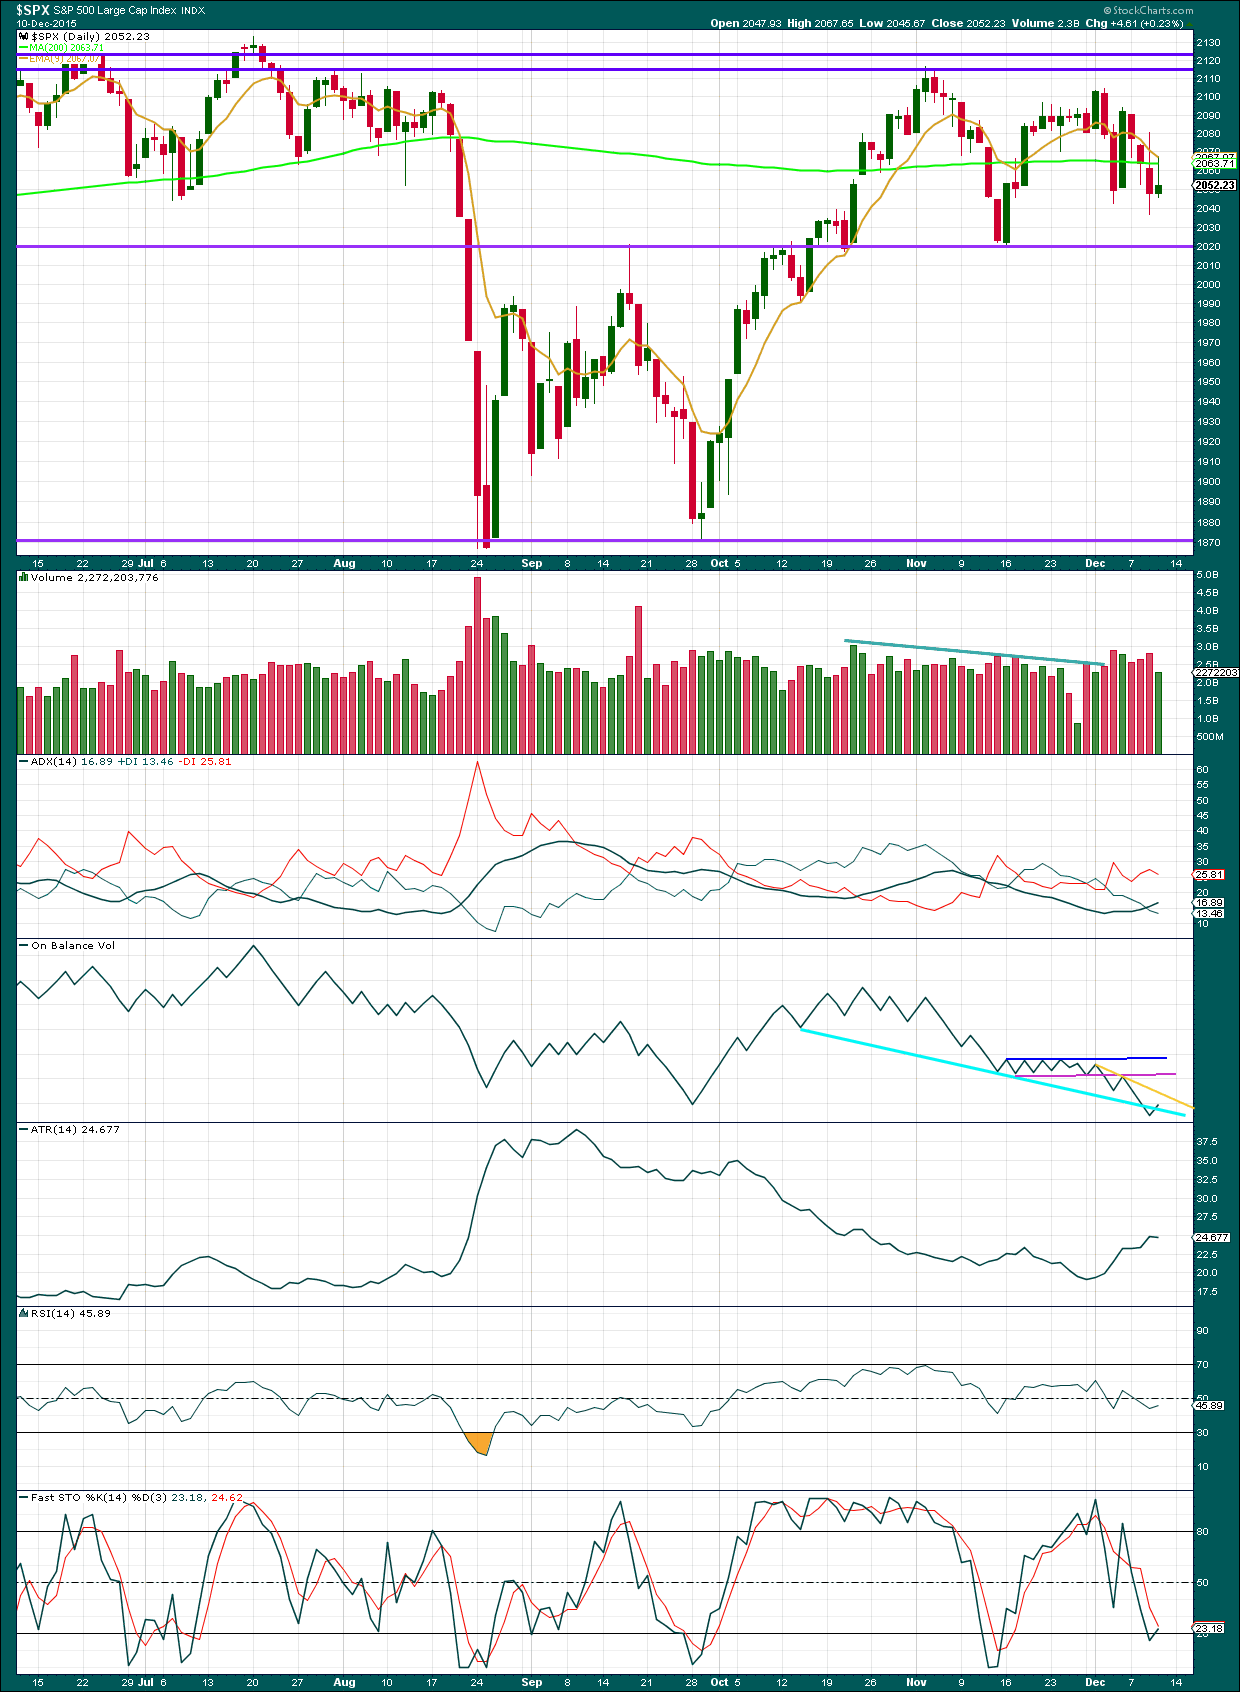
Click chart to enlarge. Chart courtesy of StockCharts.com.
Daily: Price fell for three days on rising volume, and now a green daily candlestick comes with lower volume. The volume profile is consistently bearish.
Along the way down, I would expect price to find some support about 2,020.
ADX is above 15 and increasing. This indicates a new trend may be beginning. The -DX line is above the +DX line, so the trend would be down. ATR agrees as it too is increasing.
On Balance Volume has not remained below the cyan trend line. This may only be a small overshoot, but if it continues higher tomorrow it would be a clearer bullish signal. If it does, then OBV may find resistance at the new gold trend line.
RSI is neutral. There is plenty of room for this market to fall.
Stochastics is nearing oversold, but during a trending market oscillators may remain extreme for extended periods of time.
A note on Dow Theory: for the bear wave count I would wait for Dow Theory to confirm a huge market crash. So far the industrials and the transportation indices have made new major swing lows, but the S&P500 and Nasdaq have not.
S&P500: 1,820.66
Nasdaq: 4,116.60
DJT: 7,700.49 – this price point was breached.
DJIA: 15,855.12 – this price point was breached.
To the upside, for Dow Theory, I am watching each index carefully. If any make new all time highs, that will be noted. If they all make new all time highs, then a continuation of a bull market would be confirmed. So far none have made new all time highs.
This analysis is published about 08:20 p.m. EST.
Tom Lee one of the more bullish analyst on CNBC is now bearish for 2016. Even Cramer is telling his viewers to raise cash. Personally, I continue to watch oil as a catalyst of this down move. i think we may rally a little when oil bounces and fall hard when it continues to mid/lower 20s. VIX should be a good trade since backwardation.
Zalomoon
My main point was always this massive correction is imminent. The recipe for a typical bull market was to have a SPIKE(see year 2000) at the end which would have been super nice/dramatic. Since this is an out of the ordinary maniac buy the dip bull market – 2015 alone spending most of the year putting a top in and then getting crushed into late aug tricked everyone that this looked like 2011.
The SPX fact is the MONTHLY sell signal was the KEY to navigating this market and it made more sense that Lara’s super cycle bear market was right on point.
The real question now is how much SELLING can we actually get done before 2015 is over ? We only have around 2 weeks!
Right. Odds favor a small bounce +.5-1%( I use the word bounce but this is clearly a 10-20 point move up at MAX(2030-2040). This isn’t 1998 or 2011 it is 2015. I almost got influenced it wasn’t until recently. The VIX GAP has violated the bollinger band and RSI at 67 and it is sitting right outside and its a perfect TRAP to swing option prices down temporarily and then right back up just 1-2 days later. The world is going to change from a market perspective as I stated as well since I was felling clutchy last week after Drahi JAW BONE +2% RIP. My thoughts are just Mon-Tue then DOWN HILL to well my conservative guess is 10%-15% but things always OVER SHOOT. So, as you said “Buckle UP” this is going to get real fast.
Just BREATH – ANOTHER DAY!
I would be cautious on Monday’s trade. The typical thing for both VIX and UVXY to do the Monday following a Friday like we had is gap up big at the opening. It could also be that reversion to the mean in VIX may be slower with this new downturn and we could certainly begin to see a series of higher lows in UVXY.
What a day!
The past seven years of manic bullish activity has given market participants an illusory view of the FED as an all-powerful “Lord of the Markets” . Some one recently commented on what the FED would or would not let the market do. This perception is all well and good as long as positive sentiment rules the market, during which time, the notion of an invincible FED will govern the decisions of the players. We know Elliott Wave Theory at its core is a theory about human behaviour. What happens when positive sentiment no longer rules in the market, and folk begin to awaken to the reality of the precipice we are on and the FED’s utter impotence in the face of trillions in scared capital?
Redemption of investors’ funds was recently halted from what was supposed to be a very safe mutual fund and this incident is truly symptomatic of the financial storm clouds on the horizon.
God help the FED if they don’t raise rates next week.
God help them if they do!
I would wager it was the prospect of the rate hike that caused this fund to implode. As some sage said, when the tide goes out you can see who is swimming naked.
Lara’s target for intermediate three down is 1428, so fasten your seat belts. This party is just getting started…
Great write up.
My thesis help up
Of a down move of 1-3% upto wed at which point I folded the idea.
I wrote my bear target for this Friday and we cut right through it 🙂
My guess is that we could bounce mon – tue next week and goto 2030-2040.
Bring the Vix down slowly to the gap fill at 18 and create a huge wick hammer and then sell off after wed.
Your comments on this Verne ?
Entirely feasible as gaps (except break-away gaps) do tend to get filled. I think any bounce in the near future is going to be a huge shorting opportunity. Strange for me to say that since so often in the recent past when we all felt sure the market should continue South it would suddenly reverse, head for the moon and rip the faces off short sellers far and wide. Many of us learned the hard way shorting this market was dangerous business indeed. Some are still fully convinced we are seeing a repeat of the 2011 pullback and that we are going on to new ATH. I have a feeling those days are over. It may take a while to fully dispel the bullish leaning of the crowd but dispelled it will be. I noticed that the VIX is already trading higher than at similar SPX levels in the recent past, the exact reverse of what happened on pullbacks during the relentless march to the top. The fear is already here…
Verne
So if you had to make a probability guess are you favoring a 10-20+ point move up on the SPX and then DOWN or just DOWN from friday?
I rely on VIX to signal an imminent bottom during a steep decline. So far it has not spiked so I anticipate further downside on Monday. I personally think the 1994 area is in play before we see a serious bounce. Folk predicting a massive bounce next week are depending on the FED to keep arresting these kinds of downdrafts. They could be right but I doubt it. A few other things are going in in the markets that that these perennial bulls are ignoring.
Lara, for this weekends analysis, could you add targets for extensions to deeper fibs? For example, maybe not 1.618 the length of wave i, but maybe the next 2 extensions like 2.00 and 2.382?
With volatility running like it is, and the bond funds stopping redemptions and beginning to liquidate, along with the 1.1 trillion in S&P options expiring this week after the fed….there will probably be a lot of volatility and potentially very quick moves down or up. Understanding a few of those other potential extension targets would be helpful.
Thanks for a great week,
Ben
Yes, that’s a very good idea.
Maybe not all on the charts (it’ll get a bit crowded) but certainly in the text.
Awesome, thanks. This certainly feels like waterfall potential. Have a great weekend.
Wow……….
Lara,
does the gap fill and the 61.8 fib correspond with any EW levels? looks like just space below.
!!!
That’s not the S&P500 cash index?
I’m looking at S&P500 cash index and price hasn’t yet come back down to that gap on 5th October.
On your chart I can see another gap which may offer support about 9650.
I was looking at it more as a indicator for the SPX . Seems like the the SPX (and all indexes) can seeming stop in the middle of no where because of technical levels some where else
T2108 is moving into its 15% area T2107 not so.
Vern–need to insure I understand your genius.
Are you saying those 2 closes back below upper B band are trigger for volatility explosion to UPside?
“VIX and UVXY blasting through upper B bands. This is set-up for the once or twice a year trade. Trigger will be two closes back below it”
That will be the trigger to SHORT volatility. If buying puts give yourself no less than ONE MONTH, better six weeks, to expiration. Not entirely too late to go long but upside trigger is closer to a new 52 week low which we saw a few weeks back…
Well what a day – need a few more like this!
Fantastic analysis Lara – have a great weekend everyone.
Did you get back in, or call it a day with this morning’s take?
🙂
I got back in as soon as market fell below 2019 & resold most of my UVXY position at end of the day when it got pumped near 41. I’m trading in and out of UVXY but keeping a core position of VIXY
Will add to UVXY again after we have had a bounce
The preferred scenario on the hourly bear chart above is correct.
The third wave is still in the early stages.
I’m trying to find a good channel / trend line to show where corrections shall find resistance. So far this is what I’ve got.
I have a base channel about subminuette i and ii. It’s being breached by downwards movement as it should if this is a third wave (more confirmation and more confidence with this breach). Now that it’s breached it should / may provide resistance to corrections. In other words, price should stay pretty much below the lower edge of that channel.
Target is the same. Chart attached.
Good luck everybody and have a fabulous weekend! Looks like next week may be quite exciting.
Oh, also, I have managed to switch data feeds from Google / Yahoo to BarChart. The data I’m using today (first time) should now be more reliable. This is a data feed directly from the exchange for the cash price (not futures).
Early…!!!!!?? Oh….My…..
More volatillity calls please…!!!
I learned my lesson…
This data is coming directly from CBOE which calculates the S&P500 index.
This data should be the most reliable that can be accessed.
VIX and UVXY blasting through upper B bands. This is set-up for the once or twice a year trade. Trigger will be two closes back below it…but you guys know that…. 😀
ps. Boy unless this downside is going to get particularly UGLY, we may want to consider moving the wave count up a degree…wow! these third waves don’t take “no” prisoners…
yes indeed. So do you think we bounce mon or tuesday?
hi
all
we should throw a holiday party – haha 🙂
Maybe on Verne since he is the MAN of the week sticking with the SHORTS!
hi
all
it feels like right before the BIG DROP is right here – please wait – imo – no need to dance in and out until we get REALLY BIG BIG DOWN DAYS or the targets after todays post.
BTW – if you get a chance – go watch the NEW MOVIE – THE BIG SHORT 🙂
SPX is trading 7 pts up off the bottom of a 40 pt drop.
Doesn’t seem to be screaming at you for a rip up…
I’d think at least a test of the lows of the day are in order.
Son of a gun
John,
I still think based on everything and the bear cycle theory by Lara we will tank man 1871 for SURE soon weeks man. But that is a good chart mate!
Those gaps can be something can’t they?
I see we got another one further down the line…. 😀
verne
I suspect we could very well just head down to 1871 in the next week or so. No Jinx. If this 3rd Wave is so so strong it should just blast through 1947 easily.
thoughts based on what you are seeing today?
its hard to play the bounce on monthly options better to stay in until we get a HUGE HUGE down days in a row…. More BIG DOWN Days ahead….
I think the August lows at the very least will fall in all the major indices, including SPX. How much farther? It probably depends on what the FED does…either a typical ten to fifteen % haircut or total pandemonium…
As usual, a monster spike in VIX sporting a long upper wick will probably signal a bottom is close…
special thanks to:
Verne
John
Corey
Olga
for hangning in this hard market 🙂
Special thanks to awesome Lara’s work…
You’re welcome 🙂
Love it when I get up and see those big moves as expected with my morning coffee
Something strange going on : VIX futures still moving up while ES & SPX are moving up
Not strange at all. Just uber bearish…it means the crowd is not buying the banksters’ feint…we are going much lower I’m afraid…
exactly
Backwardation on the Vix curve.
Looks like a backtest of 2019 support.
Perfect set-up for v down.
Targets 1999 if v = i.
I’m not as good as Lara…but if we dump into end of day, then call it 2000 as the nice round target.
Dec ES futures low from from Nov. 15 was 1998.50.
Yeah ……. 2019 is an ES Pivot? It is a weekly & monthly pivot too on the SPX
I was not paying attention …………..
No just SPX.
I mention ES 1998.50 overnight low from Nov. 15 is it corresponds well to Lara’s 1997 target.
We might also settle in at 2009-2010…will watch selling pressure as we move into end of day.
Not sure what this means for early next week as we’re smack in the middle of a triple third. Will a wave 4 take up some time before Fed announcement? Or does this thing dump before the Fed meeting?
Either way, this should make for some great trading next week.
I am hoping for a bit of a bounce prior to day’s end to reload some short positions…I think the sweet spot is still ahead. Neither VIX nor UVXY has spiked signalling an intermediate (at least) bottom.
The easy trade is a short of volatility after the spike.
Anchors away mateys!!!
nice call COREY!
She did mention 1994 or thereabouts as an initial downside target…
tail
My charting program has crashed! 🙁
Anyone charting the action so far?
spx currently 2015
//stockcharts.com/h-sc/ui?s=%24SPX&p=60&yr=0&mn=1&dy=15&id=p02823634695&a=436146808
Add “http:” and it should be live update with each refresh, tell me if it works
Thanks for the link John!
The structure seems to be in the 3rd wave of subminuette iii. Estimations are iii will end near Lara’s first target of 1997.
I would not be surprised to see subminuette iv show up intra-day, and then a dump to start subminuette v.
That leaves only minute iv before the final move for Lara’s green (iii).
Either way we’re in a bunch of 3-4s right now. Alternating structures for all the 2s means 4 would be very shallow.
Thoughts?
Thanks Cory! Sounds about right…
Yep
If you have not take some profits off the table as yet…you really should…take the family to dinner this week-end…..!! 😀 😀
Thanks – I am fine. I will take my family out this weekend. If I have a good week or bad week my schedule doesn’t change for family 🙂
Good man…! You should meet my daughter who is a sophomore in college. She just gave her mother her Xmas wish list…Ai! Yi Yi….!!!! 🙂
hi
all
I would like to share this beautiful picture 🙂
GROWWWWLLLLLL….!!!!!!!! 😀 😀 😀
Who knows ,but the SPX got very close to yesterday’s close and there are two BLACK S/R lines that look interesting on the ES with the RSI bottomed out 2030 ES could be next:
Are there any EW waves corresponding with this????????
If the bulls cannot manage even a small rally and the 2020 support shelf breaks…well…
Farewell Spanish Ladies… 🙂
VIX continues to point North…
thats right, I suspect we could very well get to 1950 and lower next week as I originally outlined in my bear case a few days back!
I think we might even goto 1871 to be quite honest this month! and then bounce to 1900-1910 to close the year 🙂
Bears’ pressure on the 2020 pivot is unrelenting…I think it is going to give…
Thar’ she blows…!!!
haha
Could get a ‘tail’ for the low candle like we got for the high yesterday
New low by a single point! – 2020.28 ; Strong support here.
A bounce is probably coming….
Can you believe it? They are selling December expiration UVXY 75 strike calls for less than a buck!! 😀 😀 😀
ps. Great stocking stuffers…merry xmas 🙂
Perhaps micro two unfolding as a flat or zig-zag…?
Probably not a flat for what would be B does not look like at least 90% of A…
VIX still headed North so more downside ahead most likely…
Euro close should be interesting…….will they cover for the week end?
I think the heavy hitters are going to remain short and we will see intermediate capitulation Monday or Tuesday…
Vern–what do you anticipate as target for UVXY at that intermediate capitulation?
Over 50…possibly as high as 75
Thanks. As the song says: beginning to look a lot like Christmas!
Possibly looking at a truncated sub-min five, and start of min two up…micro three down should have blown past this morning’s low…unless four extending
Approaching the moment of truth for the current wave count- micro or sub-min??!!
How far this wave declines is important to the overall bear market thesis. I fully expect we will take out the August low of 1867.01. We need to also take out 1820.66 to join DJI and DJT in confirming a DOW Theory bear and that would leave only NDX to seal the deal…
exactly
Fourth wave bounce…should be new low followed by probably a deep second wave retrace for much of the day and a steep sell-off into the close….
Target for the 4W bounce?
Retest of the 2040 area would be great
Back to the grey S/R
Four of the impulse down seems to be around 2030.41 so I would look for it to traverse that area…
I’ve taken profits here – will get back in as soon as we cross under 2019 (as it elliminates the (low probability) Bullish count. Perhaps burnt too many times!
I think that is a good call.
Question now is bounce target.
These things move faster and farther than expected.
I’m going to do some light shorting here at 2030 and scalp within a range.
If I had to pick I’d say afternoon sell-off.
Yep! Yep! Yep!
Smart…really smart. I had a few puts expiring today and cashed in as well. Took off a few upside hedges and holding onto next week’s expiry positions for now…I think we have a ways to go….
vern and olga,
I’m charting that wave 1 within subminuette wave 3 is done and now we wave 2 up. It *looks* like we just completed a 5 wave up at 23% retrace.
Going in for some more short positions and estimating the big wave is going to hit yet today.
Good luck.
Thanks for heads up. On closer inspection I think you are right on the money….I was thinking sub-min four and five were still pending….
Yep…looks like you were right and that was just micro one down…wow! This think is going to be really extended if that is correct. Retracement definitely looking like a two…if right, this thing should blow past 2021.39 and not look back. If it bounces shortly after that may be start of two up…
Playing with the light grey S/R line
Vix futures stalling
TWITTER is silent !
lol
No doubt the banksters are going to try and “manage” the decline and futures is one of their favorite playgrounds. I expect this third wave down should be more violent than the one in August as that was intermediate one (for the bearish wave count) and this is intermediate three.
I am wondering if my thesis about the FED NOT raising rates could be incorrect and that they will in fact do so to save face with the inevitable repercussions which the market is fully aware of. Some are comparing this to the “Taper Tantrum”, and calling the present sell-off the “Hike Huff”. Anybody thinking there is a chance rates will not be hiked?
A couple of thoughts:
ES is making some nice waves at 5 and 15 minute intervals. I have 2020 as a potential first target this morning, which might present a nice scalp to take profits, bounce, and re-sell. Since there are a lot of 3-4, 3-4s coming up, bounces may be limited.
The one exception to this *could* be as wave 1 of subminuette wave iii completes early this morning, then wave 2 of subminuette wave iii could be steep and quick. Again, I’ve got 2020 as the potential end of wave 1 of subminuette wave iii.
Good luck.
I always struggle a bit on deciding when to take profits during a third wave down. Experience has taught me not to leave profits sitting in the market. On the other hand, cashing in positions during a strong down-trend puts you at a disadvantage when you try to reload short positions as the bid/ask spreads quickly balloon to ridiculous levels for those of us using options,once the direction becomes clear to everyone. There is a tremendous advantage to being positioned ahead of the break. A good compromise I was taught is to ALWAYS take money off the table once you have doubled your position (or reached your profit target) and let the rest ride (so-called “house money”) with a tight stop to protect profits.
I think you are right about support in the 2020 area.
ES Daily as of now Broke down out of the channel , 1 hour to go, a lot can happen.
Holding TVIX
ES HR Thin black line 2034.23
The third wave has arrived.
Last time I did not listen to Lara when she said that it was not done and left TONS of money on the table. Don’t make the same mistake I did.
If you are not already holding UVXY calls, it is one of the few trades with which you can reliably get a ten-fold return on your trade when it is done right
MERRY XMAS EVERYBODY!!!
Hey Cory, didn’t I tell you to be patient?! 😀 😀
Kudos to Lara for keeping us on the right side of the trend. The lady is simply AWESOME!!!!
exactly…
Yes, verne patience has paid off!
All of those 1-2s, 1-2s has made things more interesting though!
hi
The downtrend is in force….
Thanks lara!
hi
lara
your comment here “On Balance Volume has not remained below the cyan trend line. This may only be a small overshoot, but if it continues higher tomorrow it would be a clearer bullish signal. If it does, then OBV may find resistance at the new gold trend line.”
So, if we first move above 2,067.65 and continue higher on the hourly then the OBV can help support that as well? Then we head higher? Then this changes into a higher probability up right?