
Downwards movement was expected but did not happen.
The channel breach in the first hour of Friday’s session indicated a second wave correction had most likely arrived earlier than expected.
Summary: A third wave down may begin on Monday. The short term target is at 1,994, which may be met in three or five days. The mid term target is either 1,947 or 1,850, which is weeks away. The invalidation point is at 2,104.27.
To see how each of the bull and bear wave counts fit within a larger time frame see the Grand Supercycle Analysis.
To see last analysis of weekly and monthly charts click here.
If I was asked to pick a winner (which I am reluctant to do) I would say the bear wave count has a higher probability. It is better supported by regular technical analysis at the monthly chart level, it fits the Grand Supercycle analysis better, and it has overall the “right look”.
New updates to this analysis are in bold.
BULL ELLIOTT WAVE COUNT
DAILY CHART – COMBINATION OR FLAT
Click chart to enlarge.
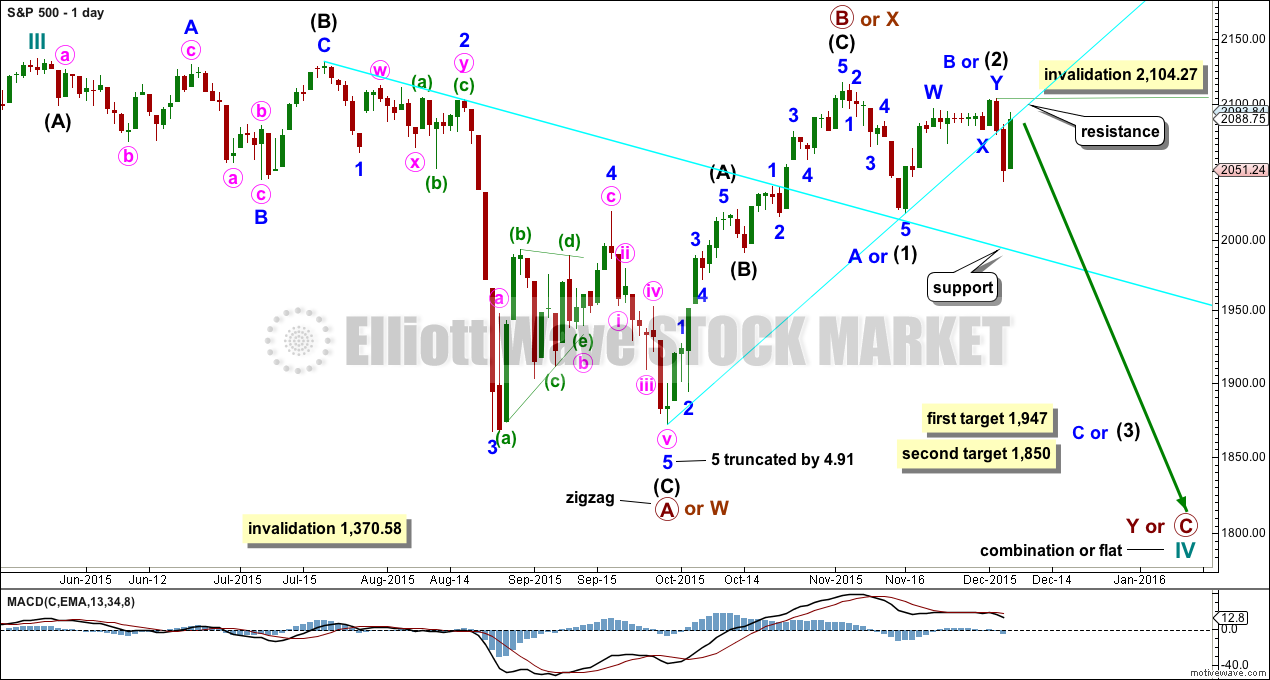
Cycle wave IV should exhibit alternation to cycle wave II.
Cycle wave II was a shallow 0.41 zigzag lasting three months. Cycle wave IV should exhibit alternation in structure and maybe also alternation in depth. Cycle wave IV may end when price comes to touch the lower edge of the teal channel which is drawn about super cycle wave V using Elliott’s technique (see this channel on weekly and monthly charts).
Cycle wave IV may end within the price range of the fourth wave of one lesser degree. Because of the good Fibonacci ratio for primary wave 3 and the perfect subdivisions within it, I am confident that primary wave 4 has its range from 1,730 to 1,647.
If a zigzag is complete at the last major low as labelled, then cycle wave IV may be unfolding as a flat, combination or triangle.
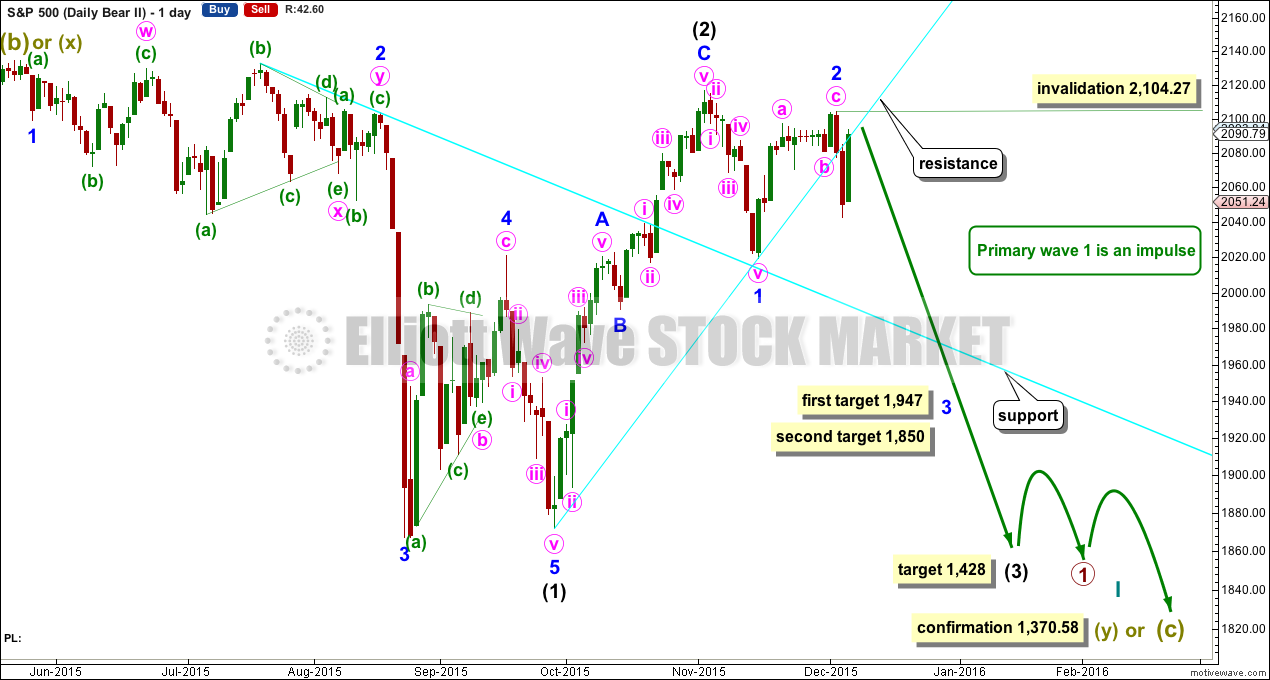
The wave count is changed today to again see primary wave B or X as a zigzag completed earlier. Primary wave C should subdivide as a five and primary wave Y should begin with a zigzag downwards. This downwards movement is either intermediate waves (1)-(2)-(3) of an impulse for primary wave C or minor waves A-B-C of a zigzag for intermediate wave (A). Both these ideas need to see a five down complete towards the target, so at this stage there is no divergence in expectations regarding targets or direction.
Primary wave A or W lasted three months. Primary wave Y or C may be expected to also last about three months.
Within the new downwards wave of primary wave C or Y, a first and second wave, or A and B wave, is now complete. Intermediate wave (2) or minor wave B lasted a Fibonacci 13 days exactly. At 1,947 intermediate wave (3) or minor wave C would reach 1.618 the length of intermediate wave (1) or minor wave A. If price falls through this first target, or gets there and the structure is incomplete, then the next target would be at 1,850 where intermediate wave (3) or minor wave C would reach 2.618 the length of intermediate wave (1).
No second wave correction may move beyond the start above 2,104.27 within intermediate wave (3) or minor wave C.
DAILY CHART – TRIANGLE
Click chart to enlarge.
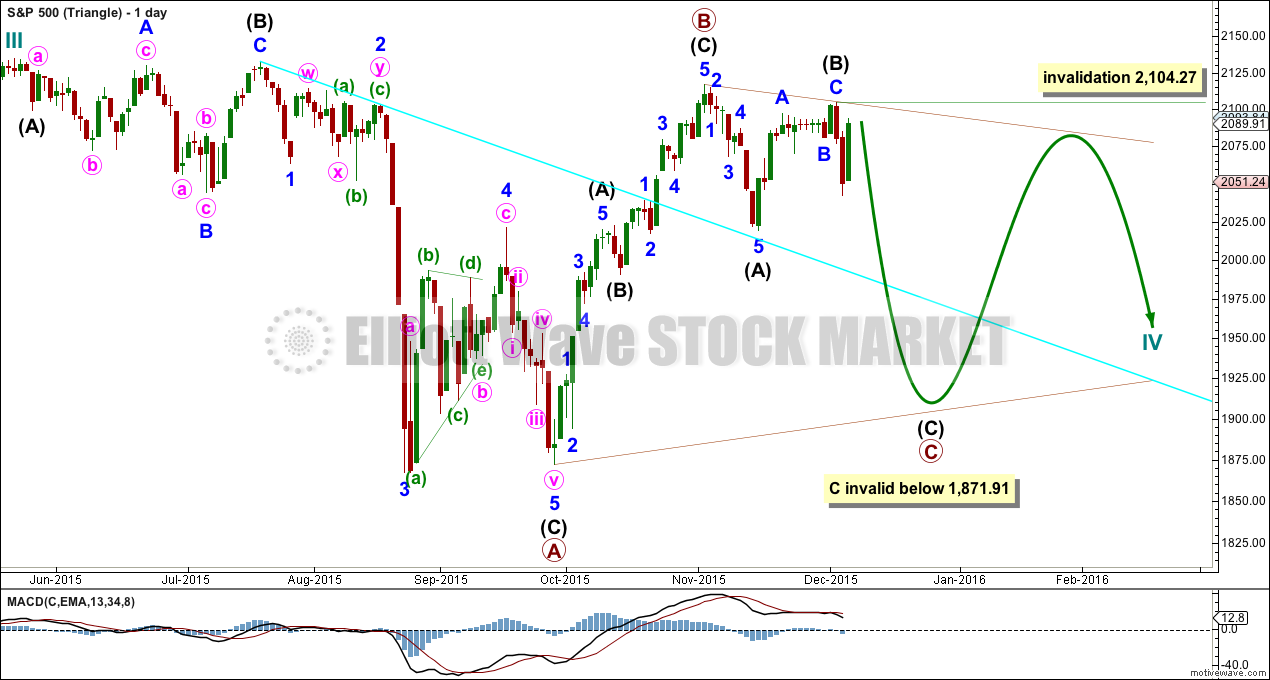
Cycle wave IV may unfold as a shallow triangle. This would provide alternation with the 0.41 zigzag of cycle wave II.
Primary wave B may be a complete zigzag. Primary wave C downwards may be underway and within it intermediate waves (A) and (B) are complete. No second wave correction may move beyond its start above 2,104.27 within intermediate wave (C).
The whole structure moves sideways in an ever decreasing range. The purpose of triangles is to take up time and move price sideways. A possible time expectation for this idea may be a total Fibonacci eight or thirteen months, with thirteen more likely. So far cycle wave IV has lasted six months.
HOURLY CHART
Click chart to enlarge.
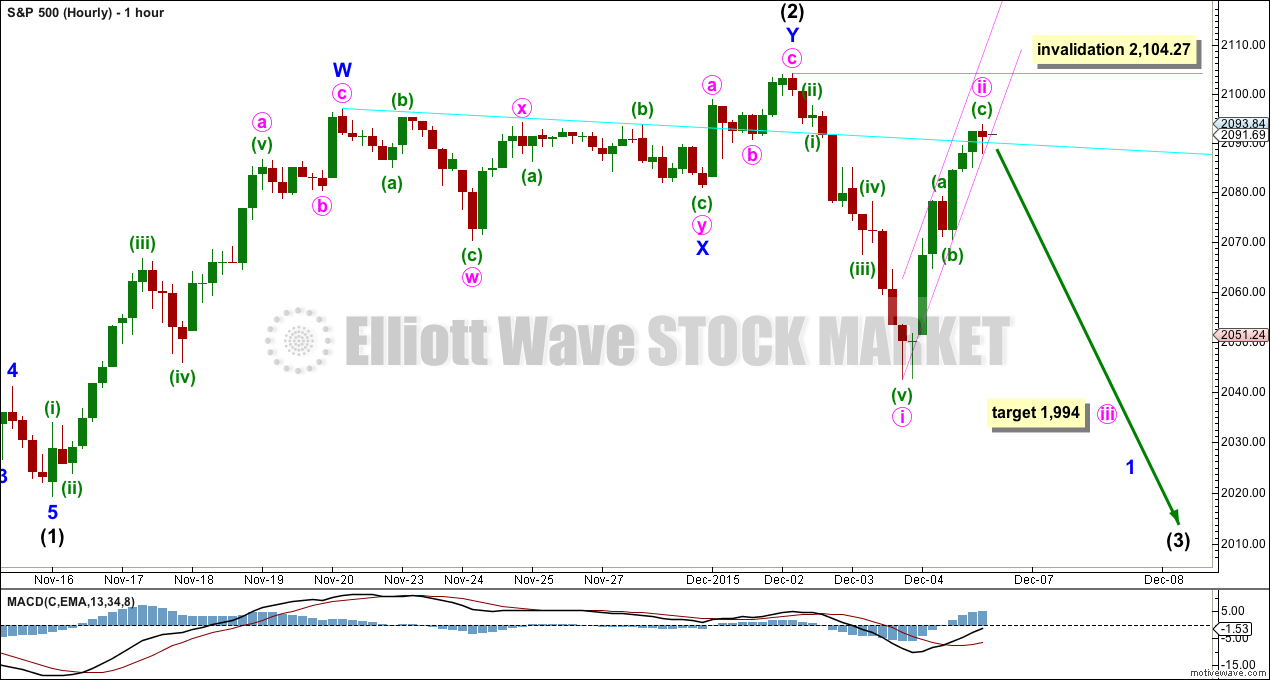
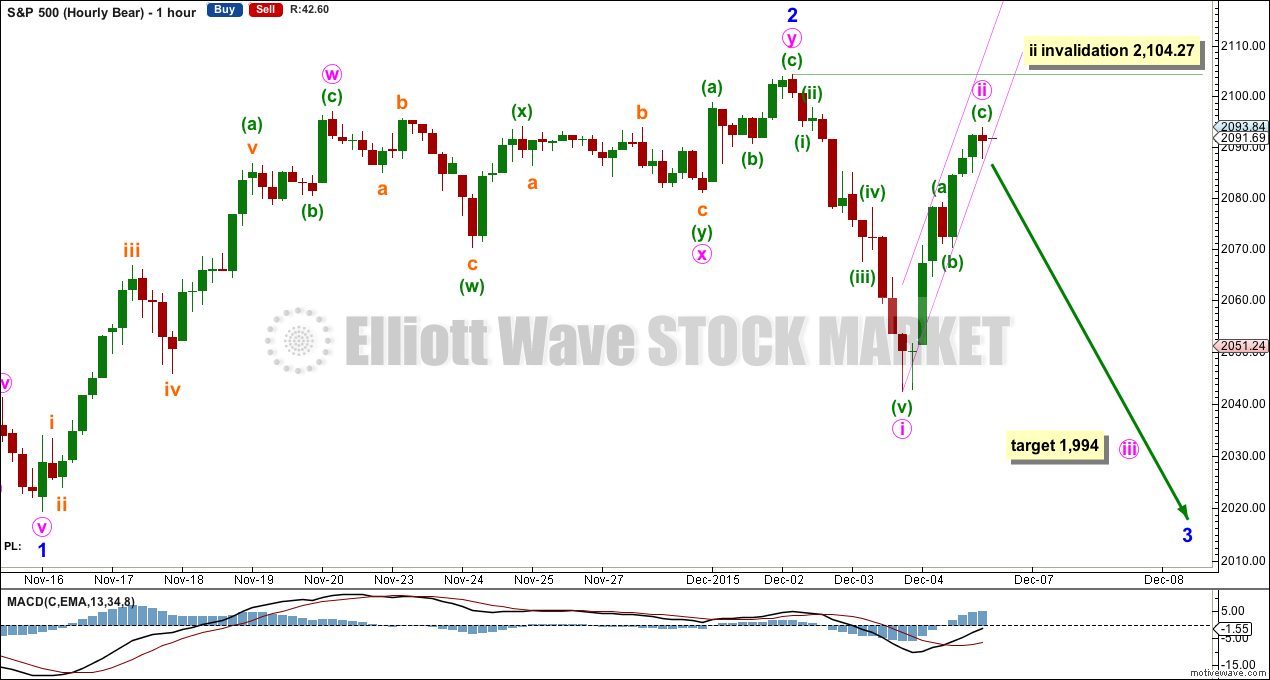
Upwards movement is too deep and long lasting to be a fourth wave correction, so this is a second wave correction which subdivides as a complete zigzag. The small red doji at the end of Friday’s session indicates upwards movement may be over.
The small channel about minute wave ii will be the most important piece of technical analysis on this chart for Monday morning. When that is clearly breached by downwards movement, it shall indicate a short term trend change.
If minute wave iii begins at Friday’s high, then at 1,994 it would reach 1.618 the length of minute wave i. If minute wave ii continues any higher, then this target must also move correspondingly higher.
A new low below the high of minuette wave (a) at 2,079.14 would add price confidence to a trend change. At that stage, downwards movement could not be a fourth wave correction within an impulse unfolding upwards, so at that stage the upwards wave labelled minute wave ii would have to be over and would have to be a three wave structure.
The cyan trend line is providing some resistance.
Minute wave ii may not move beyond the start of minute wave i above 2,104.27.
ALTERNATE BULL ELLIOTT WAVE COUNT
DAILY CHART
Click chart to enlarge.
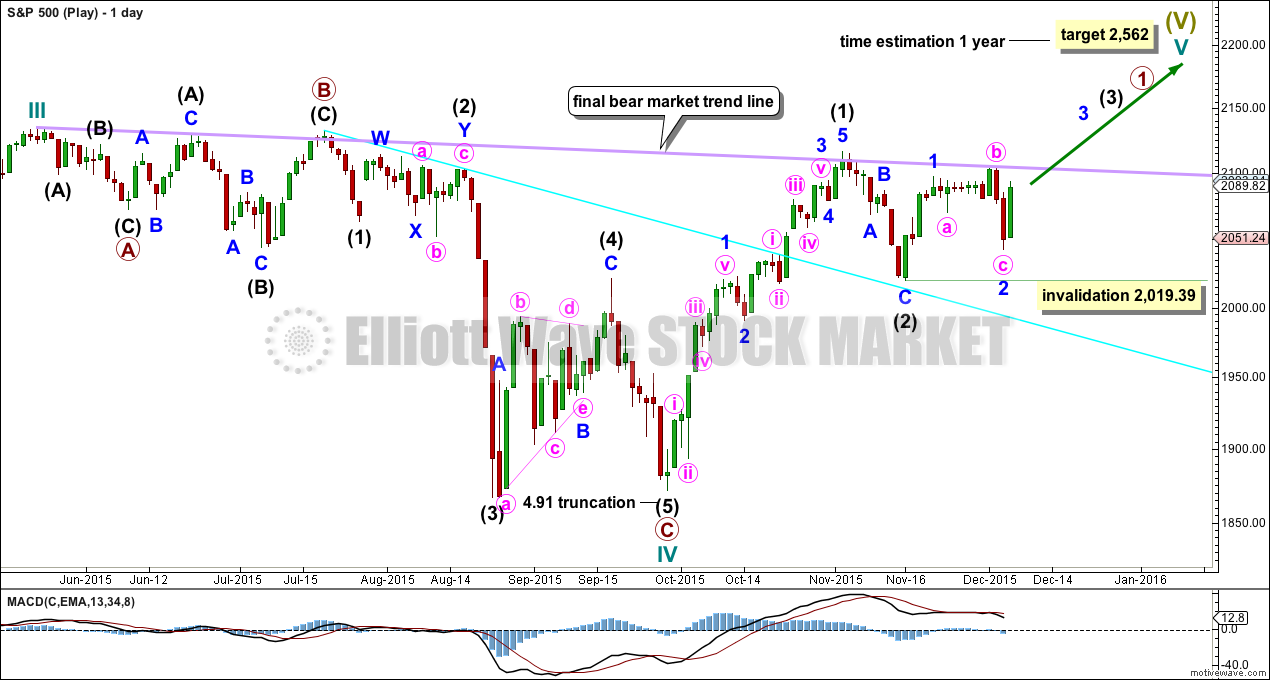
It is possible to see cycle wave IV a completed flat correction. This would provide some structural alternation with the zigzag of cycle wave II.
This is a regular flat but does not have a normal regular flat look. Primary wave C is too long in relation to primary wave A. Primary wave C would be 3.84 short of 4.236 the length of primary wave A. While it is possible to also see cycle wave IV as a complete zigzag (the subdivisions for that idea would be labelled the same as the bear wave count below, daily chart) that would not provide structural alternation with the zigzag of cycle wave II, and so I am not considering it.
This idea requires not only a new high but that the new high must come with a clear five upwards, not a three.
At 2,562 cycle wave V would reach equality in length with cycle wave I. Cycle wave I was just over one year in duration so cycle wave V should be expected to also reach equality in duration. Cycle degree waves should be expected to last about one to several years, so this expectation is reasonable. It would be extremely unlikely for this idea that cycle wave V was close to completion, because it has not lasted nearly long enough for a cycle degree wave.
I added a bear market trend line drawn using the approach outlined by Magee in “Technical Analysis of Stock Trends”. When this lilac line is clearly breached by upwards movement that shall confirm a trend change from bear to bull. The breach must be by a close of 3% or more of market value. If it comes with a clear five up, then this wave count would be further confirmed.
While price remains below the bear market trend line, we should assume the trend remains the same: downwards.
Intermediate wave (1) is a complete five wave impulse and intermediate wave (2) is a complete three wave zigzag.
For this wave count, when the next five up is complete that would be intermediate wave (3). Within intermediate wave (3), no second wave correction may move beyond the start of its first wave below 2,019.39.
This wave count does not have support from regular technical analysis and it has a big problem of structure for Elliott wave analysis. I do not have confidence in this wave count. It is presented as a “what if?” to consider all possibilities.
BEAR ELLIOTT WAVE COUNT
DAILY CHART
Click chart to enlarge.
This bear wave count has a better fit at Grand Super Cycle degree and is better supported by regular technical analysis at the monthly chart level. But it is a huge call to make, so I present it second, after a more bullish wave count, and until all other options have been eliminated.
There are two ideas presented in this chart: a huge flat correction or a double flat / double combination. The huge flat is more likely. They more commonly have deep B waves than combinations have deep X waves (in my experience).
A huge flat correction would be labelled super cycle (a)-(b)-(c). It now expects a huge super cycle wave (c) to move substantially below the end of (a) at 666.79. C waves can behave like third waves. This idea expects a devastating bear market, and a huge crash to be much bigger than the last two bear markets on the monthly bear chart.
The second idea is a combination which would be labelled super cycle (w)-(x)-(y). The second structure for super cycle wave (y) would be a huge sideways repeat of super cycle wave (a) for a double flat, or a quicker zigzag for a double combination. It is also possible (least likely) that price could drift sideways in big movements for over 10 years for a huge triangle for super cycle wave (y).
The downwards movement labelled intermediate wave (1) looks like a five. If minor wave 2 is seen as a double zigzag with a triangle for wave X within it, then the subdivisions all fit nicely.
Ratios within intermediate wave (1) are: minor wave 3 is 7.13 points short of 6.854 the length of minor wave 1, and minor wave 5 is just 2.81 points longer than 0.618 the length of minor wave 3. These excellent Fibonacci ratios add some support to this wave count.
Intermediate wave (2) was a very deep 0.93 zigzag (it will also subdivide as a double zigzag). Because intermediate wave (2) was so deep the best Fibonacci ratio to apply for the target of intermediate wave (3) is 2.618 which gives a target at 1,428.
Within intermediate wave (3), minor waves 1 and 2 are complete. The upwards movement for minor wave 2 does have a strong three wave look to it at the daily chart level. Minor wave 2 was another deep correction at 0.87 of minor wave 1. Targets for minor wave 3 are 1.618 and 2.618 the length of minor wave 1.
It is still possible (but still less likely) that primary wave 1 is unfolding as a leading diagonal. I will keep that chart up to date and will publish it if and when it begins to diverge from the idea presented here. For now I want to keep the number of charts published more manageable.
HOURLY CHART
Click chart to enlarge.
All the subdivisions at the hourly chart level for bull and bear are again the same. Targets and invalidation points are the same. The most important piece of analysis on this chart is the channel about minute wave ii. When this channel is breached by downwards movement that shall indicate a trend change.
ALTERNATE BEAR ELLIOTT WAVE COUNT
DAILY CHART
Click chart to enlarge.
What if we see a new high above 2,104.27 on Monday?
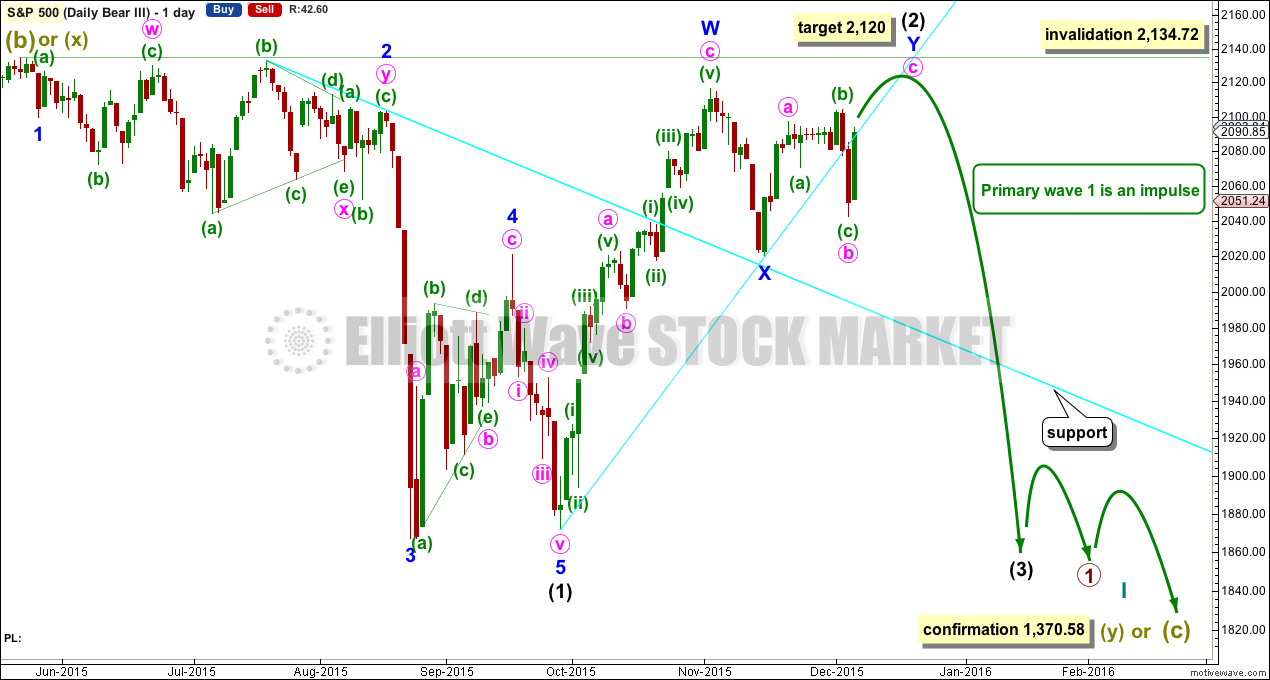
It is possible that intermediate wave (2) could be continuing as a double zigzag. This cannot be a combination. The second structure in the double cannot be a flat correction because the b wave within it is less than 0.9 the length of the a wave.
Double zigzags exist to deepen a correction when the first zigzag in the double does not move price deep enough. In this instance, the first zigzag in the double is a 0.93 length of intermediate wave (1); it is very deep indeed. A second zigzag is not required because the first was very deep. This structure meets the rules but not the purpose of a double zigzag, so it does not have the right look.
This idea has a low probability. But it is technically possible. It should only be used if price moves above 2,101.27.
At that stage, a five up on the hourly chart would be required to complete. It should move above 2,116.48, so that the second zigzag in the double deepens the correction and meets its purpose. It may not move above 2,134.72.
At 2,120 minute wave c would reach equality in length with minute wave a.
TECHNICAL ANALYSIS
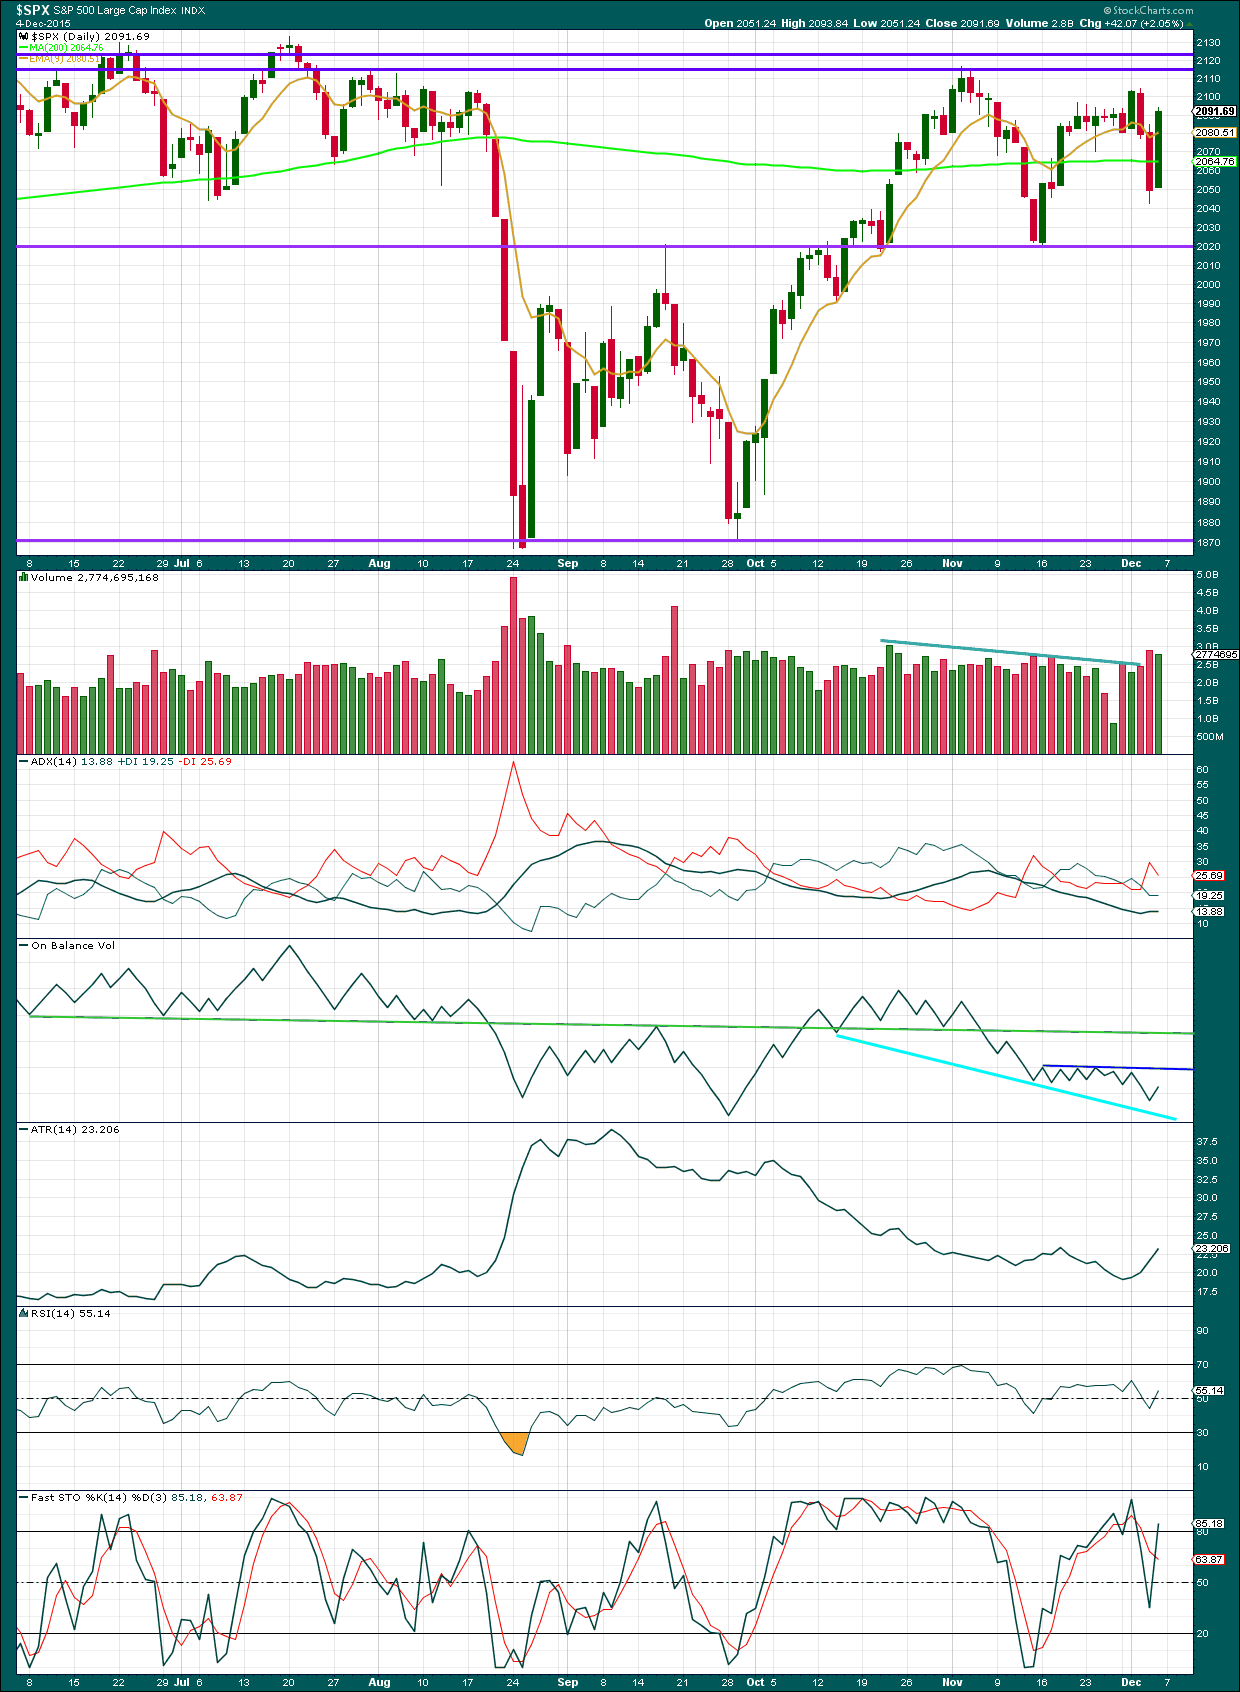
Click chart to enlarge. Chart courtesy of StockCharts.com.
Daily: Volume for Friday was lighter than the prior downwards day, but overall stronger than many recent days. There is some support for the upwards movement in price for Friday. The 200 day moving average has offered no support or resistance at all.
ADX is flat to slightly inclining but below 15. No trend is indicated. ATR is now fairly clearly increasing indicating a potential new trend.
Overall, the regular technical analysis picture is unclear. A potential new downwards trend may be beginning, but some patience at this time to wait for clarity would be advised. On Balance Volume may lead the way.
On Balance Volume may find resistance again at the dark blue line, if it comes up to touch that. To the downside, if OBV breaks below the cyan trend line, then that would be further bearish indication. For now, while OBV sits between these two lines, the trend direction is not clear.
Neither RSI nor Stochastics are oversold. There is plenty of room for this market to fall.
A note on Dow Theory: for the bear wave count I would wait for Dow Theory to confirm a huge market crash. So far the industrials and the transportation indices have made new major swing lows, but the S&P500 and Nasdaq have not.
S&P500: 1,820.66
Nasdaq: 4,116.60
DJT: 7,700.49 – this price point was breached.
DJIA: 15,855.12 – this price point was breached.
To the upside, for Dow Theory, I am watching each index carefully. If any make new all time highs, that will be noted. If they all make new all time highs, then a continuation of a bull market would be confirmed. So far none have made new all time highs.
This analysis is published about 09:00 p.m. EST. on 5th December, 2015.
Looking for things to stabilize at 2060 (briefly).
In the next day or two, support levels are 2020 and 2000 (overnight ES low from the Paris attacks).
I think Lara’s first target at 1,994 (1.618 length of 1) *might* be too high for this wave 3.
GLTA
2069.8 last barrier this morning for bearish case and should be taken out quickly. I expect the FOMC meeting to be occasion for a counter-trend bounce (if the bulls are lucky), and not the establishment of one…
European bourses all higher and the DAX up almost 2% in snap back rally after Draghi induced sell-off. It will be interesting to see if they lead US markets higher or we lead them lower. Key levels today – top of wave A of Friday’s ABC pop for the bearish count at 2079.14, and for those convinced minute three of five up began Friday it would then be its start at 2042.35.
I am going to split the difference with a decline below Friday’s open at 2051.24 being good enough to place the bullish outlook in serious peril. Have a great trading day all!
2079.14 taken out. Is 2042.35 next? Bear count says ‘Yes’.
Oil needs to stabilize. Im waiting till the close. No need to rush!
I completely agree. The banksters are going to try to stem the tide and one has to be ready. If momentum slows…I would be cautious…
volume?
not bearish enough. 30 handles potential not worth it.
If that happens, get ready for a stampede…and not necessarily of bulls….
im not sure if you are considering the most important meeting in history is next week – with that said – dont you think it is over kill to dump the market before that -5%? something to think about matey?
Like I said I am not bearish or bullish. I just take what the market gives me.
Sometimes, it is hard to buy the dip but in crazy price action it works…