
Sideways movement followed by a short upwards thrust was expected.
This is somewhat what happened, but the Elliott wave triangle was invalidated.
Summary: The trend is still down, but a bear market rally continues and is not done yet. It may end at the end of this week. A new high above 2,116 is expected. Targets for this upwards move to end are either 2,118 or 2,128. Thereafter, the downwards trend should resume in force. This bear market rally is extremely unlikely to make a new all time high. It is expected to stop before 2,134.72.
To see how each of the bull and bear wave counts fit within a larger time frame see the Grand Supercycle Analysis.
To see last analysis of weekly and monthly charts click here.
If I was asked to pick a winner (which I am reluctant to do) I would say the bear wave count has a higher probability. It is better supported by regular technical analysis at the monthly chart level, it fits the Grand Supercycle analysis better, and it has overall the “right look”.
New updates to this analysis are in bold.
BULL ELLIOTT WAVE COUNT
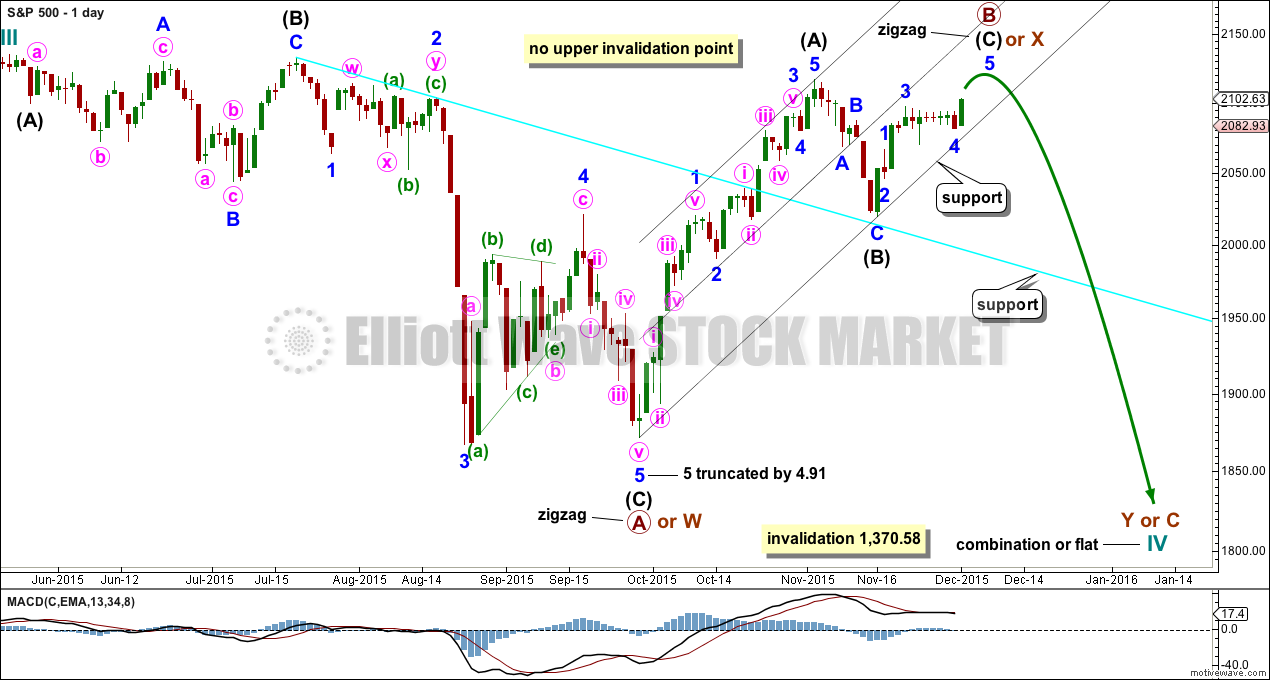
DAILY CHART – COMBINATION OR FLAT
Click chart to enlarge.
Cycle wave IV should exhibit alternation to cycle wave II.
Cycle wave II was a shallow 0.41 zigzag lasting three months. Cycle wave IV should exhibit alternation in structure and maybe also alternation in depth. Cycle wave IV may end when price comes to touch the lower edge of the teal channel which is drawn about super cycle wave V using Elliott’s technique (see this channel on weekly and monthly charts).
Cycle wave IV may end within the price range of the fourth wave of one lesser degree. Because of the good Fibonacci ratio for primary wave 3 and the perfect subdivisions within it, I am confident that primary wave 4 has its range from 1,730 to 1,647.
If a zigzag is complete at the last major low as labelled, then cycle wave IV may be unfolding as a flat, combination or triangle.
Primary wave B or X is an incomplete zigzag unfolding upwards. If cycle wave IV is an expanded flat correction, then primary wave B may make a new high above the start of primary wave A at 2,134.72. If cycle wave IV is a combination, then primary wave X may make a new high above the start of primary wave W. There is no upper invalidation point for these reasons.
Primary wave A or W lasted three months. When it arrives primary wave Y or C may be expected to also last about three months.
Intermediate waves (A) and (B) together lasted a Fibonacci 34 days within primary wave B or X. So far intermediate wave (C) has lasted twelve days. It may end in a further one day to total a Fibonacci thirteen. Give or take one more day in addition would still see an acceptable Fibonacci duration.
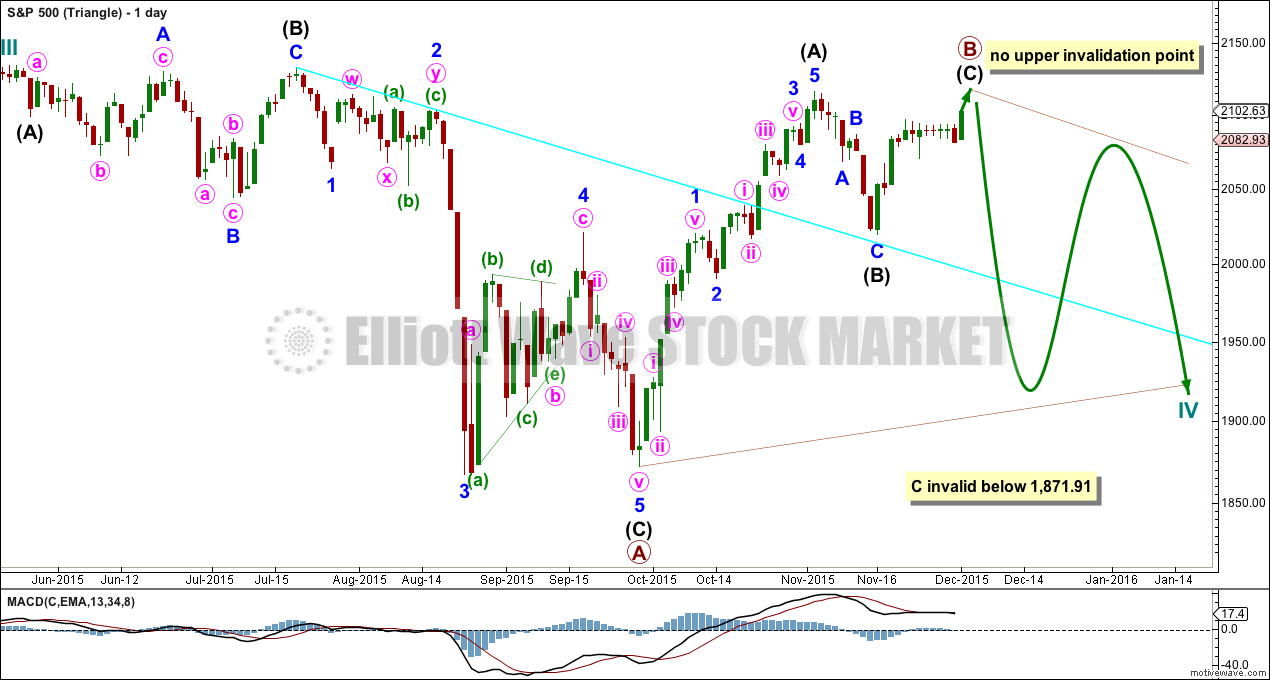
DAILY CHART – TRIANGLE
Click chart to enlarge.
Cycle wave IV may unfold as a shallow triangle. This would provide alternation with the 0.41 zigzag of cycle wave II.
Primary wave B may be unfolding as a zigzag. Primary wave B may make a new high above the start of primary wave A at 2,134.72 as in a running triangle. There is no upper invalidation point for this wave count for that reason.
The whole structure moves sideways in an ever decreasing range. The purpose of triangles is to take up time and move price sideways. A possible time expectation for this idea may be a total Fibonacci eight or thirteen months, with thirteen more likely. So far cycle wave IV has lasted six months.
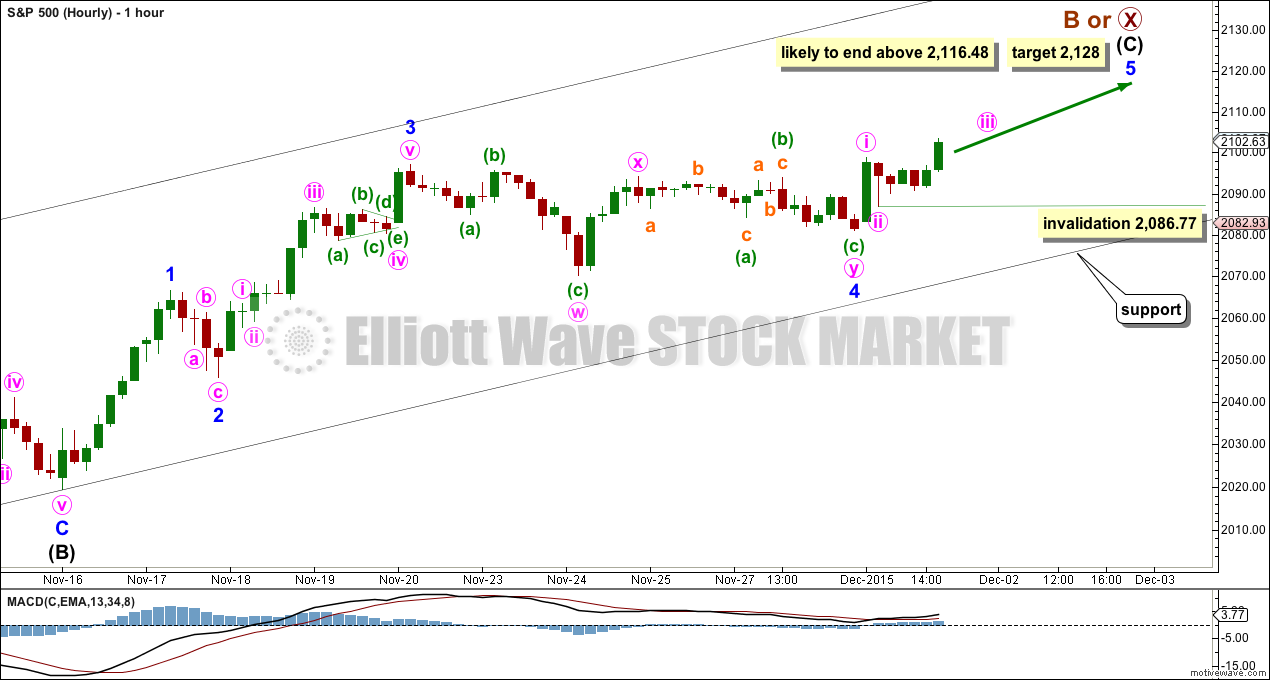
HOURLY CHART
Click chart to enlarge.
Again, the two hourly charts are different today.
Today I favour this first hourly chart.
Minor wave 4 may have completed as a shallow 0.31 combination: zigzag – X – flat correction. This provides good alternation with the deeper 0.44 zigzag of minor wave 2.
At 2,128 minor wave 5 would reach equality in length with minor wave 1. This is the most common Fibonacci ratio for a fifth wave. There is no Fibonacci ratio between minor waves 3 and 1, so this makes it more likely that minor wave 5 shall exhibit a Fibonacci ratio to either of 3 or 1. The target has a good probability.
Minute waves i and ii are complete within minor wave 5.
No second wave correction may move beyond the start of its first wave below 2,086.77 within minute wave iii.
If upwards movement continues to the target for two more days and the structure looks to be complete at the hourly chart level, then that may be it for this bear market rally.
Following completion of the structure, a breach of the wider black channel (copied over from the daily chart) would be required for earliest trend channel confirmation of a trend change.
ALTERNATE BULL ELLIOTT WAVE COUNT
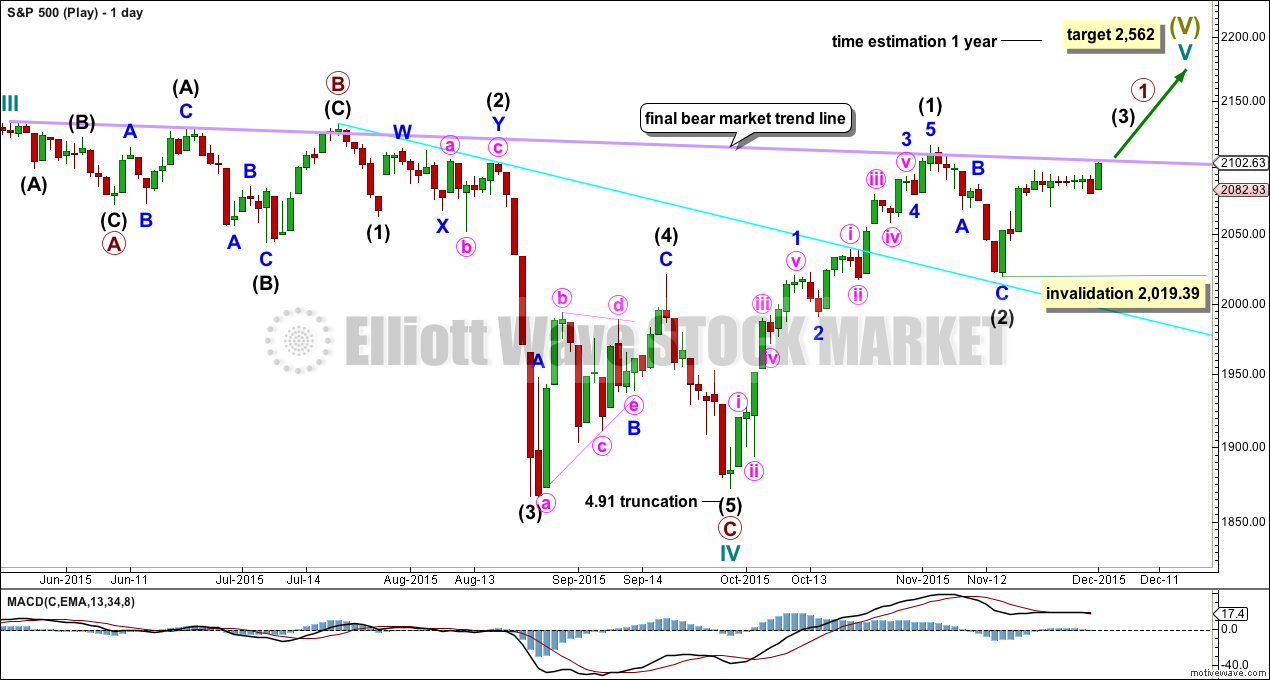
DAILY CHART
Click chart to enlarge.
It is possible to see cycle wave IV a completed flat correction. This would provide some structural alternation with the zigzag of cycle wave II.
This is a regular flat but does not have a normal regular flat look. Primary wave C is too long in relation to primary wave A. Primary wave C would be 3.84 short of 4.236 the length of primary wave A. While it is possible to also see cycle wave IV as a complete zigzag (the subdivisions for that idea would be labelled the same as the bear wave count below, daily chart) that would not provide structural alternation with the zigzag of cycle wave II, and so I am not considering it.
This idea requires not only a new high but that the new high must come with a clear five upwards, not a three.
At 2,562 cycle wave V would reach equality in length with cycle wave I. Cycle wave I was just over one year in duration so cycle wave V should be expected to also reach equality in duration. Cycle degree waves should be expected to last about one to several years, so this expectation is reasonable. It would be extremely unlikely for this idea that cycle wave V was close to completion, because it has not lasted nearly long enough for a cycle degree wave.
I added a bear market trend line drawn using the approach outlined by Magee in “Technical Analysis of Stock Trends”. When this lilac line is clearly breached by upwards movement that shall confirm a trend change from bear to bull. The breach must be by a close of 3% or more of market value. If it comes with a clear five up, then this wave count would be further confirmed.
While price remains below the bear market trend line, we should assume the trend remains the same: downwards.
Intermediate wave (1) is a complete five wave impulse and intermediate wave (2) is a complete three wave zigzag. Subdivisions at the hourly chart level would be the same for this wave count as for the other two wave counts; A-B-C of a zigzag subdivides 5-3-5, exactly the same as 1-2-3 of an impulse.
For this wave count, when the next five up is complete that would be intermediate wave (3). Within intermediate wave (3), no second wave correction may move beyond the start of its first wave below 2,019.39.
This wave count does not have support from regular technical analysis and it has a big problem of structure for Elliott wave analysis. I do not have confidence in this wave count. It is presented as a “what if?” to consider all possibilities.
BEAR ELLIOTT WAVE COUNT
DAILY CHART
Click chart to enlarge.
This bear wave count has a better fit at Grand Super Cycle degree and is better supported by regular technical analysis at the monthly chart level. But it is a huge call to make, so I present it second, after a more bullish wave count, and until all other options have been eliminated.
There are two ideas presented in this chart: a huge flat correction or a double flat / double combination. The huge flat is more likely. They more commonly have deep B waves than combinations have deep X waves (in my experience).
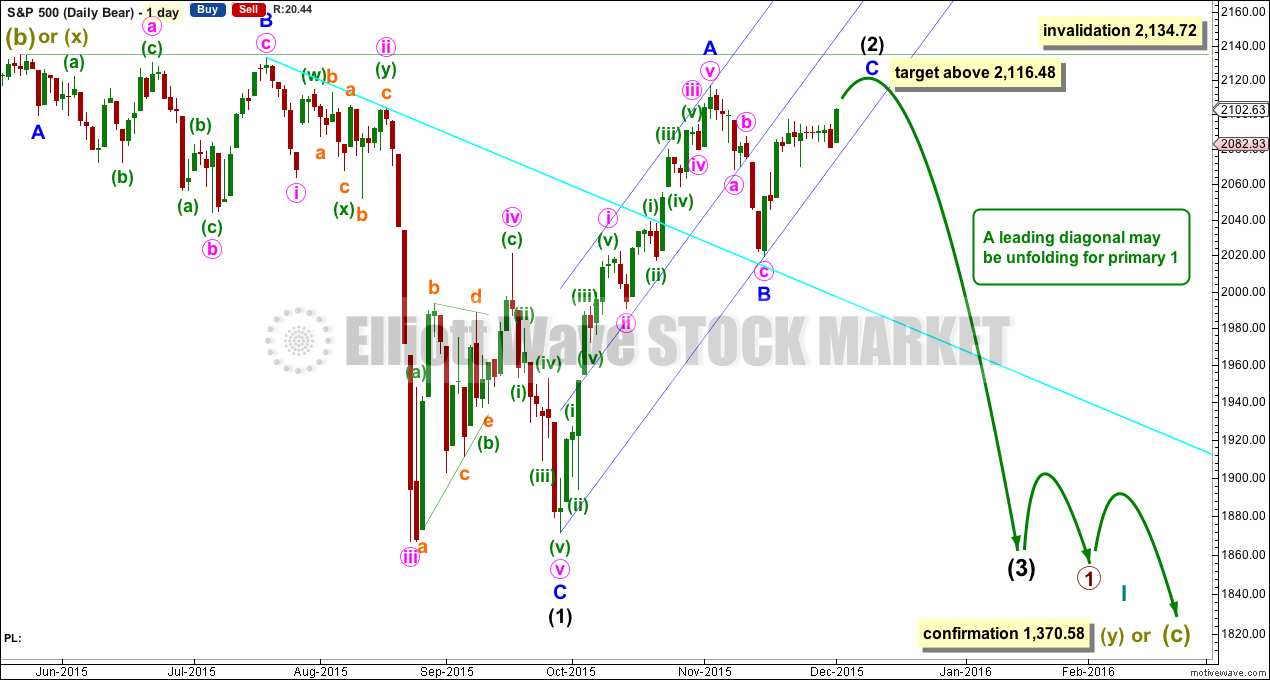
A huge flat correction would be labelled super cycle (a)-(b)-(c). It now expects a huge super cycle wave (c) to move substantially below the end of (a) at 666.79. C waves can behave like third waves. This idea expects a devastating bear market, and a huge crash to be much bigger than the last two bear markets on the monthly bear chart.
The second idea is a combination which would be labelled super cycle (w)-(x)-(y). The second structure for super cycle wave (y) would be a huge sideways repeat of super cycle wave (a) for a double flat, or a quicker zigzag for a double combination. It is also possible (least likely) that price could drift sideways in big movements for over 10 years for a huge triangle for super cycle wave (y).
The bear wave count sees a leading diagonal for a primary degree first wave unfolding. Within leading diagonals, the first, third and fifth waves are most commonly zigzags but sometimes may appear to be impulses. Here intermediate wave (1) is seen as a complete zigzag.
Intermediate wave (2) is an incomplete zigzag within the leading diagonal. It may not move beyond the start of intermediate wave (1) above 2,134.72. This wave count expects minor wave C to end midway within its channel, above the end of minor wave A at 2,116.48 but not above 2,134.72.
HOURLY CHART
Click chart to enlarge.
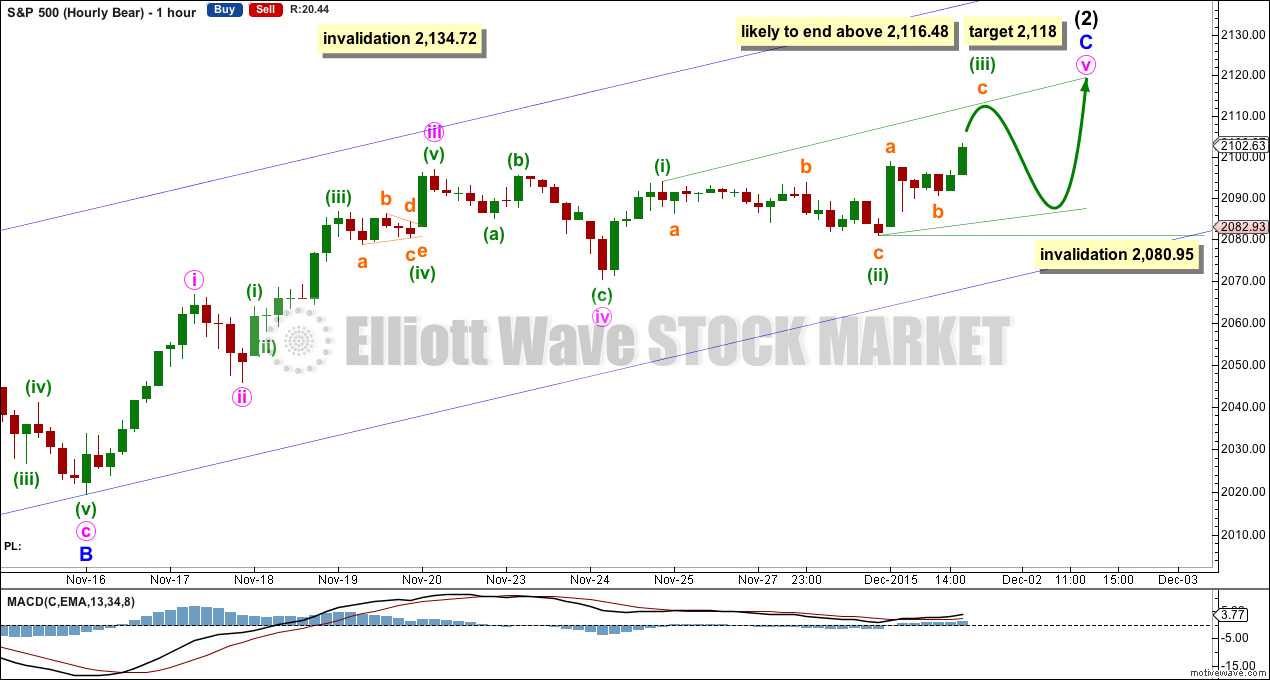
This idea is presented second only because that is how I developed the charts. I would judge this second idea to have a lower probability than the first idea presented for the hourly bull wave count.
Both these ideas work in exactly the same way for bull and bear wave counts because both bull and bear wave counts expect that a zigzag is completing upwards. The degree of labelling is different; the bear has everything one degree lower.
What if minute wave iv was over earlier as previously labelled?
Here there is not very good alternation between minute waves ii and iv. Minute wave ii is a shallow 0.44 zigzag and minute wave iv is a deeper 0.52 zigzag. They are the same kind of structure. This reduces the probability of this wave count to less than the first idea.
At 2,118 minute wave v would reach equality in length with minute wave i.
Minute wave v may be unfolding as an ending expanding diagonal for this idea. Minuette wave (iii) must move higher at the start of tomorrow’s session for the diagonal to be expanding. Thereafter, minuette wave (iv) must overlap back into minuette wave (i) price territory and must be longer than minuette wave (ii) in length. It may not move beyond the end of minuette wave (ii) below 2,080.95.
It is extremely unusual for a fifth wave ending diagonal to end in a truncation. That is why for this second idea the diagonal should be expanding. A contracting diagonal may not be able to end above 2,116.48.
This second idea also expects more upwards movement. The structure is incomplete. The target is lower, but because the structure of the diagonal should be choppy and overlapping it may need more time to reach the lower target.
TECHNICAL ANALYSIS
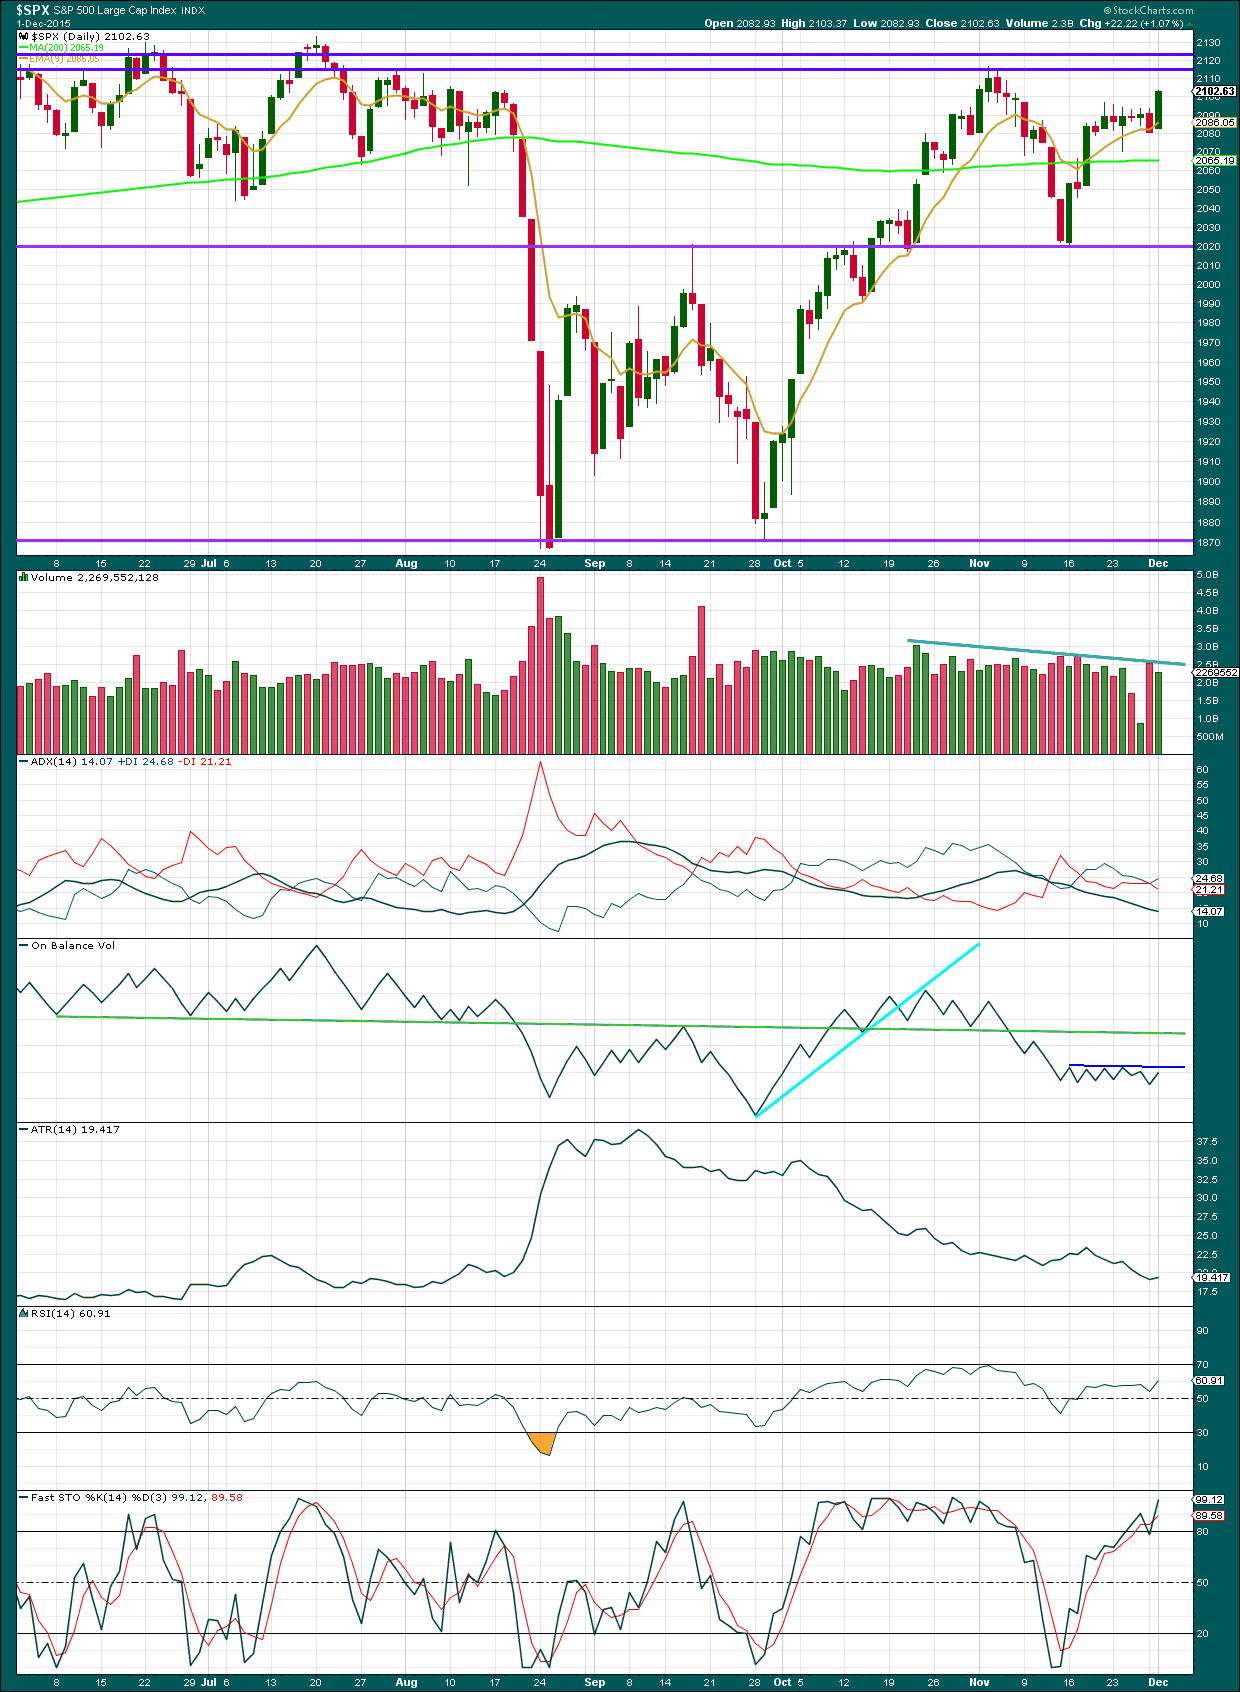
Click chart to enlarge. Chart courtesy of StockCharts.com.
Daily: Again, an upwards day comes on lighter volume than downwards days. The rise in price is not supported by volume and is suspicious. This supports the main and bearish Elliott wave counts. Overall, as price rises volume is declining.
Today there is some divergence with the high today and On Balance Volume. OBV has not managed to make a new high above the prior high of 20th November while price did make a new high. This indicates weakness in upwards movement of price. I am adding a new short trend line to OBV today. This is very shallow (almost horizontal) and repeatedly tested but not long held. It is reasonably technically significant. This short dark blue line may assist to show when upwards movement for price comes to an end. If OBV again touches that trend line, that may be when price ends the bear market rally.
ADX still indicates the market is not trending but consolidating. A range bound trading approach would expect some more upwards movement from here to not end until price finds resistance at one of the two upper horizontal trend lines and Stochastics is overbought at the same time.
A note on Dow Theory: for the bear wave count I would wait for Dow Theory to confirm a huge market crash. So far the industrials and the transportation indices have made new major swing lows, but the S&P500 and Nasdaq have not.
S&P500: 1,820.66
Nasdaq: 4,116.60
DJT: 7,700.49 – this price point was breached.
DJIA: 15,855.12 – this price point was breached.
To the upside, for Dow Theory, I am watching each index carefully. If any make new all time highs, that will be noted. If they all make new all time highs, then a continuation of a bull market would be confirmed. So far none have made new all time highs.
This analysis is published about 08:12 p.m. EST.
hi
all that are bearish,
Seriously, think about it for 1 min. Come on we all worked hard looking at technicals. This isn’t how bull markets just fail. Let us wait for the technical analysis from Lara tonight and see this weeks price action. We literally closed the SPX 2079.51 today.
I say think more about it over the night and tomorrow. Be careful to draw a conclusion.
Thank you!
Options2014
hi
all
i remain bullish
laters…
verne
Did you catch the last drop in late August on the top 2100 level or you got in a bit later before we hit 1861?
I started building my short position on August 5 when UVXY made a new low. My problem was that I got out way too early as UVXY ( although it was still a great trade) uncharacteristically became completely decoupled from VIX and for the first time that I can recall did not signal the market bottom. For some strange reason it did not spike until September 1 and totally confused me. Today’s new 52 week low suggests we should see a big decline the next three weeks or so.
k cool. I agree 2-3 weeks we roll over but not now….
I started building my short position on August 5 when UVXY made a new low. My problem was that I got out way too early as UVXY ( although it was still a great trade) uncharacteristically became completely decoupled from VIX and for the first time that I can recall did not signal the market bottom although VIX did on August 24. For some strange reason it did not spike until September 1 and totally confused me. Today’s new 52 week low suggests we should see a big decline the next three weeks or so.
futures selling should get a bounce up from support….
The move was news driven today…
verne
I always step back and reevaluate and the way i look at it – this is one of the greatest BULL Markets ever. It has the POWER to move to the final target of 2116 or 2116+.
Thanks
Options2014
You know what is really strange about today? Everybody and his grand-mother knows that Draghi is going to come out tomorrow with another one of his “whatever it takes” blusters. For the last few years intermediate market tops have often been accompanied by various central bank pronouncements. He had better come out and announce QE ad infinitum tomorrow and even if he does and we get a knee-jerk reaction in the markets, the key thing is that any potential upside is probably quite limited as Corey points out. For the market to sell off AHEAD of a scheduled central bank promise of more stimulus is something a little different. They are SELLING the rumor. The pop tomorrow is going to have to re-capture the SPX 2100 level for me to be convinced of any remaining bullish potential. It is also possible that the market is already signaling Friday’s jobs reports which, if disappointing, would set up a nice third of a third…
As I said at this point is all about the intra day and CLOSING print tomorrow and for that matter FRIDAY. I am holding my view +2% higher and then ROLL OVER….
Let us see tomorrow mattey
My 2 cents:
The ECB announcement tomorrow morning ET could be significant. However, if you look at the analog from August before the market tanked, you’ll notice eerily similar patterns playing out.
I would be in the camp with verecarty that a 3rd wave down won’t mess around. One last gasp tomorrow morning might be the last chance to get out. Either way, why risk 200 pts of downside for 30 upside?
Another note, gold only popped $59 when the ES went down 200 handles. It will be interesting to see how gold reacts to overhead resistance when there is finally a corrective bounce there.
Corey
Good Chart. I still think we take one more RIP higher and then dump… I also think the FED can’t have a 13% sell off by the NEXT MEETING on the week of the 15th. Be CAREFUL MAN.
Fascinating. A long upper wick tomorrow would be a dead give-away. Incredibly, the pop last time exceeded the previous days high! What a head-fake that turned out to be. Great observation.
SPX puts didn’t go up by that much today it takes 1-3 days once the move happens on the downside. No rush to short as I said as $100-$50 on a contract gain for a fake move down can be a waste of time..
Come on 2086 SPX.. 🙂 A couple more points….
The infamous “slope of hope”…… 😀
We got 5 minutes till the close…
A lot of analysts think we are still in minor four with one more wave up to go. Could be. The size of the move down today sure does not look like a smaller degree fourth. Looking forward to hear Lara’s take on the price action today. I was really looking for at least one more spike higher.
I agree. I really am only keen on Lara’s view at some point today.
Futures pushing higher 2085 CASH now mattey… Draghi could help lift it back up! JAW BONE!!!
verne
you are a great guy but i am just saying – I like to wait for more signs for the BIG SHORT 🙂
Things just don’t end like this mattey 🙂
It is completely understandable that we project future events by looking at what has happened in the past. The very bearish wave count at super cycle degree puts us in uncharted waters and Mr. Market generally does the unexpected…
1 Day to me is not enough. Fridays close is important!
That could very well be 100 SPX points away. I don’t know about you but I am looking for a third wave down at intermediate degree and those don’t play around. If the third down has indeed started, it is going to make the heads of the bulls spin…intermediate one down had a 1000 point down day in the DOW diamonds.
5 wave down complete on the smaller chart. We get a bounce at the open tomorrow and see where we GO. NEVER TO LATE TO GET SHORT. OH and that -1000 point down day is usually at the END of a move not the beginning mattey 🙂
I am bullish still NDX still strong – Just saying all!
Is that a bearish engulfing candle that I am smelling? Sniff…sniff…! 😀
CHECK IT AT THE CLOSE. WE STILL GOT TIME…
Are you kidding me???!!! GET SHORT!!!!
Somebody just shorted the SPX BIG TIME…
What is the target retrace from your side?
I can wait 1 more day… I am not convinced yet matteyy. Seriously.
While of course not definitive and good enough for a conviction, one can make a strong case for at least an indictment based on today’s market action. The bearish engulfing candlestick coupled with the new 52 week UVXY low are huge red flags. VIX moved higher along with the market, MACD has turned down. Retracements will probably continue to be deep but I think the next sign to look for is a close below 2070 and a knife through the 200 day MA. Folks buying today’s dip are going probably not going to be happy…
UVXY is not a good sign imo.. but lets wait for the judgement tomorrow mattey..
I agree BTD are clowns…
Definitely not for the uninitiated matey. One has to be nimble and very precise about entry and exits. Intermediate term (at least a month out) call options after a new 52 week low are generally low risk though no reliable predictor of long term market action.
I dont want to jump the gun here. Been burned to many times man…
Me too…and man I just hate that!! 😀
UVXY rocketed off the bottom like I have never seen! It usually bounces along the bottom for a a week or so after making a new 52 week low. The window to get positioned was the shortest I have seen…ever! Calls already up over 100% !!
This could get real interesting folks.
verne
honestly i can wait for the closing print…2086 🙂
Nothing at all wrong with that…cautious is good.
Spyder gold etf made a new 52 week low today following yesterday’s bounce. I think that’s all she wrote for the ending diagonal at least for the intermediate term. COT positions and sentiment at an extreme.
Ooops! Wave four getting really close to that invalidation point of 2090.74 for the contracting diagonal…I still think we have one more pop…
BULLISH!
hi
all
As I said early on TECH is so strong despite all other S&P sectors….
Following my first hourly wave count (presented with the bull) what if minor 4 was a combination (and that looks right, better alternation) and this final fifth wave for minor 5 is a diagonal which began there?
This upwards move so far looks pretty choppy and overlapping.
And so what if we move minute i up to the last high, now it’s a zigzag. That may be minute i of an ending diagonal.
With the diagonal beginning higher than I have it on the other hourly chart now the structure can manage to make a new high above 2,116.48 and complete. It’s highly unusual for fifth wave ending diagonals to be truncated. So it really does need to be able to end above 2,116.48 if we’re going to consider it, otherwise the probability is just too low and we need to consider other ideas.
So I’m going to relabel the hourly charts today to follow the first idea which sees minor 4 a combination ending on the red candlestick of 30th November.
And a fifth wave ending diagonal beginning there.
At the hourly chart level this means the invalidation point has to move lower to 2,080.95. For the diagonal wave 1 is over and wave 2 is currently underway. This would expect more downwards movement to complete a zigzag for wave 2 which can’t move below the start of wave 1. It should be deep, and its not done yet. So this idea expects some more downwards movement from here.
A choppy overlapping annoying end to this bear market rally. And time consuming. I may need to reevaluate the time expectations for this C wave, I don’t think it can complete now in a total Fibonacci 13 days.
Appreciate Lara for your great sharing timely.
C of minuette four in play. Final pop up should start soon. To be triggered by some sort of FEDSPEAK no doubt…
I really like Lara’s diagonal wave count. If correct we should be seeing a choppy abc for minuette four and another one for minuette five. It will be interesting to see how the market responds to any dovish comments from FED. They have already trotted out Charles Evans of the Chicago bank yesterday to walk back the rate hike prospects. The market is going to blow a stack of they play that card.
Hi Vern I missed the “Charles Evans of the Chicago bank yesterday to walk back the rate hike prospects.” Do you mean another delay may be in the cards?
I think they are going to float some trial balloons on that score. I have watched in amazement at either the gullibility or the complicity of all the talking heads insisting that a rate hike was a foregone conclusion. The FED is facing quite a dilemma – either bring the runaway free-money train to a screeching halt (never mind the talk about a slow rate of increase) and blow up the equity markets as bonds begin to tank, or shred every last bit of any remaining credibility they have and blow up the equity markets as the crowd begins to realize that emperor has no clothes- not a stich.
UVXY making a new 52 week low today so traders optimistic a Santa Claus Rally is in our immediate future. This trade triggers only once or twice a year. Please take advantage of the market makers with January or later option calls. I got filled on the 50 strikes at a great price! Go get em’…. 😀
Oh dear, that third wave of the potential diagonal didn’t manage to move high enough to be longer than the first.
Which means the potential diagonal must be contracting.
The limit for the fourth wave is no longer than equality with the second, it should be shorter for a contracting diagonal. That limit now is at 2,090.74.
The fifth wave has a limit, it may not be longer than equality with the third (and the third can’t be the shortest) so that limit will be 22.96 total length.
If the fourth wave ends at the low we have on the current hourly candlestick which I have at 2,093.32 then the limit for this structure to end is at 2,116.28.
That would have a truncation of 0.2.
It can’t do it. It cannot complete and not be truncated now.
Unless…… my analysis of that third wave as over is wrong and its continuing. I guess this downwards move today could be part of wave B within the third wave zigzag.
I think your analysis is right on the money Lara. The price action has, at least in my opinion, been screaming truncation and I am not in the least bit surprised by your conclusion regarding the wave structure. I think we are seeing yet another triangle for the fourth wave to be followed by yet another sharp, brief spike up for the fifth wave to put a bow on this baby.
I just read Yellen’s speech and as I expected…blah! blah! blah! 🙂
Of interest re crash in Dec
Since 1990, the S&P 500’s average price change for December has been +1.83%, which exceeds that of every other month, including October’s 1.77% average gain.
From the Stock Market Almanac
The S&P Weekly chart still looks strong except for the ADX which , as is , means nothing to me …..Lara?
The ADX line is declining so it’s indicating no current trend, but that’s the weekly chart level. I prefer to use ADX at the daily chart level only.
I can see strong divergence going back months on this chart between price as it made new all time highs and RSI (14), MACD and Stochastics.
I’m not familiar with the oscillator COPP you have there, but it too appears to be showing strong divergence.
To me that looks pretty weak.
Ok, (good!)
The COP and MACD divergences : The slope down from 2013 ?
What would it take to ‘reset’ those indicators?
Would the dump after PW 3 not have done it?
Thanks
After reading so many technical books I must say there is no substitute for this analysis. Thanks Lara for your Elliott Wave Technical Analysis.
laters…
Thank you very much!