
Downwards movement was expected. This is not what happened.
Price remains below both invalidation points on the hourly charts.
Summary: The trend is still down. This upwards movement may end tomorrow about 2,061. Thereafter, more downwards movement should unfold. Price is finding support at a horizontal trend line on the regular technical analysis chart and may find resistance at the 200 day moving average. The next wave down should break through support and fall from there.
To see how each of the bull and bear wave counts fit within a larger time frame see the Grand Supercycle Analysis.
To see last analysis of weekly and monthly charts click here.
If I was asked to pick a winner (which I am reluctant to do) I would say the bear wave count has a higher probability. It is better supported by regular technical analysis at the monthly chart level, it fits the Grand Supercycle analysis better, and it has overall the “right look”.
New updates to this analysis are in bold.
BULL ELLIOTT WAVE COUNT
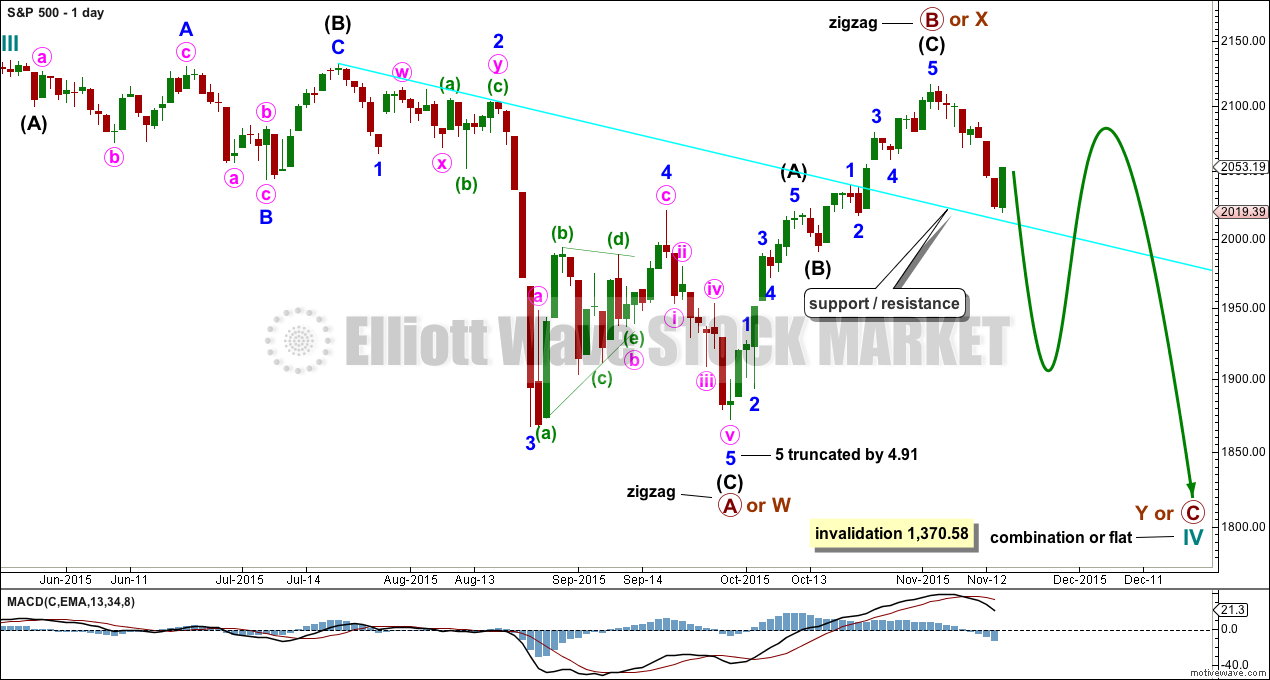
DAILY CHART – COMBINATION OR FLAT
Click chart to enlarge.
Cycle wave IV should exhibit alternation to cycle wave II.
Cycle wave II was a shallow 0.41 zigzag lasting three months. Cycle wave IV should exhibit alternation in structure and maybe also alternation in depth. Cycle wave IV may end when price comes to touch the lower edge of the teal channel which is drawn about super cycle wave V using Elliott’s technique (see this channel on weekly and monthly charts).
Cycle wave IV is may end within the price range of the fourth wave of one lesser degree. Because of the good Fibonacci ratio for primary wave 3 and the perfect subdivisions within it, I am confident that primary wave 4 has its range from 1,730 to 1,647.
If a zigzag is complete at the last major low as labelled, then cycle wave IV may be unfolding as a flat, combination or triangle.
Primary wave B or X upwards is a single zigzag. Upwards movement has reached above 2,108.44. Primary wave B has passed the minimum requirement for a flat correction of 90% the length of primary wave A, and so cycle wave IV may be unfolding as a flat correction.
Cycle wave IV may also still unfold as a combination: zigzag – X – flat. Both a flat or combination would provide alternation with the single zigzag of cycle wave II.
If cycle wave IV is unfolding as a combination, then primary wave Y should be a flat correction. Within primary wave Y, minor wave B may make a new high above the start of minor wave A at 2,116.48 as in an expanded flat. There is still no upper invalidation point for this wave count at the daily chart level for this reason.
Primary wave A or W lasted three months. Primary wave Y or C may be expected to be about the same, about three months in total.
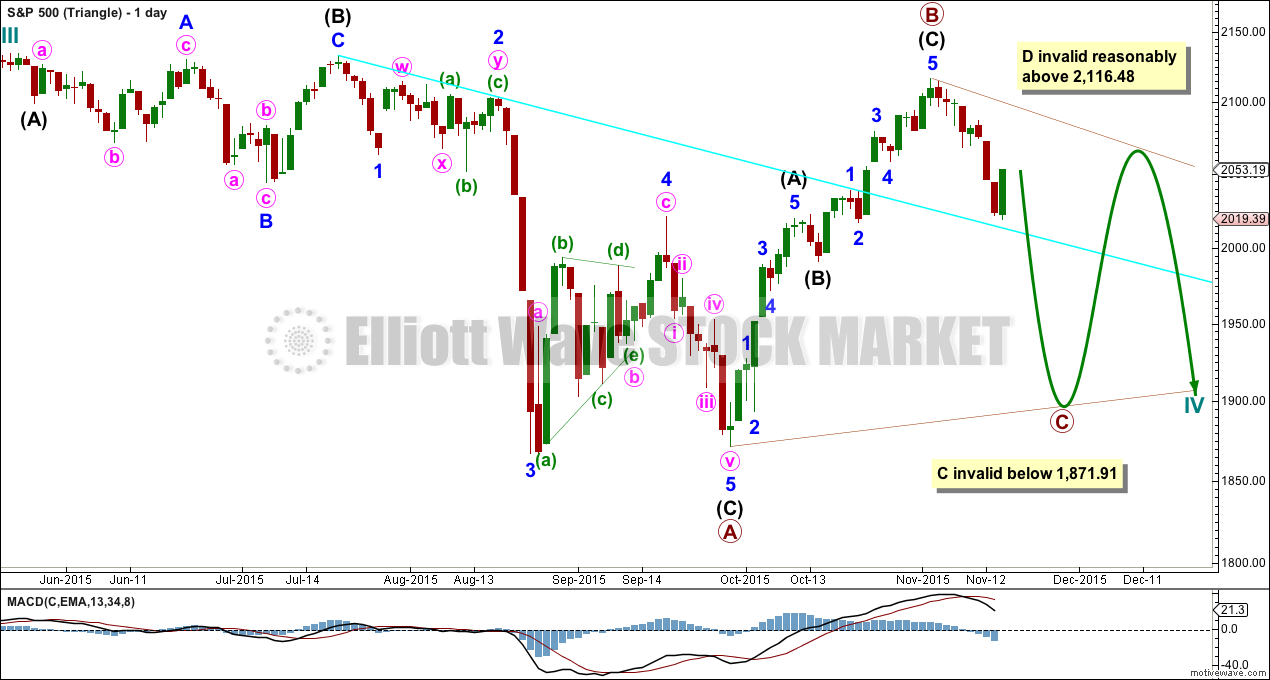
DAILY CHART – TRIANGLE
Click chart to enlarge.
Cycle wave IV may unfold as a shallow triangle. This would provide alternation with the 0.41 zigzag of cycle wave II.
Primary wave B may be unfolding as a zigzag.
Primary wave C may unfold as a single or double zigzag. Within primary wave C, minor wave B may not move beyond the start of minor wave A above 2,116.48.
Primary wave C of a barrier or contracting triangle may not move beyond the end of primary wave A at 1,871.91.
The whole structure moves sideways in an ever decreasing range. The purpose of triangles is to take up time and move price sideways.
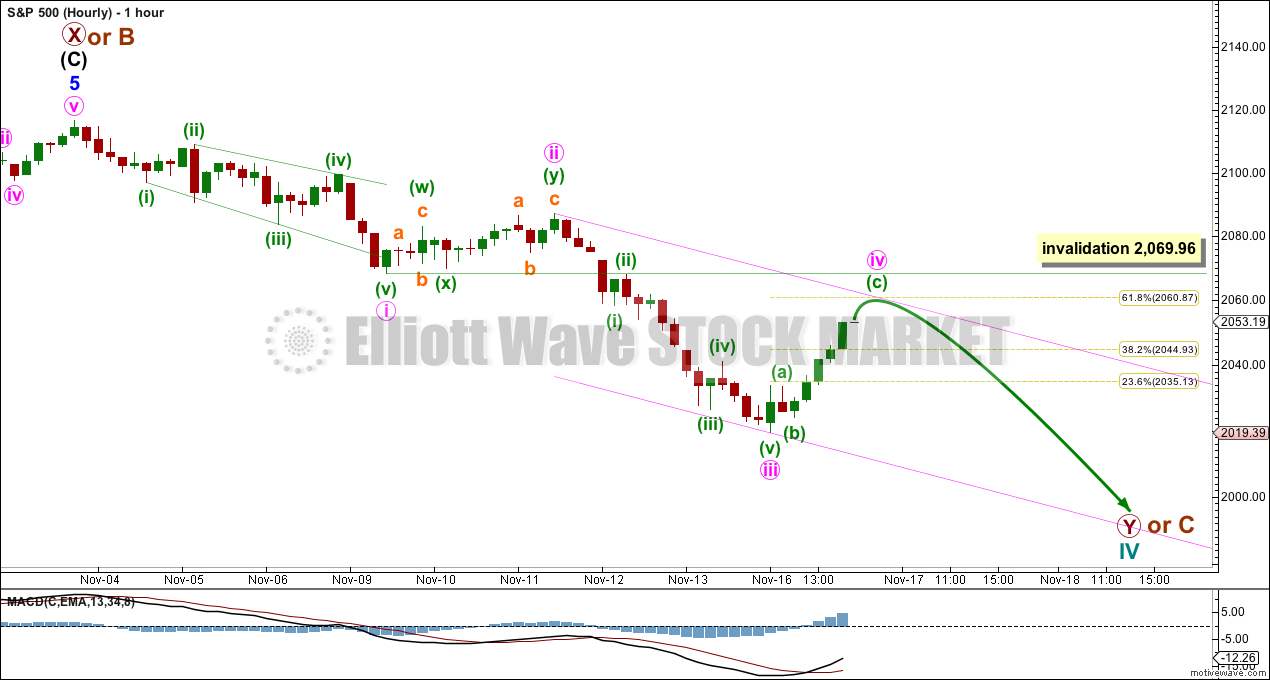
HOURLY CHART
Click chart to enlarge.
This first hourly chart and the one presented below for the bear wave count both work in the same way for both wave counts. Downwards movement may have begun with a leading expanding diagonal for a first wave, followed by a shallow double zigzag for a second wave.
The duration of upwards movement which unfolded on Monday looks like minute wave iv. The degree of labelling within the end of minute wave iii has been moved up one degree.
If this upwards movement is minute wave iv, then both of minute waves ii and iv show on the daily chart. They both have a similar duration so far, so this wave count has the right look at the daily and hourly chart level.
There is no Fibonacci ratio between minute waves iii and i. This makes it more likely that minute wave v will exhibit a Fibonacci ratio to minute waves i or iii. The most likely would be equality in length with minute wave i at 48.24 points. The next most likely would be 1.618 the length of minute wave i at 78.05 points.
If price remains below 2,069.96, then this wave count would be more likely to be correct at the hourly chart level than the second scenario presented below.
Minute wave ii was a shallow 0.39 double zigzag. Minute wave iv may exhibit a little alternation in structure as a single zigzag, and good alternation in depth if it ends at the 0.618 Fibonacci ratio at 2,061.
Minute wave iv may not move into minute wave i price territory above 2,069.96.
ALTERNATE BULL ELLIOTT WAVE COUNT
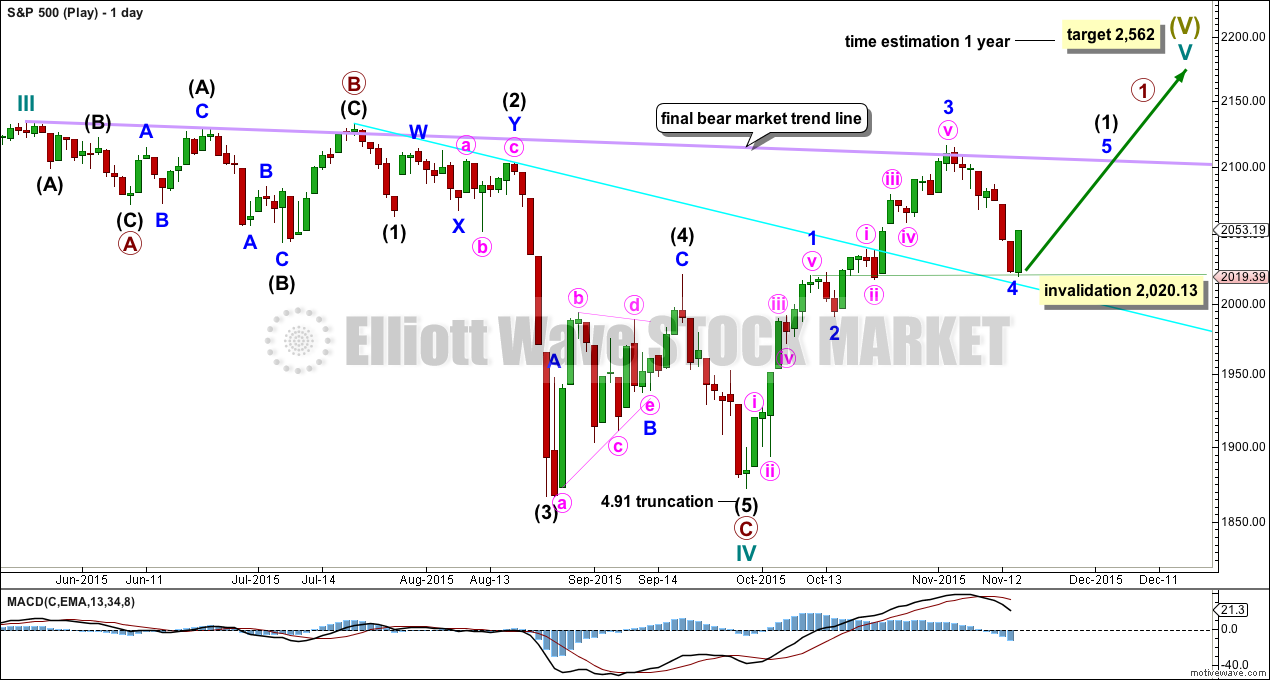
DAILY CHART
Click chart to enlarge.
It is possible to see cycle wave IV a completed flat correction. This would provide some structural alternation with the zigzag of cycle wave II.
This is a regular flat but does not have a normal regular flat look. Primary wave C is too long in relation to primary wave A. Primary wave C would be 3.84 short of 4.236 the length of primary wave A. While it is possible to also see cycle wave IV as a complete zigzag (the subdivisions for that idea would be labelled the same as the bear wave count below, daily chart) that would not provide structural alternation with the zigzag of cycle wave II, and so I am not considering it.
This idea requires not only a new high but that the new high must come with a clear five upwards, not a three.
At 2,562 cycle wave V would reach equality in length with cycle wave I. Cycle wave I was just over one year in duration so cycle wave V should be expected to also reach equality in duration. Cycle degree waves should be expected to last about one to several years, so this expectation is reasonable. It would be extremely unlikely for this idea that cycle wave V was close to completion, because it has not lasted nearly long enough for a cycle degree wave.
I added a bear market trend line drawn using the approach outlined by Magee in “Technical Analysis of Stock Trends”. When this lilac line is clearly breached by upwards movement that shall confirm a trend change from bear to bull. The breach must be by a close of 3% or more of market value. If it comes with a clear five up, then this wave count would be further confirmed.
While price remains below the bear market trend line, we should assume the trend remains the same: downwards.
Minor wave 3 should be complete. Minor wave 4 may not move into minor wave 1 price territory below 2,020.13.
This wave count does not have support from regular technical analysis and it has a big problem of structure for Elliott wave analysis. I do not have confidence in this wave count. It is presented as a “what if?” to consider all possibilities.
BEAR ELLIOTT WAVE COUNT
DAILY CHART
Click chart to enlarge.
This bear wave count has a better fit at Grand Super Cycle degree and is better supported by regular technical analysis at the monthly chart level. But it is a huge call to make, so I present it second, after a more bullish wave count, and until all other options have been eliminated.
There are two ideas presented in this chart: a huge flat correction or a double flat / double combination. The huge flat is more likely. They more commonly have deep B waves than combinations have deep X waves (in my experience).
A huge flat correction would be labelled super cycle (a)-(b)-(c). It now expects a huge super cycle wave (c) to move substantially below the end of (a) at 666.79. C waves can behave like third waves. This idea expects a devastating bear market, and a huge crash to be much bigger than the last two bear markets on the monthly bear chart.
The second idea is a combination which would be labelled super cycle (w)-(x)-(y). The second structure for super cycle wave (y) would be a huge sideways repeat of super cycle wave (a) for a double flat, or a quicker zigzag for a double combination. It is also possible (least likely) that price could drift sideways in big movements for over 10 years for a huge triangle for super cycle wave (y).
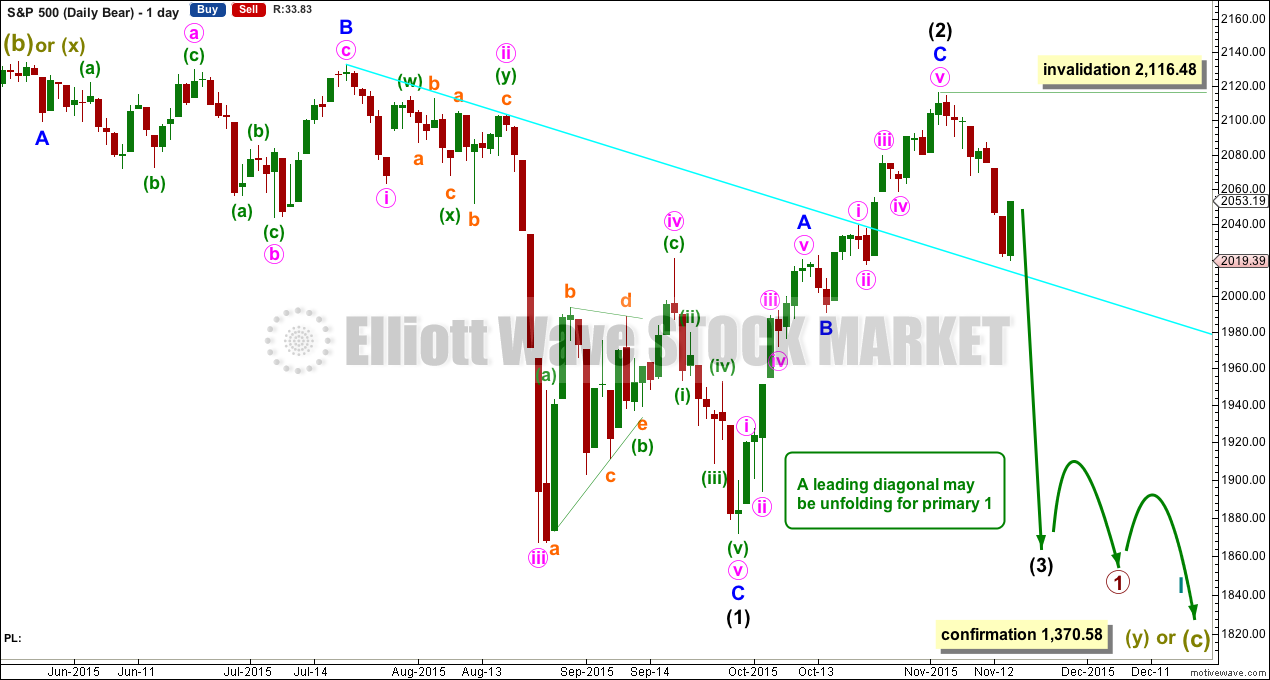
The bear wave count sees a leading diagonal for a primary degree first wave unfolding. Within leading diagonals, the first, third and fifth waves are most commonly zigzags but sometimes may appear to be impulses. Here intermediate wave (1) is seen as a complete zigzag.
No second wave correction nor minor wave B may move beyond the start above 2,116.48 within intermediate wave (2).
Intermediate wave (3) must move beyond the end of intermediate wave (1) and it would most likely be a zigzag.
HOURLY CHART
Click chart to enlarge.
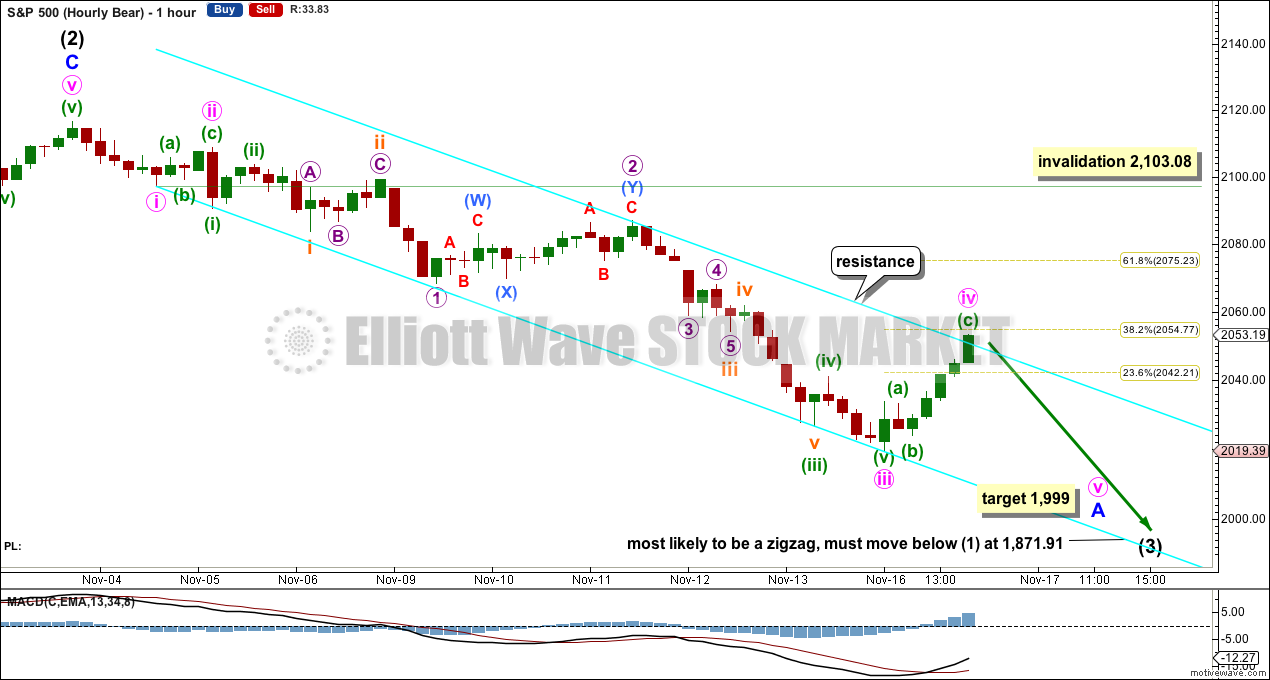
Because I have two hourly charts which both expect a five down to be unfolding at the hourly chart level I am using them to illustrate two ideas. Both hourly charts work in the same way for both daily bull and daily bear wave counts.
Because leading expanding diagonals are not very common, and because they are normally followed by deep second waves when they do occur, the first idea presented for the bull wave count has problems.
An impulse is a more common structure for a first (or A) wave. If an impulse is unfolding downwards, then the middle may have recently passed and a series of fourth wave corrections may be underway.
There is no Fibonacci ratio between subminuette waves i and iii. Subminuette wave v is 0.7 points short of equality in length with subminuette wave i.
Minuette wave (iii) is complete and 4.1 points longer than 4.236 the length of minuette wave (i).
This wave count no longer has the right look at the hourly chart level. The proportions look wrong. This upwards correction looks more like a fourth wave corresponding to the second wave labelled here micro wave 2. However, this wave count remains valid and sometimes the S&P does not always exhibit good proportions. If the first idea is invalidated, then this idea would be used for both bull and bear wave counts at the hourly chart level.
Minute wave iv may not move into minute wave i price territory above 2,103.08.
Minute wave v down may reach 0.618 the length of minute wave iii at 1,999.
TECHNICAL ANALYSIS
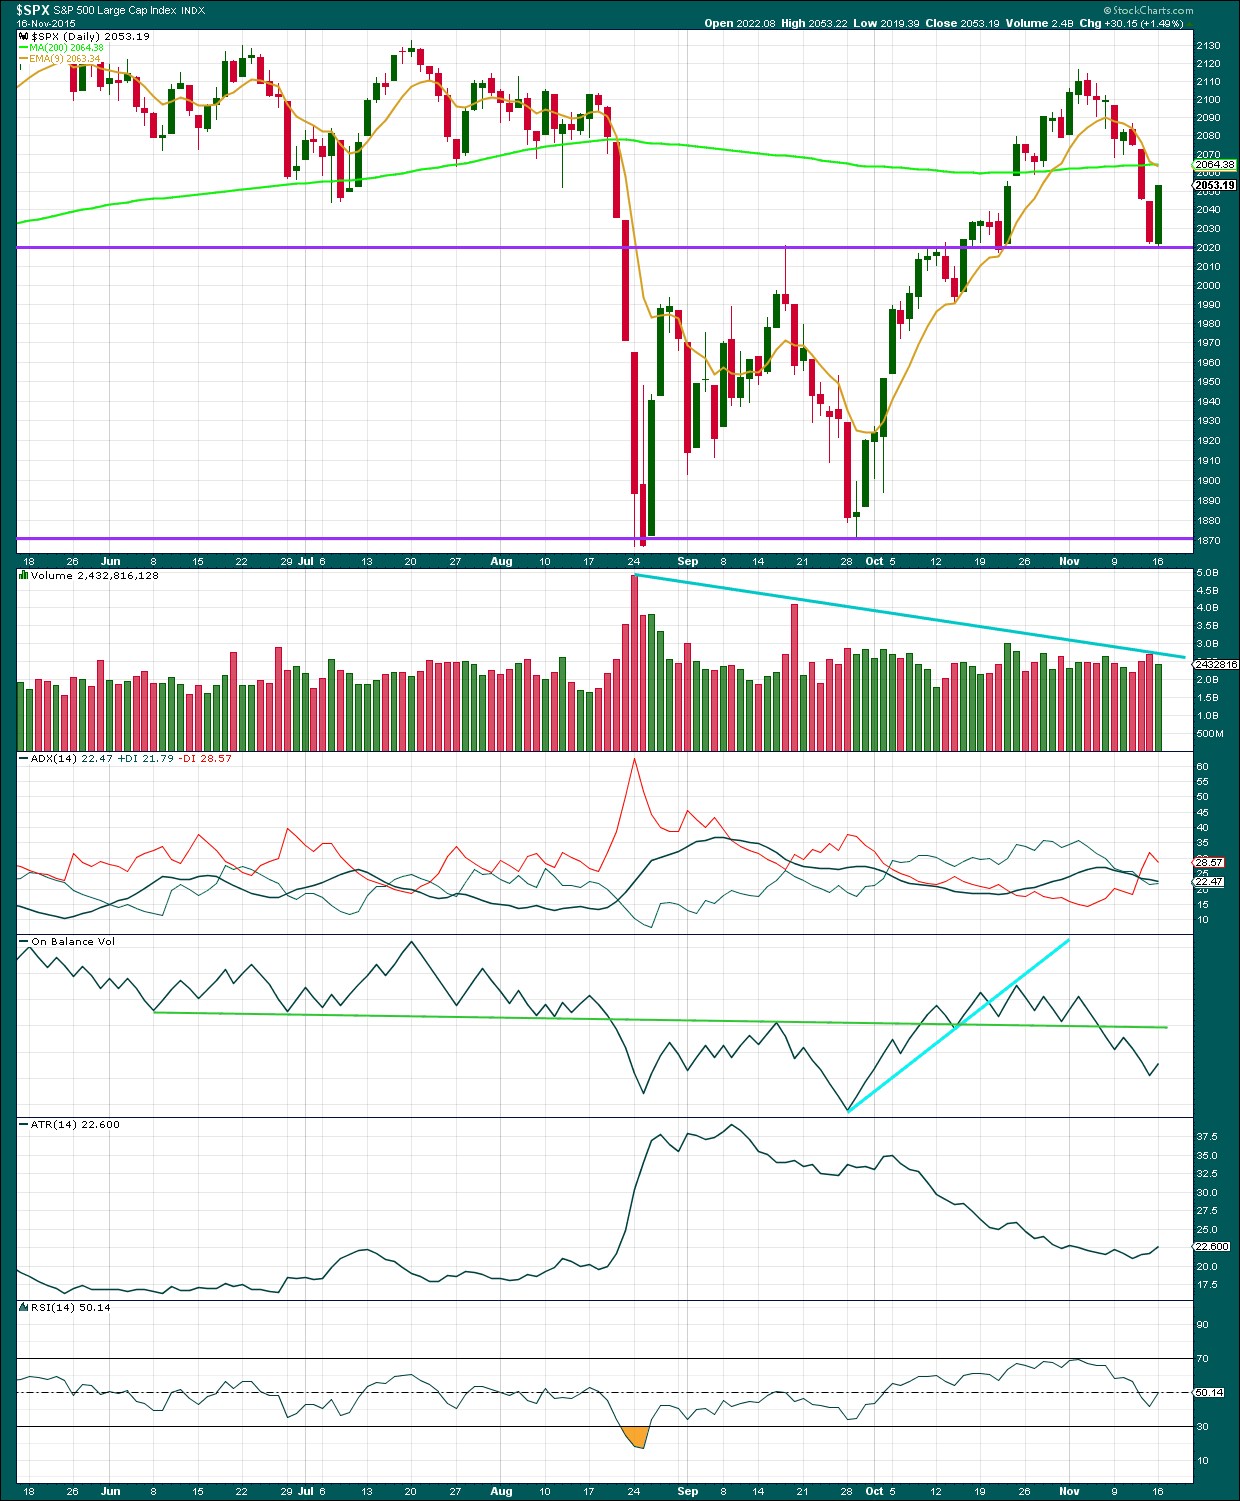
Click chart to enlarge. Chart courtesy of StockCharts.com.
Daily: A strong upwards day completes a bullish engulfing candlestick pattern. Coming at a strong support line, this would indicate more upwards movement is most likely from here; engulfing candlestick patterns are the strongest reversal patterns. However, lighter volume does not support the rise in price meaning this upwards day is suspicious. In order to have any confidence in more upwards movement from here another green candlestick would confirm a trend change at least short term. This conflicts with the Elliott wave counts.
The +DX and -DX lines have crossed indicating a trend change. ADX does tend to be a lagging indicator (it is based on moving averages which necessarily are lagging). If the black ADX line turns upwards in the next few days, then a downwards trend would be indicated. For now the ADX line is flat not yet quite indicating a trend.
ATR still agrees with ADX (ATR is also based upon an average, so also necessarily is a lagging indicator). If ATR turns up, then it would be expected that the market is again trending. After a period of declining range it would be expected that ATR would turn up. A trend does look like it may be in the early stages.
Price has moved strongly below the 200 day moving average and closed below it. As expected, price is finding support at the horizontal trend line about 2,020. If price can break below this line this week, that would be a strong bearish indicator. Conversely, if price can close above the 200 day moving average, that would be a strong bullish indicator. While price remains between the two they may provide some support and resistance.
On Balance Volume is a leading indicator and usually works well with trend lines. At this stage, OBV remains below the green trend line. This line is very shallow, repeatedly tested, reasonably long held, and highly technically significant. The breach of OBV below that line is a reasonably strong bearish signal and supports all wave counts with the exception of the very bullish “alternate bull Elliott wave count” which has no technical support at all.
A note on Dow Theory: for the bear wave count I would wait for Dow Theory to confirm a huge market crash. So far the industrials and the transportation indices have made new major swing lows, but the S&P500 and Nasdaq have not.
S&P500: 1,820.66
Nasdaq: 4,116.60
DJT: 7,700.49 – this price point was breached.
DJIA: 15,855.12 – this price point was breached.
To the upside, for Dow Theory, I am watching each index carefully. If any make new all time highs, that will be noted. If they all make new all time highs, then a continuation of a bull market would be confirmed. So far none have made new all time highs.
This analysis is published about 10:30 p.m. EST.
Leading diagonal down?? The y will not go quietly…into the night….
The first hourly wave count remains valid and still looks better than the second idea.
Price seems to be finding strong resistance at the 200 day moving average.
I’ll be expecting a red candlestick for tomorrow, or a doji possibly. But tomorrow I’ll expect price to go down from here.
I’ll watch momentum. If it increases then the hourly wave count may be changed to see an extending third wave. If it doesn’t the hourly wave count will remain the same and I’ll still prefer the first idea.
I’m going to change the very bullish alternate. 4 overlapped 1 so the way I had it labelled is now invalid. This gives a little more confidence that the S&P remains in a bear market. But on the daily chart I can move minor 3 and 4 to an earlier spot and the upwards impulse now looks complete. So a very bullish wave count would now expect an intermediate (2) down to not move below 1,871.91. It will fit on the hourly chart. And so it must be considered. No divergence in expected direction for now though, still down.
hi
Lara,
Great work, Actually markets are selling off now just as you outline. Yes- Finally! geez – no jinx but hopefully bears can get 5 or 10 points 🙂
Hi
All,
VIX Hammer…
Thanks Lara – don’t know about anyone else but providing your thoughts near end of the trading day is incredibly valuable to me and very much appreciated!
hi
Lara,
If you could estimate SPX target 1,871.91 – Do you think maybe by December 15, 2015?
Sorry I found this answer below – disregard.
Lara
Given c or y is 3 months induration.What is the minimum target for this current decline ?
1980 or 1950 ??
Hi there
Lara
What is the min target for this decline? 1950ish ?
vernecarty,
What is going on now? Looks like we are fading SPX looks like a reversal right?
It looks (and sounds…) to me like the bears are growling…let’s not jump the gun though and wait for the close. If we get a red candle today, the bulls are toast…or should I say steak?!
In addition, I particularly want to see a bullish engulfing candlestick in UVXY
vernecarty,
Thanks, It still safe to sell this market here for a 1% move down at least. Selling the QQQs at 111 for 50 points not a bad idea.
Absolutely! Sharp traders have been getting positioned in this market all the way up and are already sitting on green positions. The rest of us have to be a bit more conservative until our accounts sport seven figures 😀
vernecarty,
i backed out. Market moved 15 cents on the qqqs and it is a heavy loss. So, will wait for confirmation till the close like you said.
Smart…
vernecarty,
thanks, jumped back in couldn’t help but notice the patterns are screaming sell.
vernecarty,
I learned the hard way. Never underestimate the cb or the drugged bulls in this market….
vernecarty,
USDJPY following the equity moves.
Good indicator to keep an eye on…especially overnight…
The key is to learn from mistakes…believe me, over the years I have made a ton of ’em…
vernecarty,
I agree my finance professor in college told me the key to trading.
a. buy low.
b. sell high.
vernecarty,
I have only been recently watching the dip buyers. How long has this nonsense being going on in markets in your experience? It is almost to easy to trade, just by a red day and you win 🙂
The fact of the matter is that the dip buyers have been right for years and the instinct to do it is really entrenched. There is still an unbelievable amount of bullishness in this market despite the long term red flags. It speaks volumes about the nature of the decline I think is ahead….all the talking heads are yapping about preparing a buy list…have they been looking at the breadth of this market and how many stocks are ALREADY trading BELOW their 200 day MA..??!!… I don’t think so…
vernecarty,
oh o.k – I agree – especially that narrow leadership. Just awful.
Word Puzzle for you:
S _ _ L _ _ F
Bulls are making their move and punched through what was starting to look like a double top failure at 200 day MA on the five minute chart. If the bears are going to prowl, now is when they will. Otherwise, we are looking at probably SPX new highs.
vernecarty,
No pull backs? 3-4% in 2 days and we can’t get a 1% down day?
The next decline is going to be ugly…it looks like the bears have spoken…er…growled….
vernecarty,
Im out not to much near flat. Waiting for confirmation at the close to go short…
vernecarty,
Shooting star reversal on SPX if we close like this…. 🙂
vernecarty,
What is your take now? down hill?
Yep…
Vernecarty,
What is your Spx target on this move lower ?
doji on the VIX.
We need to wait for the close…markets like this can move so fast it will make your head spin. There is an awful lot of energy being stored for a move that I think is going to be violent. If we get a doji or dragonfly on the indices today look for the banksters to furiously buy the indices overnight to try and mislead the crowd. The key is still the 200 day MA.
vernecarty,
Nice double bottom on 5min with a MACD cross over – could just go higher I guess – why not right?
Volume suggesting a head fake…VIX and UVXY heading North…
Could the word possibly be… FFOLLES??!!…oops! I think I got that backasswards!! 😀
Sell off actually …. 😉
As I said…read it backwards…sorry, my humour sometimes is a bit wry… 🙂 🙂 🙂
Haha ok
200 dma spx reached just wow great cb work…..
So far, picture perfect smooch of 200 day MA by SPX!
The much-anticipated assault on the 200 day MA is hardly convincing. What on earth could yesterday’s enthusiastic bulls possibly be waiting for? Maybe they spotted a Grizzly hiding in the brush….! 😀
I have never ever seen a daily bullish engulfing candlestick immediately followed by a bearish one…ever. If the bulls are not careful, they are going to find themselves in uncharted waters….
Talking about ‘kissing’ …..Lara’s line and channel top
Red channel on ES holding for the moment
Nuts! I just noticed the gap (bright blue) Maybe that is the target….
Isn’t she awesome??!! 😀
Yeah!
Where we stopped yesterday 200Hourly MA and maybe that black dotted channel line.
There is also a fibo line just underneath Lara’s ‘line in the sand’ ……….
As of 2:42 PM Euro time the daily ES is pushing against red channel top
SPX cash sailed right through it’s version of the channel yesterday
The shorter time frames had more oversold ‘boost’ than expected: Hourly time frame is on its’s way up…….
Something strange about this, Wall street psyhco’s must be relieved it was Paris that got hit and not NYC
Hi Lara,
Was the alternate bull daily count invalidated yesterday with the low being 2019.39?
Thank you,
Corey
I also thought it had been invalidated – not sure why that count was published again?
Oh goodness, yes!
So sorry. Won’t publish that one again.
Apparently they are extremely rare but a few 5-3-5-3-5 leading diagonals have been seen. Could your first bull wave count be used with the bear wave count to address the matter of the “right look”?
I’ll assume you’re referring to hourly and not daily charts.
If you mean can the first five down be wave 1 of a leading diagonal, then no. The rule is a first wave of a leading diagonal is most commonly a zigzag, and sometimes it may be an impulse. But it cannot be any other structure.
That first hourly chart has it as a diagonal. Not a zigzag or impulse.
I’ve made some assumptions in this answer about what you’re referring to. If my assumptions are incorrect please let me know.
Your assumptions are absolutely correct milady…
Hi
Lara,
Awesome analysis. My question is the following. In the chart attached. You have the green line that is lining up with 1900. What time estimate do you have for that target if we break support from here?
Dec 2015?
Jan 2016?
A total three month duration for primary Y or C. That would see it last Nov – Dec – Jan so end early Feb.
Thanks Lara. Is it possible it can be shorter like the last drop we had in August ? Just 4 days – 13%?
Hi
vernecarty,
Looks like we have to see what happens with that 200 DMA “2064”. We should know tomorrow or the next day. The only thing that is suspicious of this move up as well is the famous options expiration week. My guess is we have to reverse and we could make a huge wick on the VIX forming a hammer.
Charts attached. Enjoy!
Hi
vernecarty
VIX attached…
Thanks for the great charts. A picture is worth a…well you know…:D
Why can’t your wave IV replace your wave (3) and wave 2 then replace IV.
I noticed the recent pullback retraced 38% of the previous advance from 1872 – 2116. The current up move would then be wave 5 to new highs?
Some analysts are counting the waves that way. It is essentially the same idea as Lara’s very bullish wave count. Sunday night was a good example of what I think is a clear example of central bankster co-ordination when futures went from almost 1 1/2 % down overnight to green just before the opening in ALL markets. They were clearly responding to the obvious fear generated by the Paris attacks and several commentators noted how counter-intuitive the market’s behaviour was, as if they had never heard of central banksters! An awful lot of buying power was expended in that feat. I am still uncertain about how and if this affects the developing waves but they are certainly going to do their best to delay the inevitable. Futures indicating continuation of the DCB. I suspect the 200 day MA will tell all.
Thanks, will be watching the short term advance off the 2019 low. Looks like 1 -2 so far with 3 in progress?
vernecarty,
I agree about the CB in this case. My guess is that VIX open gap at 16 will give us a clue when that it is safe to SHORT this market.
We could have a couple paths though – like the following:
SPX
a. We pull back to 2033.
b. Sky rocket to 2065-2080.
c. Roll the market over to 1950-1900-1850 in December(The December correction is in the cards)
vernecarty,
On second thought – we really have 2 paths – up or down.
a. we take out the 2064 and 2072 resistance cluster and we will test 2116.
b. we fail at the resistance area 2064 ish we should fail down to atleast 1991.
R.I.P. …all ye bulls…or should I say bullocks…??!! 😀