
Downwards movement was expected and ended at an expected line of support.
Summary: The trend is down. The alternate which allowed for more upwards movement has been invalidated. This may be a big third wave at intermediate degree unfolding, so expect any surprises to be to the downside. The target at 2,009 may be met on Tuesday next week. After that target is met a small correction should last only a very few days; the trend will remain down.
To see how each of the bull and bear wave counts fit within a larger time frame see the Grand Supercycle Analysis.
To see last analysis of weekly and monthly charts go here.
If I was asked to pick a winner (which I am reluctant to do) I would say the bear wave count has a higher probability. It is better supported by regular technical analysis at the monthly chart level, it fits the Grand Supercycle analysis better, and it has overall the “right look”.
New updates to this analysis are in bold.
BULL ELLIOTT WAVE COUNT
DAILY CHART – COMBINATION OR FLAT
Click chart to enlarge.
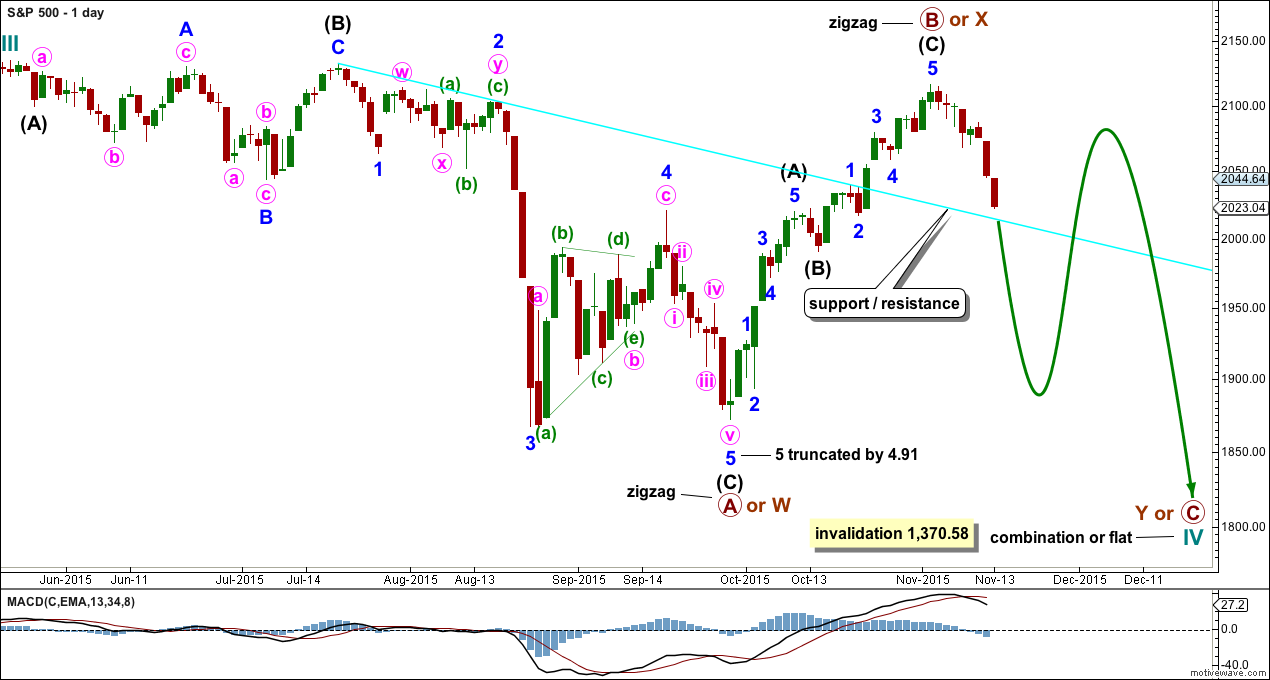
Cycle wave IV should exhibit alternation to cycle wave II.
Cycle wave II was a shallow 0.41 zigzag lasting three months. Cycle wave IV should exhibit alternation in structure and maybe also alternation in depth. Cycle wave IV may end when price comes to touch the lower edge of the teal channel which is drawn about super cycle wave V using Elliott’s technique (see this channel on weekly and monthly charts).
Cycle wave IV is may end within the price range of the fourth wave of one lesser degree. Because of the good Fibonacci ratio for primary wave 3 and the perfect subdivisions within it, I am confident that primary wave 4 has its range from 1,730 to 1,647.
If a zigzag is complete at the last major low as labelled, then cycle wave IV may be unfolding as a flat, combination or triangle.
Primary wave B or X upwards is a single zigzag. Upwards movement has reached above 2,108.44. Primary wave B has passed the minimum requirement for a flat correction of 90% the length of primary wave A, and so cycle wave IV may be unfolding as a flat correction.
Cycle wave IV may also still unfold as a combination: zigzag – X – flat. Both a flat or combination would provide alternation with the single zigzag of cycle wave II.
If cycle wave IV is unfolding as a combination, then primary wave Y should be a flat correction. Within primary wave Y, minor wave B may make a new high above the start of minor wave A at 2,116.48 as in an expanded flat. There is still no upper invalidation point for this wave count at the daily chart level for this reason.
Primary wave A or W lasted three months. Primary wave Y or C may be expected to be about the same, about three months in total.
DAILY CHART – TRIANGLE
Click chart to enlarge.
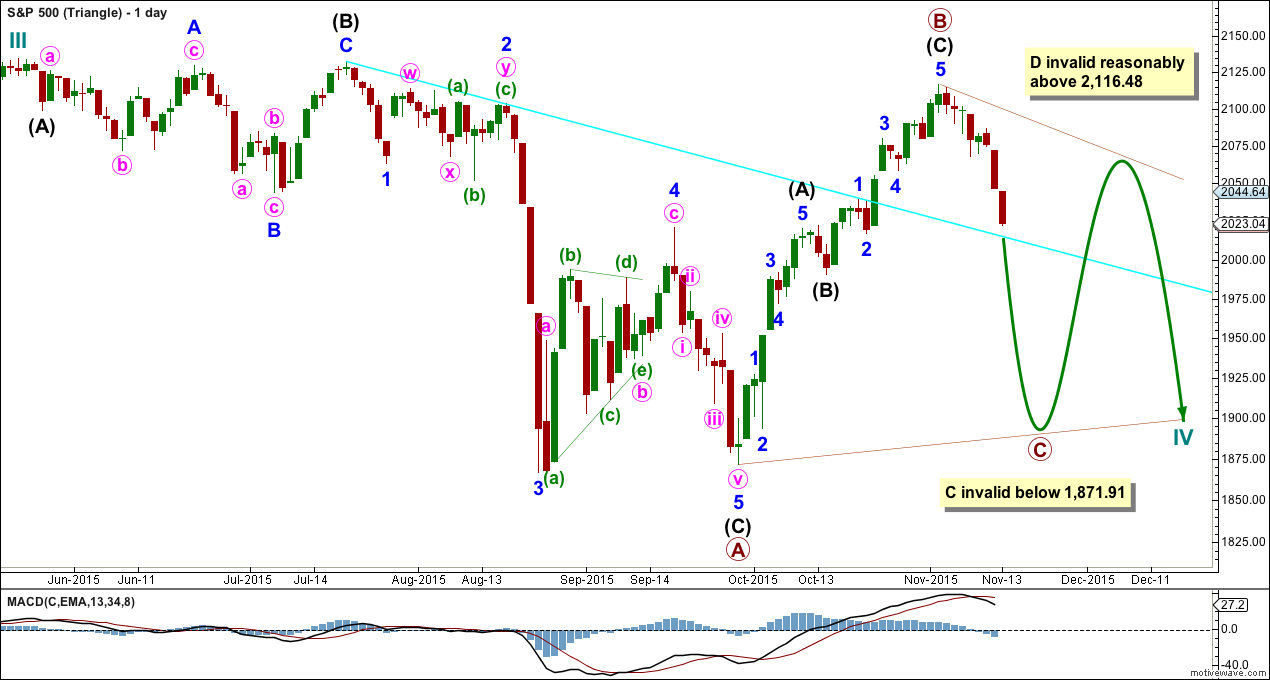
Cycle wave IV may unfold as a shallow triangle. This would provide alternation with the 0.41 zigzag of cycle wave II.
Primary wave B may be unfolding as a zigzag.
Primary wave C may unfold as a single or double zigzag. Within primary wave C, minor wave B may not move beyond the start of minor wave A above 2,116.48.
Primary wave C of a barrier or contracting triangle may not move beyond the end of primary wave A at 1,871.91.
The whole structure moves sideways in an ever decreasing range. The purpose of triangles is to take up time and move price sideways.
HOURLY CHART
Click chart to enlarge.
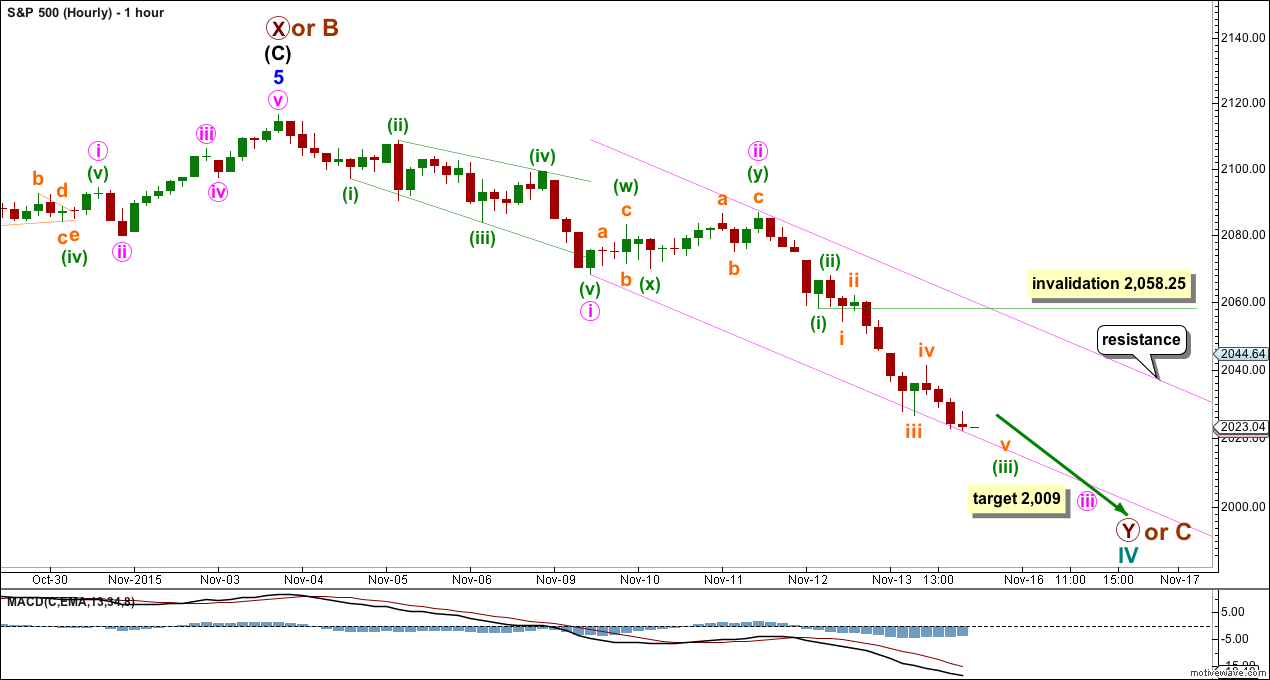
This first hourly chart and the one presented below for the bear wave count both work in the same way for both wave counts. Downwards movement may have begun with a leading expanding diagonal for a first wave, followed by a shallow double zigzag for a second wave. A third wave down may be underway and would reach 1.618 the length of minute wave i at 2,009.
Minute wave iii is showing an expected increase in downwards momentum.
The channel is redrawn today. This is an acceleration channel about minute waves i and ii. Draw the first trend line from the end of minute wave i to the last low, then place a parallel copy on the high of minute wave ii. Keep redrawing the channel as price moves lower. When minute wave iii is complete this channel would be drawn using Elliott’s first technique. It may then serve to show where minute wave iv may find resistance.
Minute wave iv may show up on the daily chart when minute wave iii is complete. It may last a Fibonacci two or three days.
Within minuette wave (iii), subminuette wave iii is just 0.52 short of 2.618 the length of subminuette wave i.
Minuette wave (iii) may be very close to completion. At 2,021 it would reach 1.618 the length of minuette wave (iv). I do not think this is a significant target though; minuette wave (iv) should only last a very few hours.
ALTERNATE BULL ELLIOTT WAVE COUNT
DAILY CHART
Click chart to enlarge.
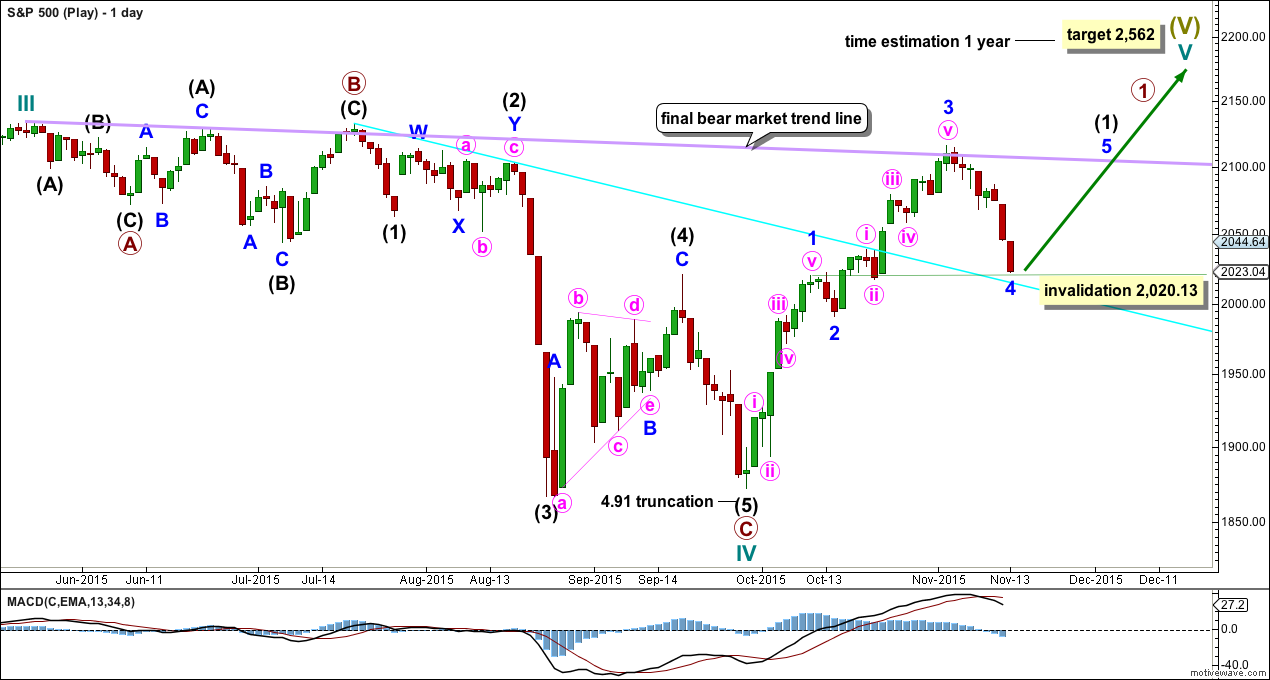
It is possible to see cycle wave IV a completed flat correction. This would provide some structural alternation with the zigzag of cycle wave II.
This is a regular flat but does not have a normal regular flat look. Primary wave C is too long in relation to primary wave A. Primary wave C would be 3.84 short of 4.236 the length of primary wave A. While it is possible to also see cycle wave IV as a complete zigzag (the subdivisions for that idea would be labelled the same as the bear wave count below, daily chart) that would not provide structural alternation with the zigzag of cycle wave II, and so I am not considering it.
This idea requires not only a new high but that the new high must come with a clear five upwards, not a three.
At 2,562 cycle wave V would reach equality in length with cycle wave I. Cycle wave I was just over one year in duration so cycle wave V should be expected to also reach equality in duration. Cycle degree waves should be expected to last about one to several years, so this expectation is reasonable. It would be extremely unlikely for this idea that cycle wave V was close to completion, because it has not lasted nearly long enough for a cycle degree wave.
I added a bear market trend line drawn using the approach outlined by Magee in “Technical Analysis of Stock Trends”. When this lilac line is clearly breached by upwards movement that shall confirm a trend change from bear to bull. The breach must be by a close of 3% or more of market value. If it comes with a clear five up, then this wave count would be further confirmed.
While price remains below the bear market trend line, we should assume the trend remains the same: downwards.
Minor wave 3 should be complete. Minor wave 4 may not move into minor wave 1 price territory below 2,020.13.
This wave count does not have support from regular technical analysis and it has a big problem of structure for Elliott wave analysis. I do not have confidence in this wave count. It is presented as a “what if?” to consider all possibilities.
BEAR ELLIOTT WAVE COUNT
DAILY CHART
Click chart to enlarge.
This bear wave count has a better fit at Grand Super Cycle degree and is better supported by regular technical analysis at the monthly chart level. But it is a huge call to make, so I present it second, after a more bullish wave count, and until all other options have been eliminated.
There are two ideas presented in this chart: a huge flat correction or a double flat / double combination. The huge flat is more likely. They more commonly have deep B waves than combinations have deep X waves (in my experience).
A huge flat correction would be labelled super cycle (a)-(b)-(c). It now expects a huge super cycle wave (c) to move substantially below the end of (a) at 666.79. C waves can behave like third waves. This idea expects a devastating bear market, and a huge crash to be much bigger than the last two bear markets on the monthly bear chart.
The second idea is a combination which would be labelled super cycle (w)-(x)-(y). The second structure for super cycle wave (y) would be a huge sideways repeat of super cycle wave (a) for a double flat, or a quicker zigzag for a double combination. It is also possible (least likely) that price could drift sideways in big movements for over 10 years for a huge triangle for super cycle wave (y).
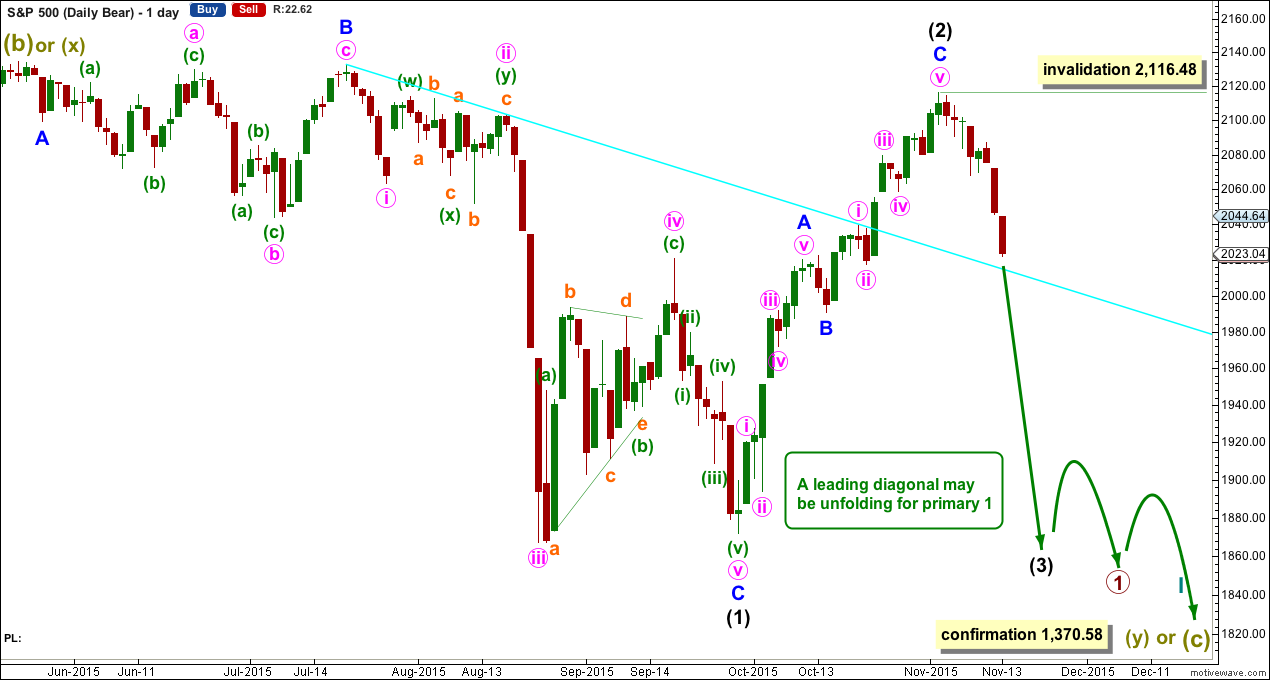
The bear wave count sees a leading diagonal for a primary degree first wave unfolding. Within leading diagonals, the first, third and fifth waves are most commonly zigzags but sometimes may appear to be impulses. Here intermediate wave (1) is seen as a complete zigzag.
No second wave correction nor minor wave B may move beyond the start above 2,116.48 within intermediate wave (2).
Intermediate wave (3) must move beyond the end of intermediate wave (1) and it would most likely be a zigzag.
HOURLY CHART
Click chart to enlarge.
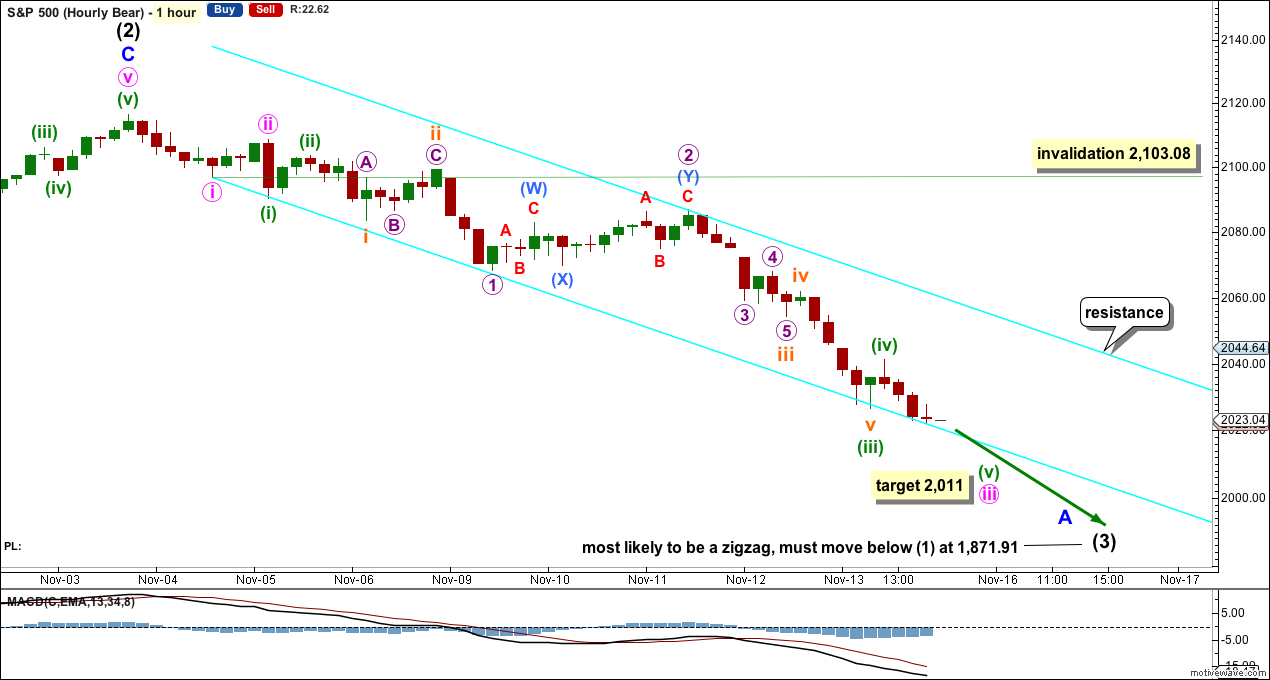
Because I have two hourly charts which both expect a five down to be unfolding at the hourly chart level I am using them to illustrate two ideas. Both hourly charts work in the same way for both daily bull and daily bear wave counts.
Because leading expanding diagonals are not very common, and because they are normally followed by deep second waves when they do occur, the first idea presented for the bull wave count has problems.
An impulse is a more common structure for a first (or A) wave. If an impulse is unfolding downwards, then the middle may have recently passed and a series of fourth wave corrections may be underway.
There is no Fibonacci ratio between subminuette waves i and iii. Subminuette wave v is 3.15 points short of 1.618 the length of subminuette wave i.
Minuette wave (iii) is now complete and just 0.77 points short of 4.236 the length of minuette wave (i).
At 2,011 minuette wave (v) would reach 1.618 the length of minuette wave (i). When minuette wave (v) completes an impulse down for minute wave iii, then the following correction for minute wave iv may show up on the daily chart lasting two or three days. It may not move into minute wave i price territory above 2,103.08.
The channel here is a best fit, and is almost the same as the acceleration channel on the first hourly chart. Also, for this channel, the upper edge may show where larger corrections may find resistance.
TECHNICAL ANALYSIS
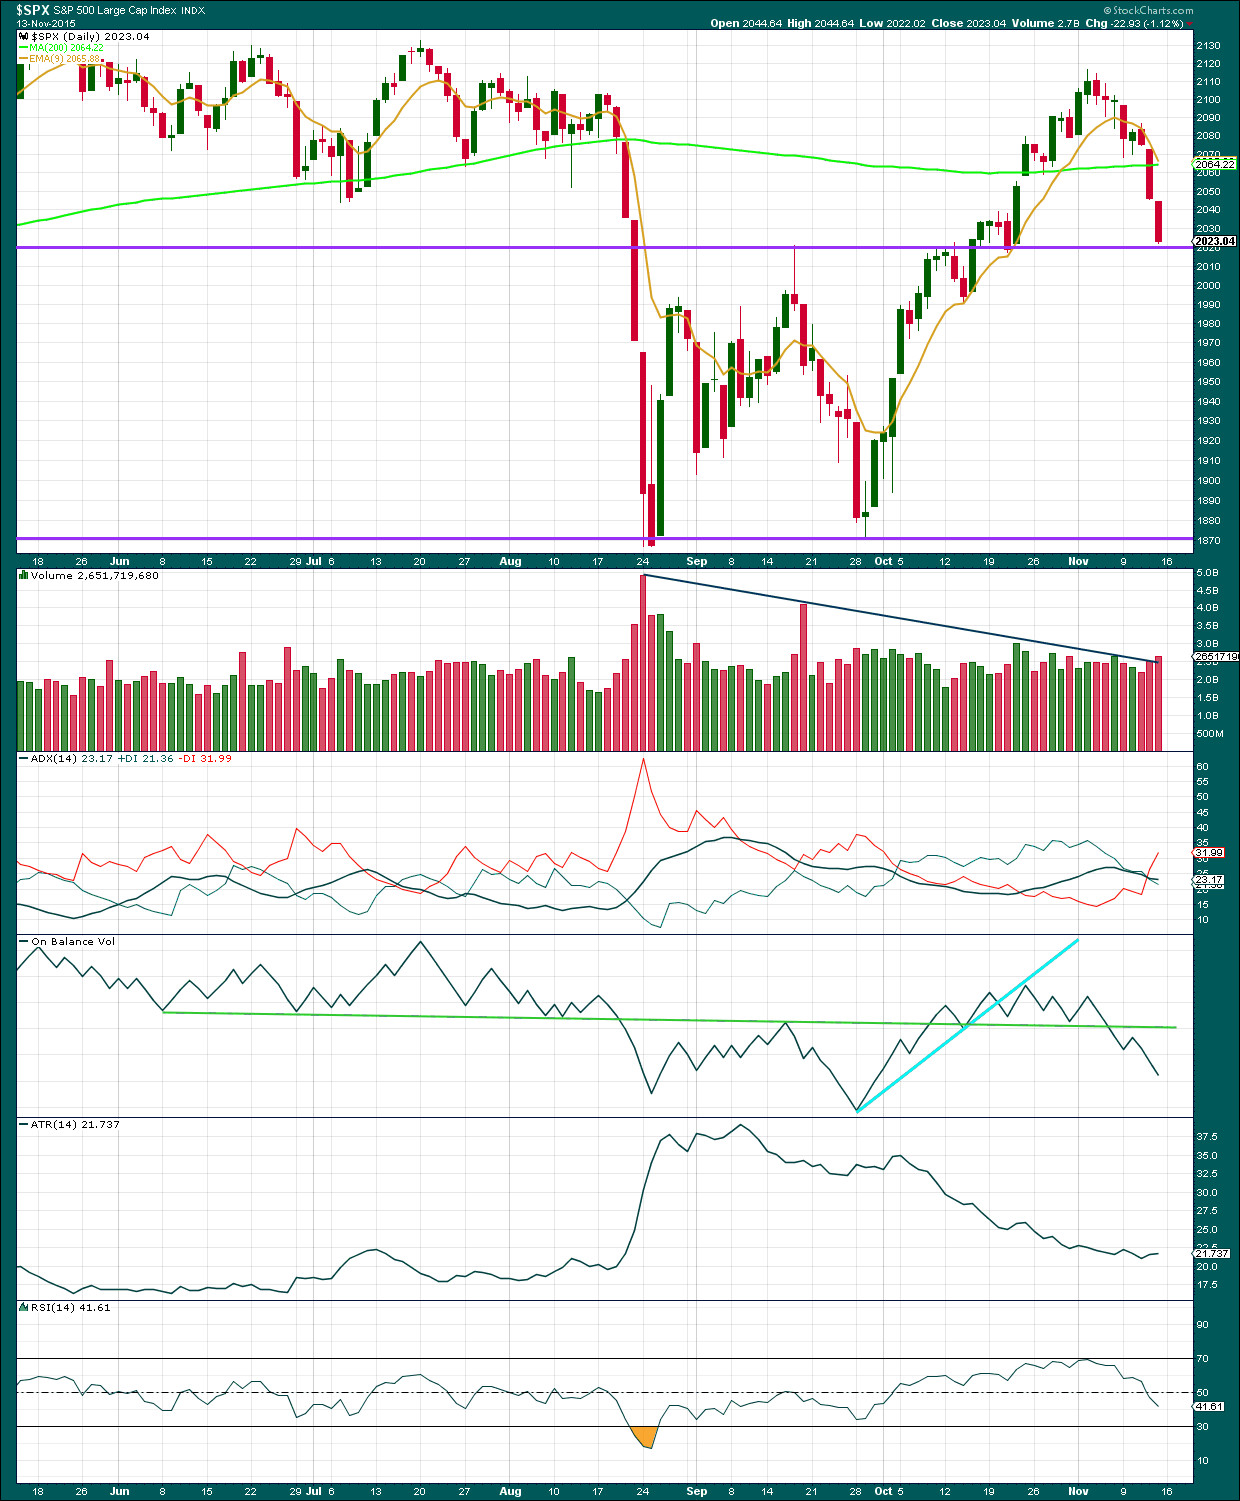
Click chart to enlarge. Chart courtesy of StockCharts.com.
Daily: For three days in a row price has fallen on an increase in volume. The fall in price is supported by volume again.
The +DX and -DX lines have crossed today indicating a trend change. ADX does tend to be a lagging indicator (it is based on moving averages which necessarily are lagging). If the black ADX line turns upwards in the next few days, then a downwards trend would be indicated. For now the ADX line is flat not yet quite indicating a trend.
ATR still agrees with ADX (ATR is also based upon an average, so also necessarily is a lagging indicator). If ATR turns up, then it would be expected that the market is again trending. After a period of declining range it would be expected that ATR would turn up. A trend does look like it may be in the early stages.
Price has moved strongly below the 200 day moving average and closed below it. As expected, price is finding support at the horizontal trend line about 2,020. A small bounce upwards may unfold from here early next week, if this line offers strong support still. If price does not find support here, then that would be a strong bearish indicator.
On Balance Volume is a leading indicator and usually works well with trend lines. At this stage, OBV remains below the green trend line. This line is very shallow, repeatedly tested, reasonably long held, and highly technically significant. The breach of OBV below that line is a reasonably strong bearish signal and supports all wave counts with the exception of the very bullish “alternate bull Elliott wave count” which has no technical support at all.
A note on Dow Theory: for the bear wave count I would wait for Dow Theory to confirm a huge market crash. So far the industrials and the transportation indices have made new major swing lows, but the S&P500 and Nasdaq have not.
S&P500: 1,820.66
Nasdaq: 4,116.60
DJT: 7,700.49 – this price point was breached.
DJIA: 15,855.12 – this price point was breached.
To the upside, for Dow Theory, I am watching each index carefully. If any make new all time highs, that will be noted. If they all make new all time highs, then a continuation of a bull market would be confirmed. So far none have made new all time highs.
This analysis is published about 08:52 p.m. EST.
For the hourly chart presented first (bull) minuette (iv) is underway. But it’s showing up on the daily chart now as a green candlestick. Overall that looks somewhat okay.
For the hourly chart presented second (bear) minute iv is underway and with that showing up on the daily chart this wave count now (at least for how I’m seeing the subdivisions on the hourly chart) has the best look.
The trend remains down for both wave counts. The invalidation points remain the same.
I hope this chart loads!
This is a 12 MA on a monthly charts of the % of stocks above their 50 & 200 DMA’s.
They are heading down
OK, here is the linkable version : Add ‘HTTP’
//stockcharts.com/h-sc/ui?s=%24SPXA50R&p=M&yr=15&mn=6&dy=0&id=p75796287715&a=409511543
ES Daily breaks heavy black S/R line from July
SPX Cash closed just on top of the heavy black S/R line from July VXX broke upward through resistance