
The target for upwards movement was 2,065 or 2,080.
Price moved higher as expected for Friday to reach 2,079.74.
Summary: A little more upwards movement to 2,082 would complete the structure. A fourth wave correction may unfold sideways first, and so the target may be met in about four more sessions.
To see how each of the bull and bear wave counts fit within a larger time frame see the Grand Supercycle Analysis.
To see last analysis of weekly and monthly charts go here.
If I was asked to pick a winner (which I am reluctant to do) I would say the bear wave count has a higher probability. It is better supported by regular technical analysis at the monthly chart level, it fits the Grand Supercycle analysis better, and it has overall the “right look”.
New updates to this analysis are in bold.
BULL ELLIOTT WAVE COUNT
DAILY CHART – COMBINATION
Click chart to enlarge.
Cycle wave IV should exhibit alternation to cycle wave II.
Cycle wave II was a shallow 0.41 zigzag lasting three months. Cycle wave IV should exhibit alternation in structure and maybe also alternation in depth. Cycle wave IV may end when price comes to touch the lower edge of the teal channel which is drawn about super cycle wave V using Elliott’s technique (see this channel on weekly and monthly charts).
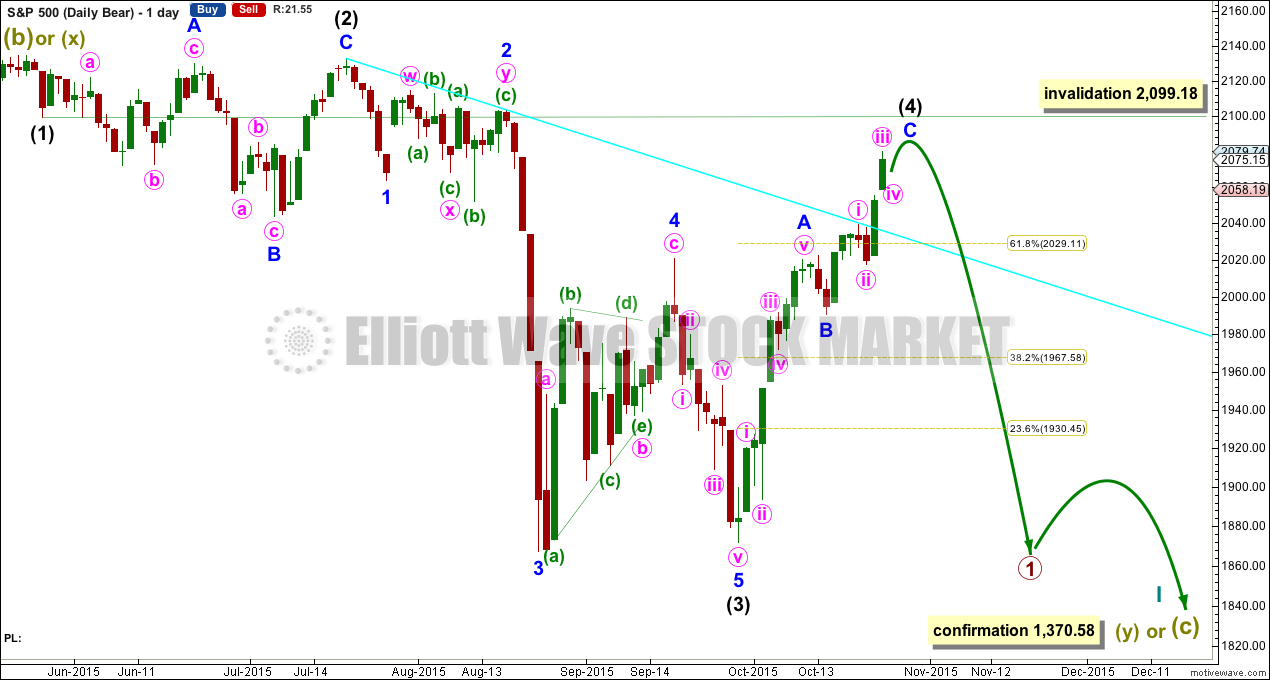
Cycle wave IV is likely to end within the price range of the fourth wave of one lesser degree. Because of the good Fibonacci ratio for primary wave 3 and the perfect subdivisions within it, I am confident that primary wave 4 has its range from 1,730 to 1,647.
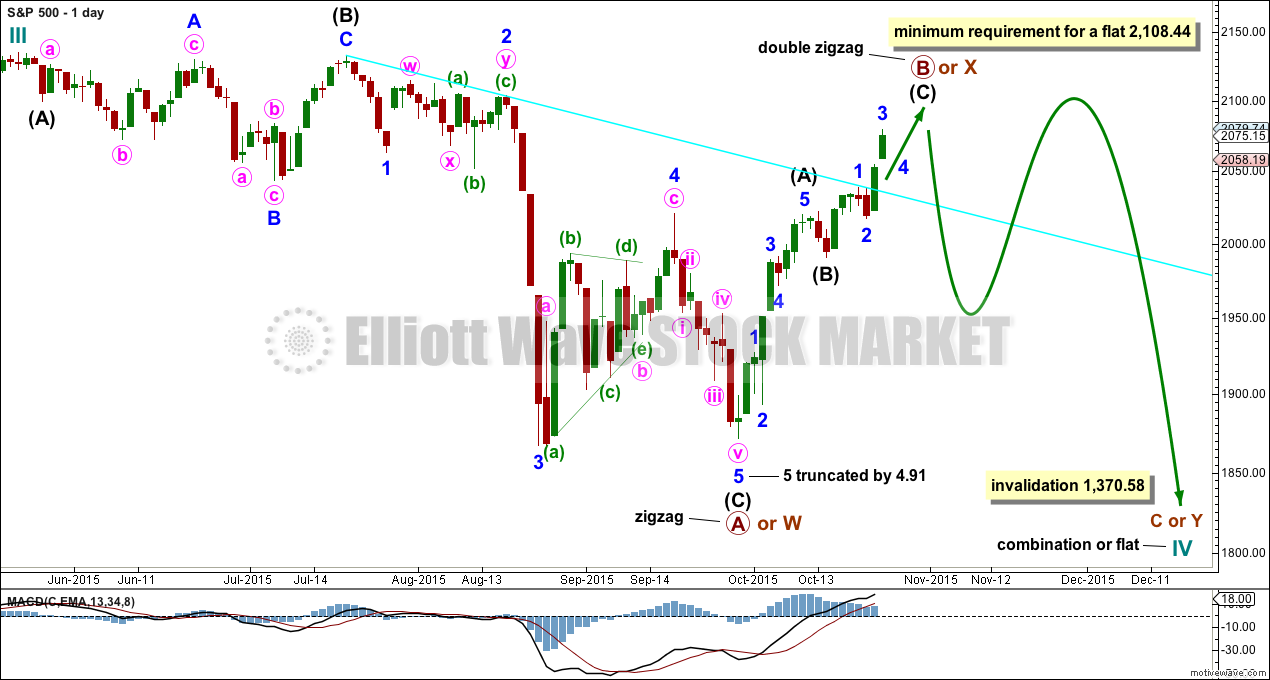
If a zigzag is complete at the last major low as labelled, then cycle wave IV may be unfolding as a flat, combination or triangle.
Primary wave B or X upwards is continuing, most likely as a single zigzag. If upwards movement reaches to 2,108.44 or above, then cycle wave IV may be unfolding as a flat correction. At that point, primary wave B would meet the minimum length of 90% the length of primary wave A. If upwards movement does not meet the minimum requirement for a flat correction, then cycle wave IV may be a combination or triangle.
Primary wave B within a flat correction may make a new high above the start of primary wave A at 2,134.72 as in an expanded flat. There is no upper invalidation point for this wave count for that reason. Likewise, X waves within combinations may also move beyond the start of the first structure labelled primary wave W. There is no minimum or maximum length for an X wave within a combination.
DAILY CHART – TRIANGLE
Click chart to enlarge.
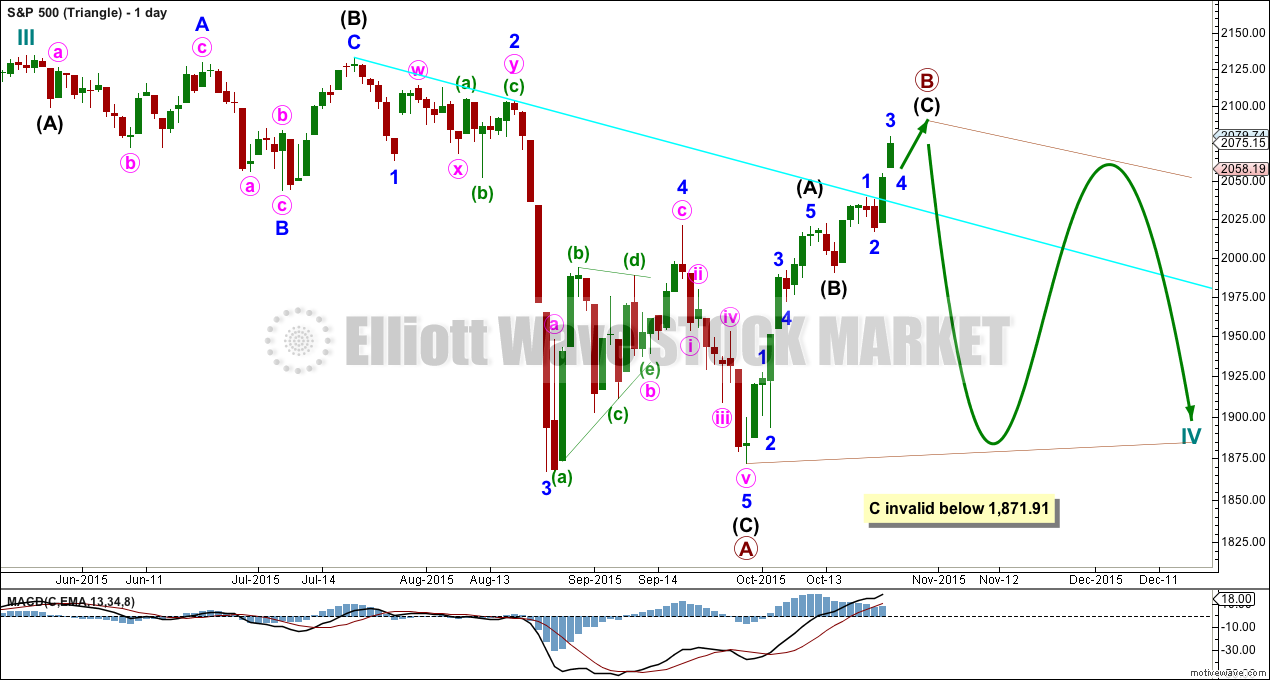
Cycle wave IV may unfold as a shallow triangle. This would provide alternation with the 0.41 zigzag of cycle wave II.
Primary wave B may be unfolding as a zigzag.
Primary wave B may move beyond the start of primary wave A at 2,134.72 as in a running triangle. There is no upper invalidation point for this wave count for that reason.
Primary wave C of a barrier or contracting triangle may not move beyond the end of primary wave A at 1,871.91.
The whole structure moves sideways in an ever decreasing range. The purpose of triangles is to take up time and move price sideways.
The hourly chart below works in exactly the same way for both of these daily charts, and so only one hourly chart for these two ideas will be presented today.
HOURLY CHART
Click chart to enlarge.
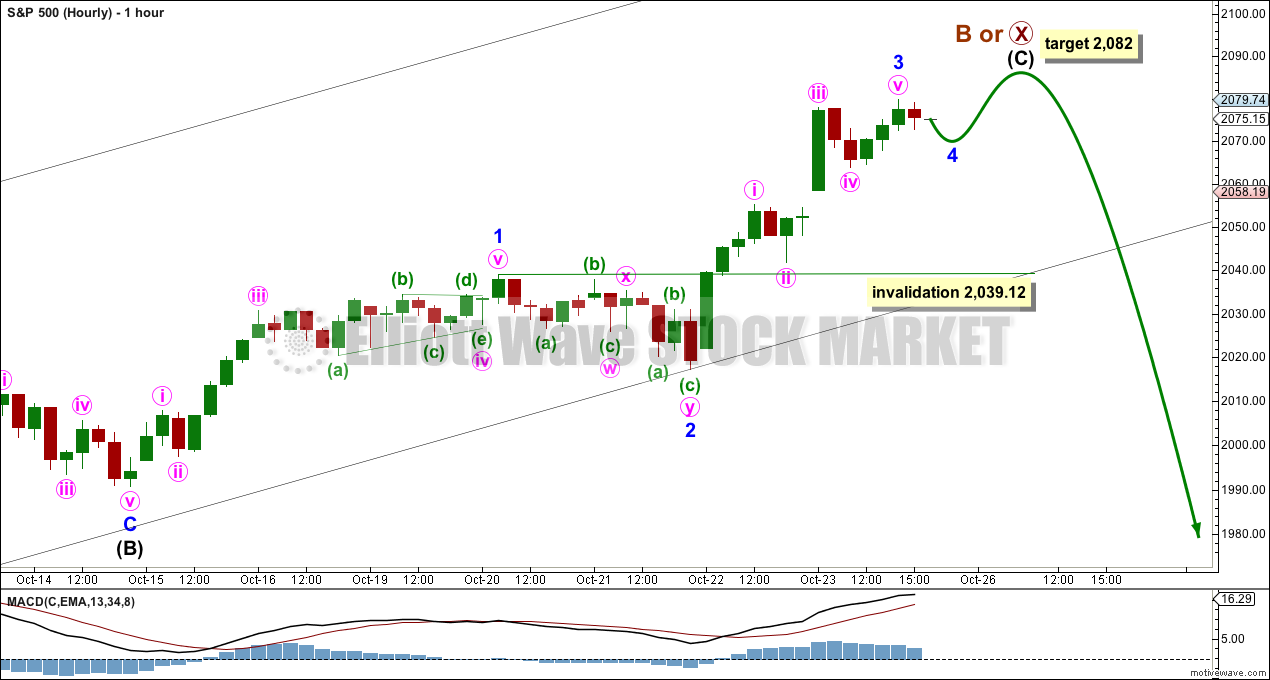
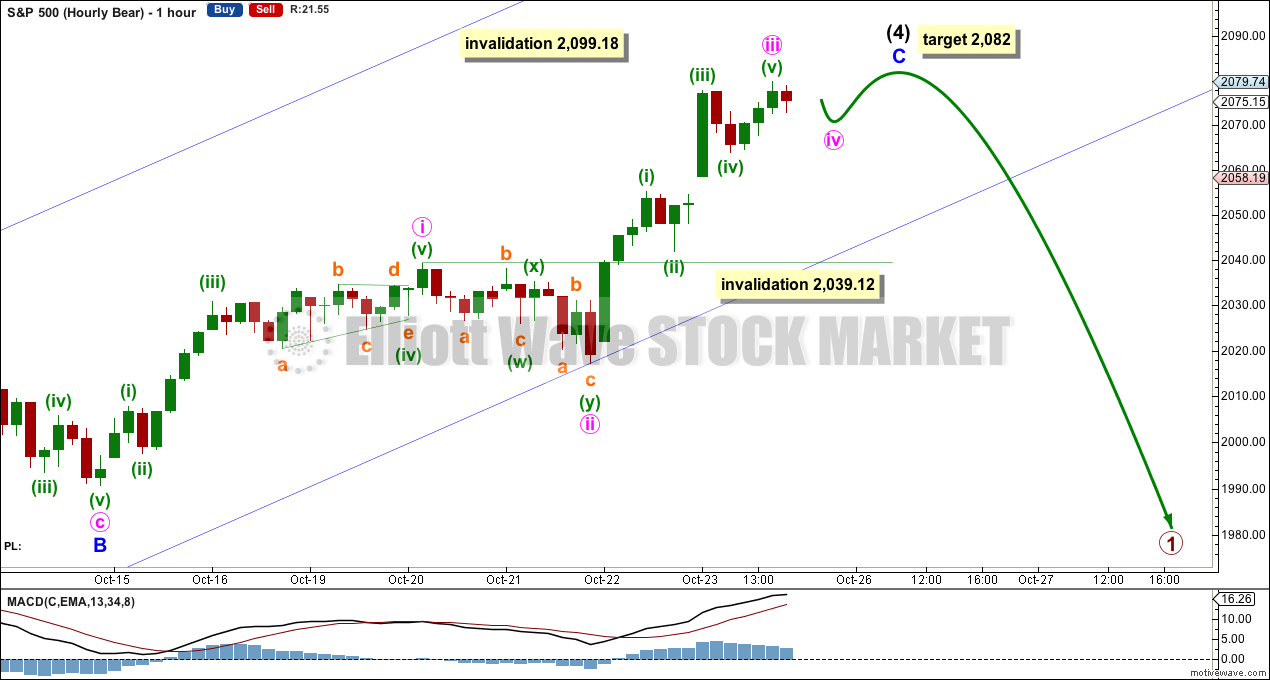
The structure of upwards movement no longer looks like a double zigzag. It fits better as a single zigzag.
Minor wave 3 is now a complete five wave impulse. It is longer in length than minor wave 1. There is no Fibonacci ratio between the two.
Minor wave 4 should unfold as a shallow sideways correction: a flat, combination or triangle. It may not move into minor wave 1 price territory below 2,039.12.
The black channel drawn here is a best fit. Along the way up, downwards corrections may find support at the lower edge.
At 2,082 intermediate wave (C) would reach 0.618 the length of intermediate wave (A).
If primary wave B or X continues for four more sessions, then it may end in a total Fibonacci 21 sessions (give or take one either side of this number would still give it an acceptable Fibonacci duration).
ALTERNATE BULL ELLIOTT WAVE COUNT
DAILY CHART
Click chart to enlarge.
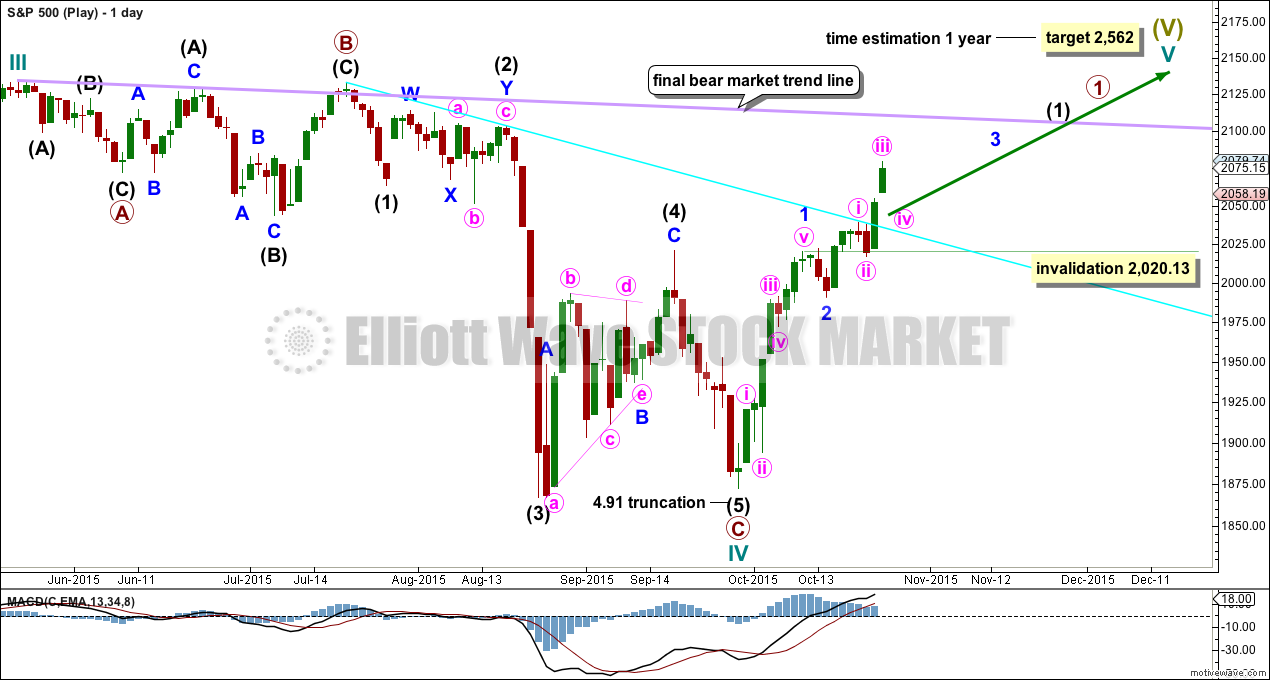
It is possible to see cycle wave IV a completed flat correction. This would provide some structural alternation with the zigzag of cycle wave II.
This is a regular flat but does not have a normal regular flat look. Primary wave C is too long in relation to primary wave A. Primary wave C would be 3.84 short of 4.236 the length of primary wave A. While it is possible to also see cycle wave IV as a complete zigzag (the subdivisions for that idea would be labelled the same as the bear wave count below, daily chart) that would not provide structural alternation with the zigzag of cycle wave II, and so I am not considering it.
This idea requires not only a new high but that the new high must come with a clear five upwards, not a three.
At 2,562 cycle wave V would reach equality in length with cycle wave I. Cycle wave I was just over one year in duration so cycle wave V should be expected to also reach equality in duration.
I added a bear market trend line drawn using the approach outlined by Magee in “Technical Analysis of Stock Trends”. When this lilac line is clearly breached by upwards movement that shall confirm a trend change from bear to bull. If it comes with a clear five up, then this wave count would be further confirmed.
While price remains below the bear market trend line, we should assume the trend remains the same: downwards.
The invalidation point for this idea is moved again. Minor wave 3 should be complete soon. When it is done minor wave 4 may not move into minor wave 1 price territory below 2,020.13.
BEAR ELLIOTT WAVE COUNT
DAILY CHART
Click chart to enlarge.
This bear wave count has a better fit at Grand Super Cycle degree and is better supported by regular technical analysis at the monthly chart level. But it is a huge call to make, so I present it second, after a more bullish wave count, and until all other options have been eliminated.
There are two ideas presented in this chart: a huge flat correction or a double flat / double combination. The huge flat is more likely. They more commonly have deep B waves than combinations have deep X waves (in my experience).
A huge flat correction would be labelled super cycle (a)-(b)-(c). It now expects a huge super cycle wave (c) to move substantially below the end of (a) at 666.79. C waves can behave like third waves. This idea expects a devastating bear market, and a huge crash to be much bigger than the last two bear markets on the monthly bear chart.
The second idea is a combination which would be labelled super cycle (w)-(x)-(y). The second structure for super cycle wave (y) would be a huge sideways repeat of super cycle wave (a) for a double flat, or a quicker zigzag for a double combination. It is also possible (least likely) that price could drift sideways in big movements for over 10 years for a huge triangle for super cycle wave (y).
I am now seeing a third wave complete at the last major low for intermediate wave (3). Intermediate wave (3) is 17.31 longer than 6.854 the length of intermediate wave (1).
Minor wave 5 is seen as complete and slightly truncated.
A channel drawn using Elliott’s technique no longer works. Sometimes fourth waves aren’t contained within such a channel, which is why Elliott developed a second technique to use when they breach the channel.
Intermediate wave (2) was a very deep 0.95 expanded flat lasting 38 sessions. Intermediate wave (4) should exhibit alternation, is most likely to be more shallow, and be a quicker zigzag or zigzag multiple.
Intermediate wave (4) is continuing higher as a single zigzag. It may not move into intermediate wave (1) price territory above 2,099.18. If this price point is breached, then this bear wave count would revert to considering a leading diagonal unfolding for a primary degree first wave.
HOURLY CHART
Click chart to enlarge.
The zigzag upwards for intermediate wave (4) is seen in exactly the same way as the zigzag upwards for primary wave B or X for the first two wave counts. The degree of labelling for this idea is one degree lower.
TECHNICAL ANALYSIS
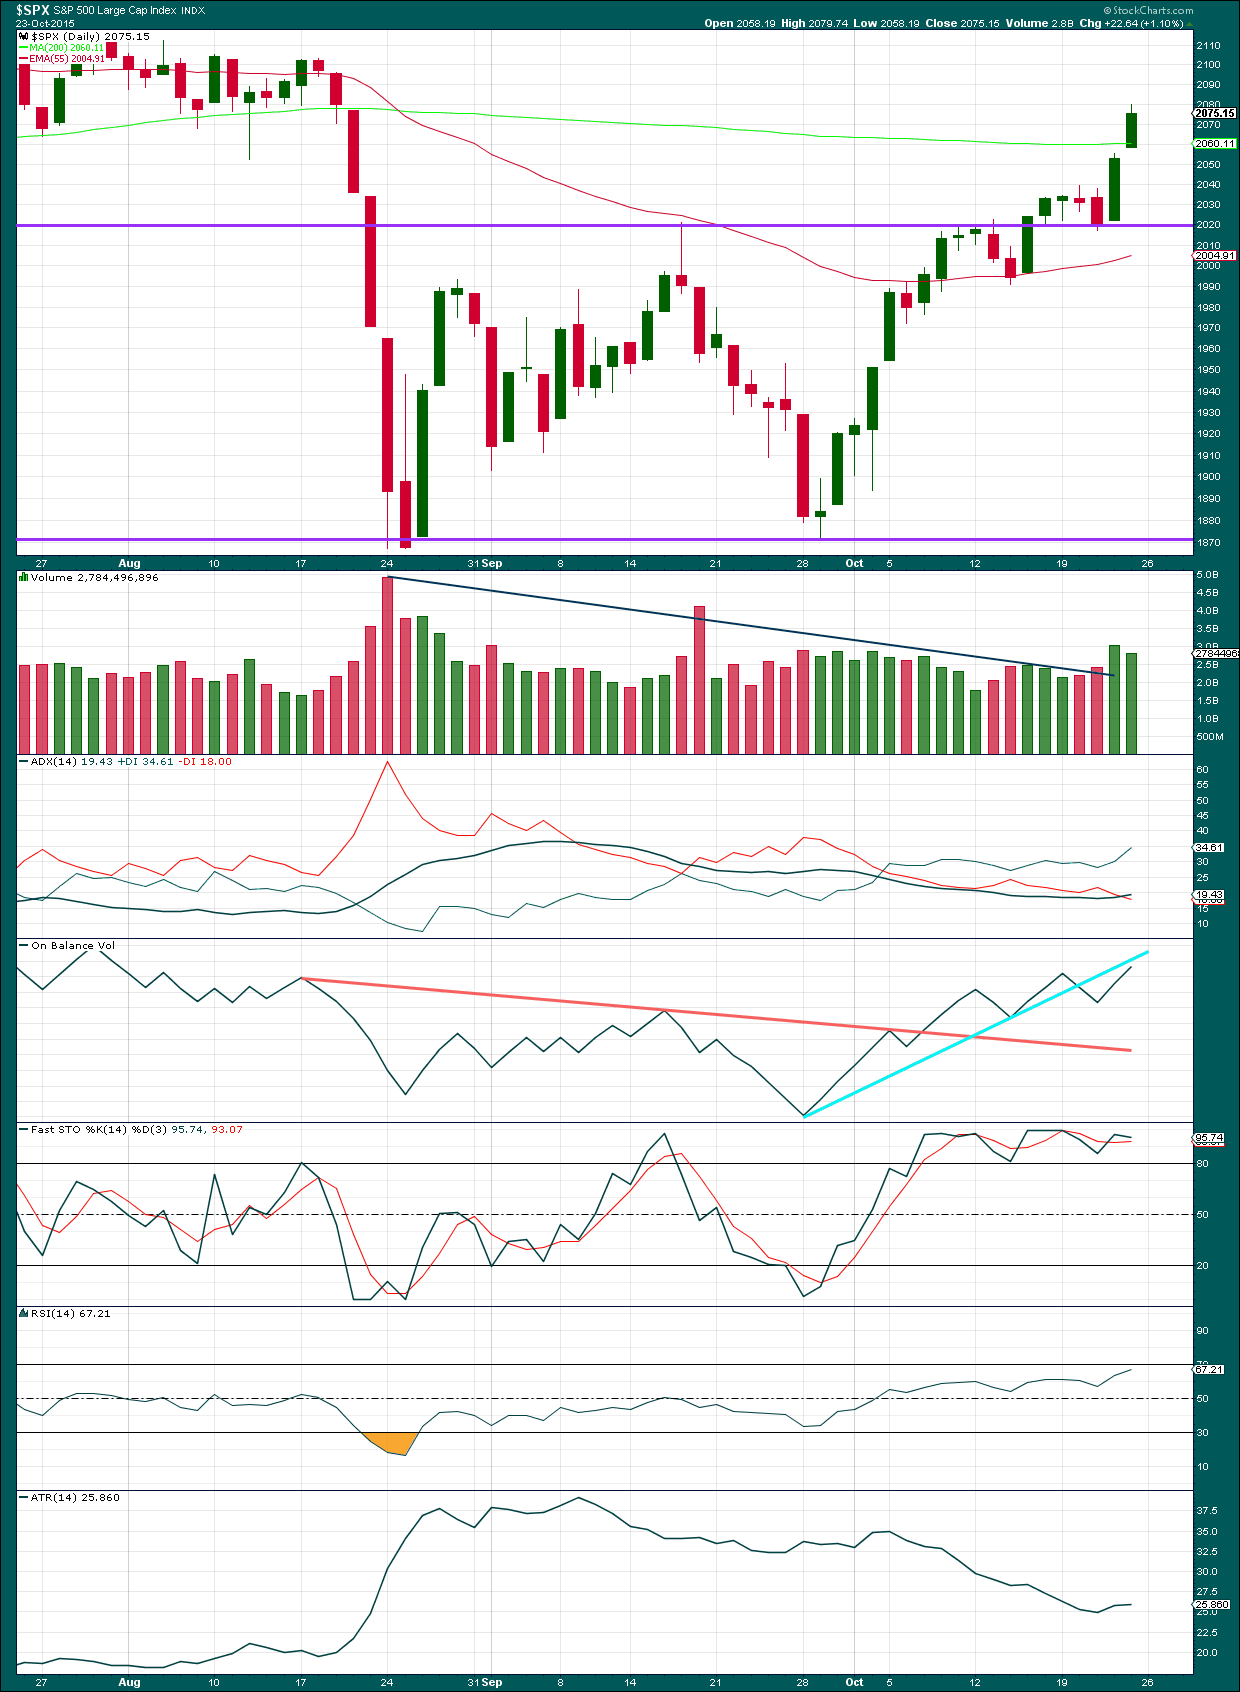
Click chart to enlarge. Chart courtesy of StockCharts.com.
Daily: Friday’s session comes on a decline in volume. However, the strong volume for Thursday’s strong upwards day still overall makes this upwards movement look more bullish than corrective. It still looks like price has broken out of the prior consolidation zone upwards. The 200 day SMA has not offered any resistance and price closed above it.
This is the most bullish picture from the S&P 500 for months. It gives some concern to the bear wave count, but it is not enough to fully support the very bullish alternate wave count. The picture at the monthly chart level remains very bearish. We have not had technical confirmation of an end to the bear market yet.
The black ADX line is slightly rising and above 15 indicating the market may be in the early stages of a new trend. The trend would be upwards. However, this is a weak signal while ADX is below 20.
A range bound system should be used while price remains range bound. The idea outlined here is simple, and simple is usually best. When Stochastics reaches overbought and price reaches resistance expect the end of the upwards swing and a downwards swing to begin. Expect the downwards swing to continue until Stochastics reaches oversold and price reaches support. The problem with this approach (and the reason why trading a range bound market is inherently very risky) is neither Stochastics nor support / resistance lines will show exactly where and when price will turn as they are only general guides. Stochastics can remain extreme for a few days and price can overshoot support / resistance before turning back. Trading a range bound market must be done only with careful money management. Alternatively, step aside and wait for a clear trend to emerge before reentering this market.
On Balance Volume may find some resistance at the short bright blue trend line. However, this trend line is too steep, has been tested only twice, and does not offer a very strong technical indicator.
Average True Range (ATR) today is beginning to turn upwards. However, ATR should be used as a longer term indicator, so a small daily swing upwards does not indicate a new trend. The longer term picture for ATR is still flat to pointing lower since about 9th September indicating the market has most likely been consolidating and not trending during this time.
A note on Dow Theory: for the bear wave count I would wait for Dow Theory to confirm a huge market crash. So far the industrials and the transportation indices have made new major swing lows, but the S&P500 and Nasdaq have not.
S&P500: 1,820.66
Nasdaq: 4,116.60
DJT: 7,700.49 – this price point was breached.
DJIA: 15,855.12 – this price point was breached.
This analysis is published about 01:44 a.m. EST.
I have a hard time getting my head around EW subdivisions, and that’s why I am here.
But from what I have read about the psychological & emotional profiles of waves, this FEELS like a B wave: Everyone gets fooled:Everyone is starting to think the correction is over and a new bull is unfolding…..then C hits. Perhaps we get a new high with the B as the weekly MACD rises,but , looking at the monthly MACD a 5w starting here , to me, looks unlikely.
While nothing in technical analysis is certain, I think John is right. Market internal deterioration has been occurring for many months now and the RSI swing failure was a huge red flag. Too many folk got too short too quickly and the market does what it always does – fool the crowd. Sentiment is now swiftly changing and many are convinced the bull is back, forgetting that the kind of massive rallies we have been seeing of late are generally typical of bear markets. While new highs are possible, I suspect this market is going to get very unpleasant sooner rather than later…
Agree with you guys. I think Nasdaq is likely to make ATH. May be spx. Doubt Dow and rut
These deep corrections are nerve wracking. They’re supposed to be.
And they always convince us the bull is back… right before the bear takes off.
There is great alternation between (4) and (2) in terms of structure, but not so much in depth. And that’s only a slight problem. Alternation is a guideline not a rule and the S&P just doesn’t always exhibit perfect alternation.
You’re right, it looks very B wave like.
And the larger monthly picture, the rise in price from March 2009 looks B wave like on the monthly chart. Declining volume, weakening RSI, failure swing….
I’ll take a look at breadth indicators too actually for a longer time frame, monthly. If that looks weak as well then it would reinforce the B wave idea for that long rise.
Some Breadth indicators: My favorite, T2108 looks close to it’s top range before a decline
Thank you for posting your charts John! A really good look at market breadth you have provided for us.
Breadth looks pretty weak. The Absolute Breadth index is clearly declining. And the New High / New Low ratio has had three lower highs in a row…
This advance in the index is being pushed up with light volume and only a relatively small number of equities. That’s not looking good for the bulls. It’s weak.
Current position of indicators Stochastic, MACD & RSI 5 min, 15 min, 1HR , daily , weekly monthly . Bare bones , no annotation.
The daily MACD did not complete it’s upward correction befor the weekly MACD started it’s turn up.
BUT
Since 2000 the MACD has not changed direction once it has started a downward turn