
Upwards movement was unexpected and invalidated the wave count at the hourly chart level.
Summary: The structure upwards is either an incomplete double or single zigzag. The target for it to end is 2,065 or 2,080.
To see how each of the bull and bear wave counts fit within a larger time frame see the Grand Supercycle Analysis.
To see last analysis of weekly and monthly charts go here.
If I was asked to pick a winner (which I am reluctant to do) I would say the bear wave count has a higher probability. It is better supported by regular technical analysis at the monthly chart level, it fits the Grand Supercycle analysis better, and it has overall the “right look”.
New updates to this analysis are in bold.
BULL ELLIOTT WAVE COUNT
DAILY CHART – COMBINATION
Click chart to enlarge.
Cycle wave IV should exhibit alternation to cycle wave II.
Cycle wave II was a shallow 0.41 zigzag lasting three months. Cycle wave IV should exhibit alternation in structure and maybe also alternation in depth. Cycle wave IV may end when price comes to touch the lower edge of the teal channel which is drawn about super cycle wave V using Elliott’s technique (see this channel on weekly and monthly charts).
Cycle wave IV is likely to end within the price range of the fourth wave of one lesser degree. Because of the good Fibonacci ratio for primary wave 3 and the perfect subdivisions within it, I am confident that primary wave 4 has its range from 1,730 to 1,647.
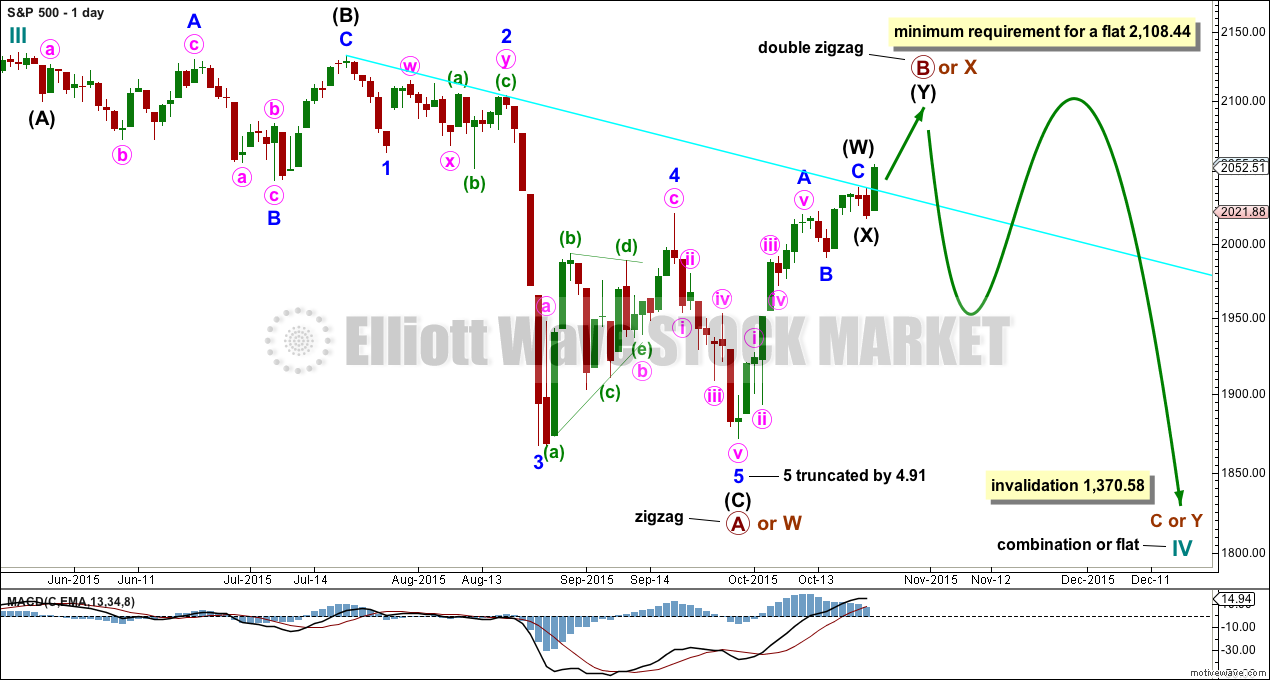
If a zigzag is complete at the last major low as labelled, then cycle wave IV may be unfolding as a flat, combination or triangle.
Primary wave B or X upwards is continuing, most likely as a double zigzag. If upwards movement reaches to 2,108.44 or above, then cycle wave IV may be unfolding as a flat correction. At that point, primary wave B would meet the minimum length of 90% the length of primary wave A. If upwards movement does not meet the minimum requirement for a flat correction, then cycle wave IV may be a combination or triangle.
Primary wave B within a flat correction may make a new high above the start of primary wave A at 2,134.72 as in an expanded flat. There is no upper invalidation point for this wave count for that reason. Likewise, X waves within combinations may also move beyond the start of the first structure labelled primary wave W. There is no minimum or maximum length for an X wave within a combination.
DAILY CHART – TRIANGLE
Click chart to enlarge.
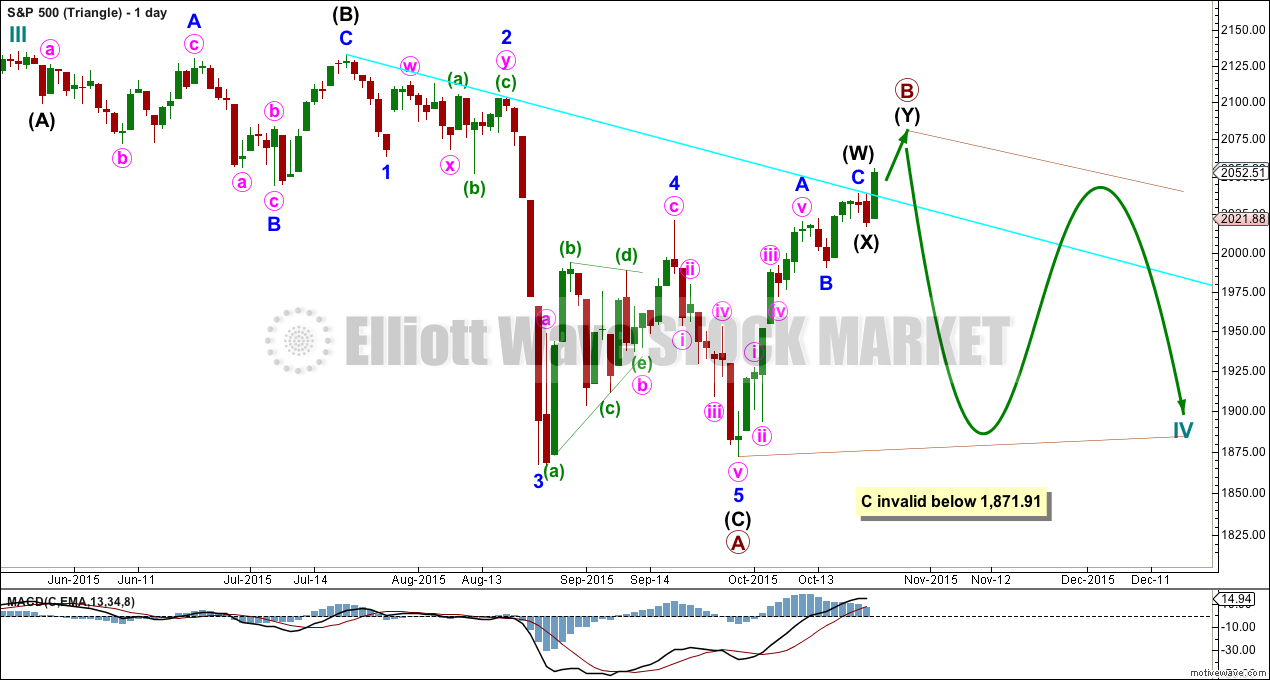
Cycle wave IV may unfold as a shallow triangle. This would provide alternation with the 0.41 zigzag of cycle wave II.
One of the five sub waves of a triangle should be a more complicated double, usually a double zigzag. Primary wave B may be unfolding as a double zigzag.
Primary wave B may move beyond the start of primary wave A at 2,134.72 as in a running triangle. There is no upper invalidation point for this wave count for that reason.
Primary wave C of a barrier or contracting triangle may not move beyond the end of primary wave A at 1,871.91.
The whole structure moves sideways in an ever decreasing range. The purpose of triangles is to take up time and move price sideways.
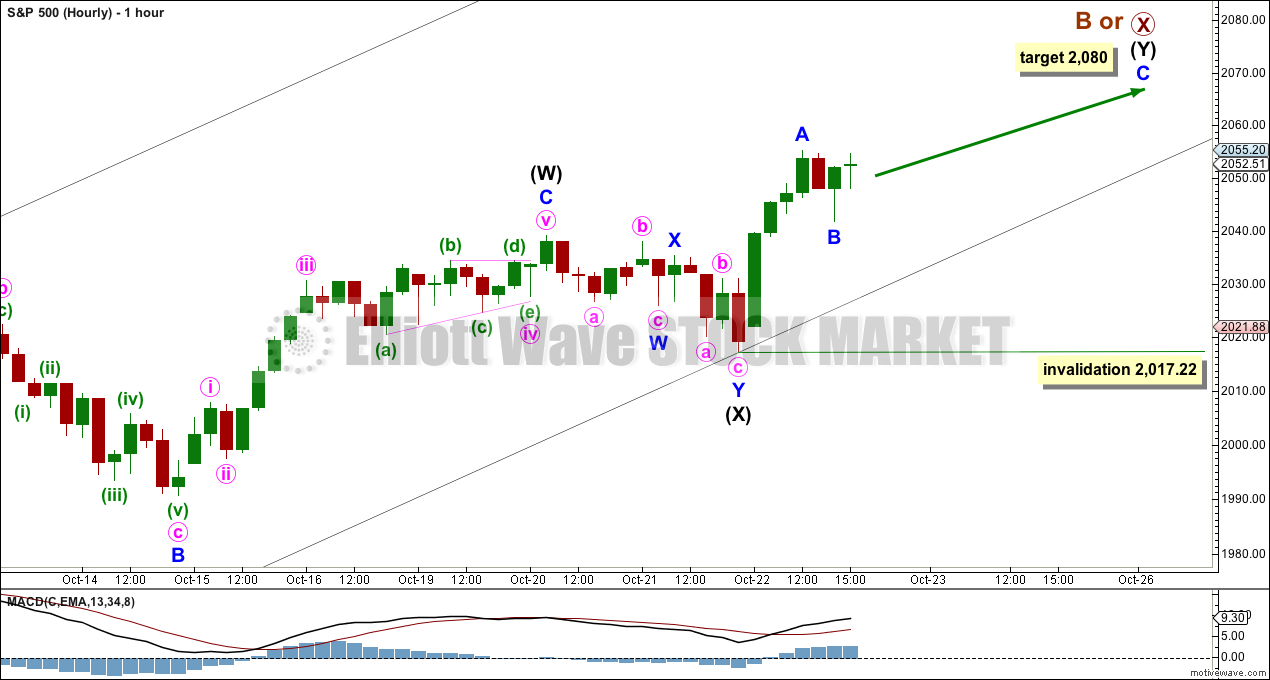
The hourly chart below works in exactly the same way for both of these daily charts, and so only one hourly chart for these two ideas will be presented today.
HOURLY CHART
Click chart to enlarge.
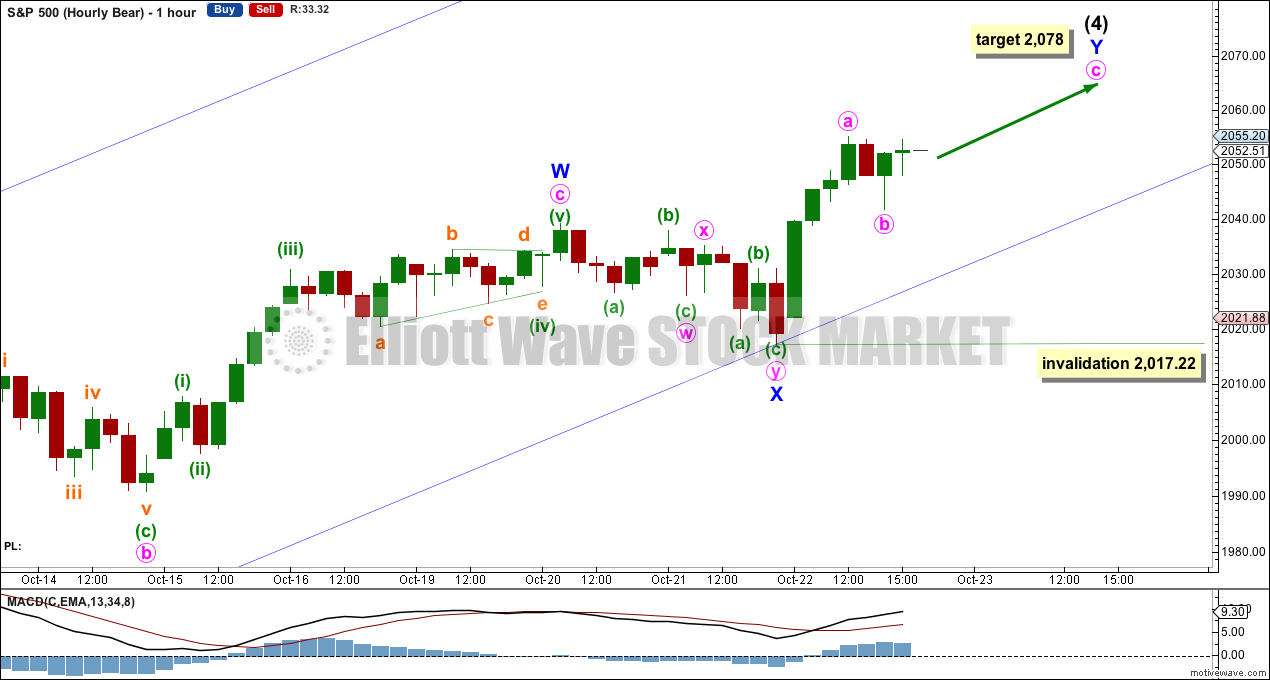
At 2,080 minor wave C would reach equality in length with minor wave A.
Minor wave C may end in another one or two sessions.
Within the second zigzag of intermediate wave (Y), minor wave B, if it continues further, may not move beyond the start of minor wave A below 2,017.22.
ALTERNATE BULL ELLIOTT WAVE COUNT
DAILY CHART
Click chart to enlarge.
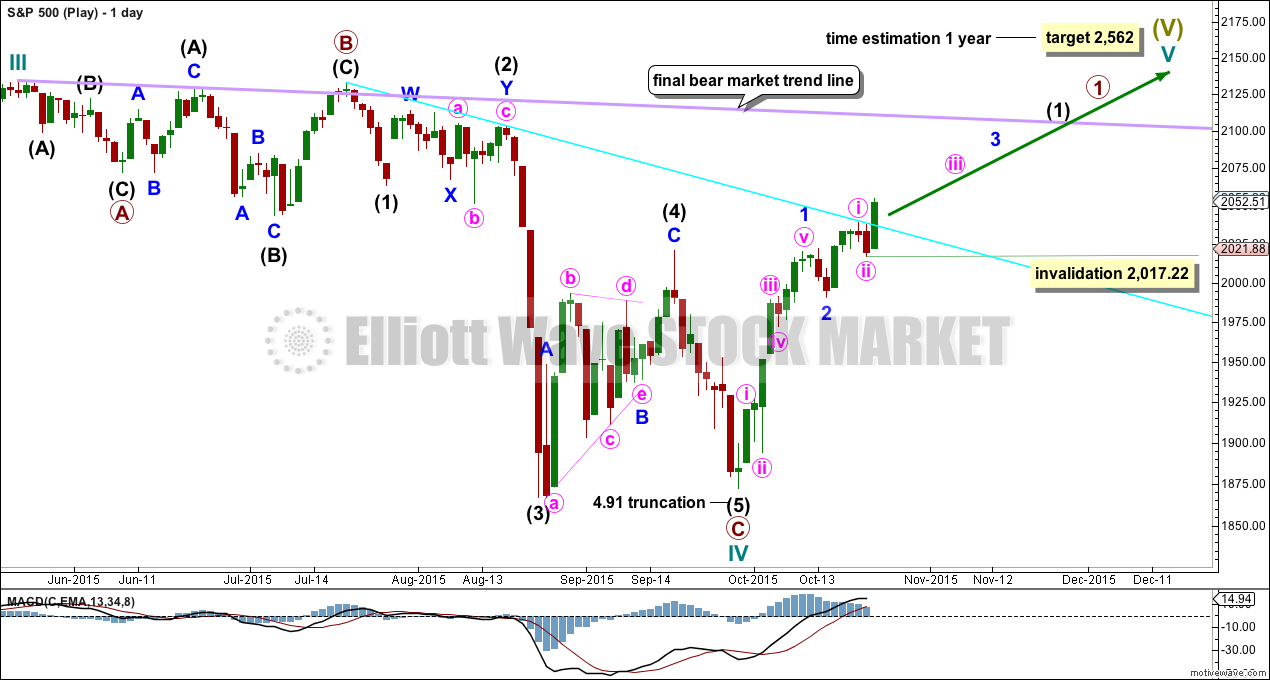
It is possible to see cycle wave IV a completed flat correction. This would provide some structural alternation with the zigzag of cycle wave II.
This is a regular flat but does not have a normal regular flat look. Primary wave C is too long in relation to primary wave A. Primary wave C would be 3.84 short of 4.236 the length of primary wave A. While it is possible to also see cycle wave IV as a complete zigzag (the subdivisions for that idea would be labelled the same as the bear wave count below, daily chart) that would not provide structural alternation with the zigzag of cycle wave II, and so I am not considering it.
This idea requires not only a new high but that the new high must come with a clear five upwards, not a three.
At 2,562 cycle wave V would reach equality in length with cycle wave I. Cycle wave I was just over one year in duration so cycle wave V should be expected to also reach equality in duration.
I added a bear market trend line drawn using the approach outlined by Magee in “Technical Analysis of Stock Trends”. When this lilac line is clearly breached by upwards movement that shall confirm a trend change from bear to bull. If it comes with a clear five up, then this wave count would be further confirmed.
While price remains below the bear market trend line, we should assume the trend remains the same: downwards.
The invalidation point for this idea can be moved up again. Within minute wave iii, no second wave correction may move beyond its start below 2,107.22.
BEAR ELLIOTT WAVE COUNT
DAILY CHART
Click chart to enlarge.
This bear wave count has a better fit at Grand Super Cycle degree and is better supported by regular technical analysis at the monthly chart level. But it is a huge call to make, so I present it second, after a more bullish wave count, and until all other options have been eliminated.
There are two ideas presented in this chart: a huge flat correction or a double flat / double combination. The huge flat is more likely. They more commonly have deep B waves than combinations have deep X waves (in my experience).
A huge flat correction would be labelled super cycle (a)-(b)-(c). It now expects a huge super cycle wave (c) to move substantially below the end of (a) at 666.79. C waves can behave like third waves. This idea expects a devastating bear market, and a huge crash to be much bigger than the last two bear markets on the monthly bear chart.
The second idea is a combination which would be labelled super cycle (w)-(x)-(y). The second structure for super cycle wave (y) would be a huge sideways repeat of super cycle wave (a) for a double flat, or a quicker zigzag for a double combination. It is also possible (least likely) that price could drift sideways in big movements for over 10 years for a huge triangle for super cycle wave (y).
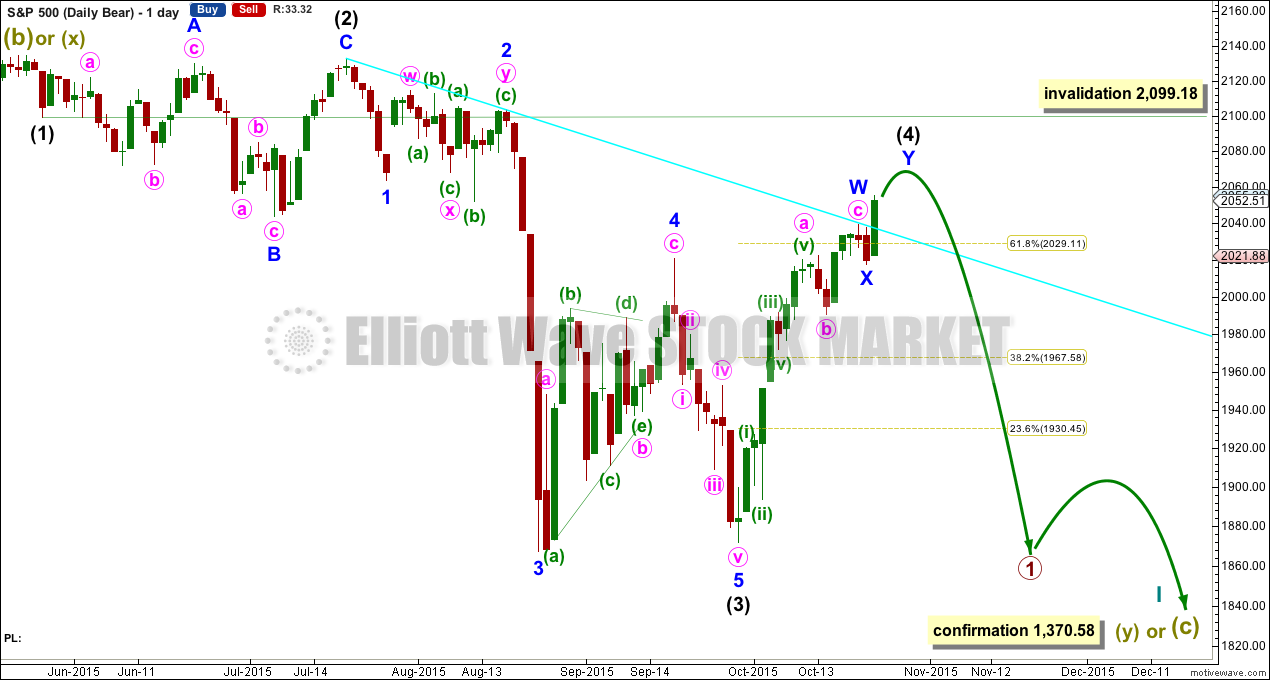
I am now seeing a third wave complete at the last major low for intermediate wave (3). Intermediate wave (3) is 17.31 longer than 6.854 the length of intermediate wave (1).
Minor wave 5 is seen as complete and slightly truncated.
A channel drawn using Elliott’s technique no longer works. Sometimes fourth waves aren’t contained within such a channel, which is why Elliott developed a second technique to use when they breach the channel.
Intermediate wave (2) was a very deep 0.95 expanded flat lasting 38 sessions. Intermediate wave (4) should exhibit alternation, is most likely to be more shallow, and be a quicker zigzag or zigzag multiple.
Intermediate wave (4) is continuing higher as a double or single zigzag. It may not move into intermediate wave (1) price territory above 2,099.18.
HOURLY CHART
Click chart to enlarge.
This first hourly chart looks at intermediate wave (4) as a double zigzag. The subdivisions are the same as the first hourly wave count above. The target and invalidation points are also the same. It requires minute wave c upwards to complete the structure.
HOURLY ALTERNATE CHART
Click chart to enlarge.
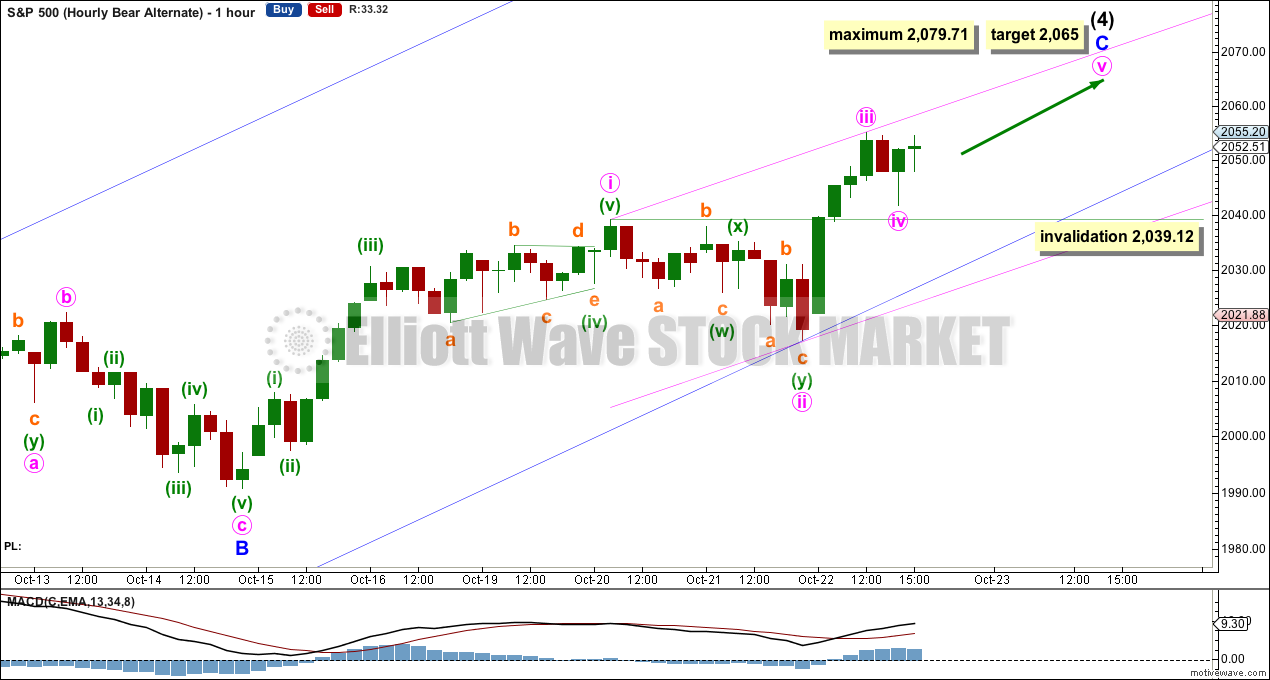
Alternatively, intermediate wave (4) may be an incomplete single zigzag.
This idea has a lower probability because minute wave ii would have breached a channel drawn about the zigzag one degree higher. However, the subdivisions will all fit. They are the same as the first hourly chart.
Minute wave iii is shorter than minute wave i. This limits minute wave v to no longer than equality with minute wave iii at 2,079.71.
At 2,065 minute wave v would reach 0.618 the length of minute wave iii.
Minute wave iv may not move into minute wave i price territory below 2,039.12.
TECHNICAL ANALYSIS
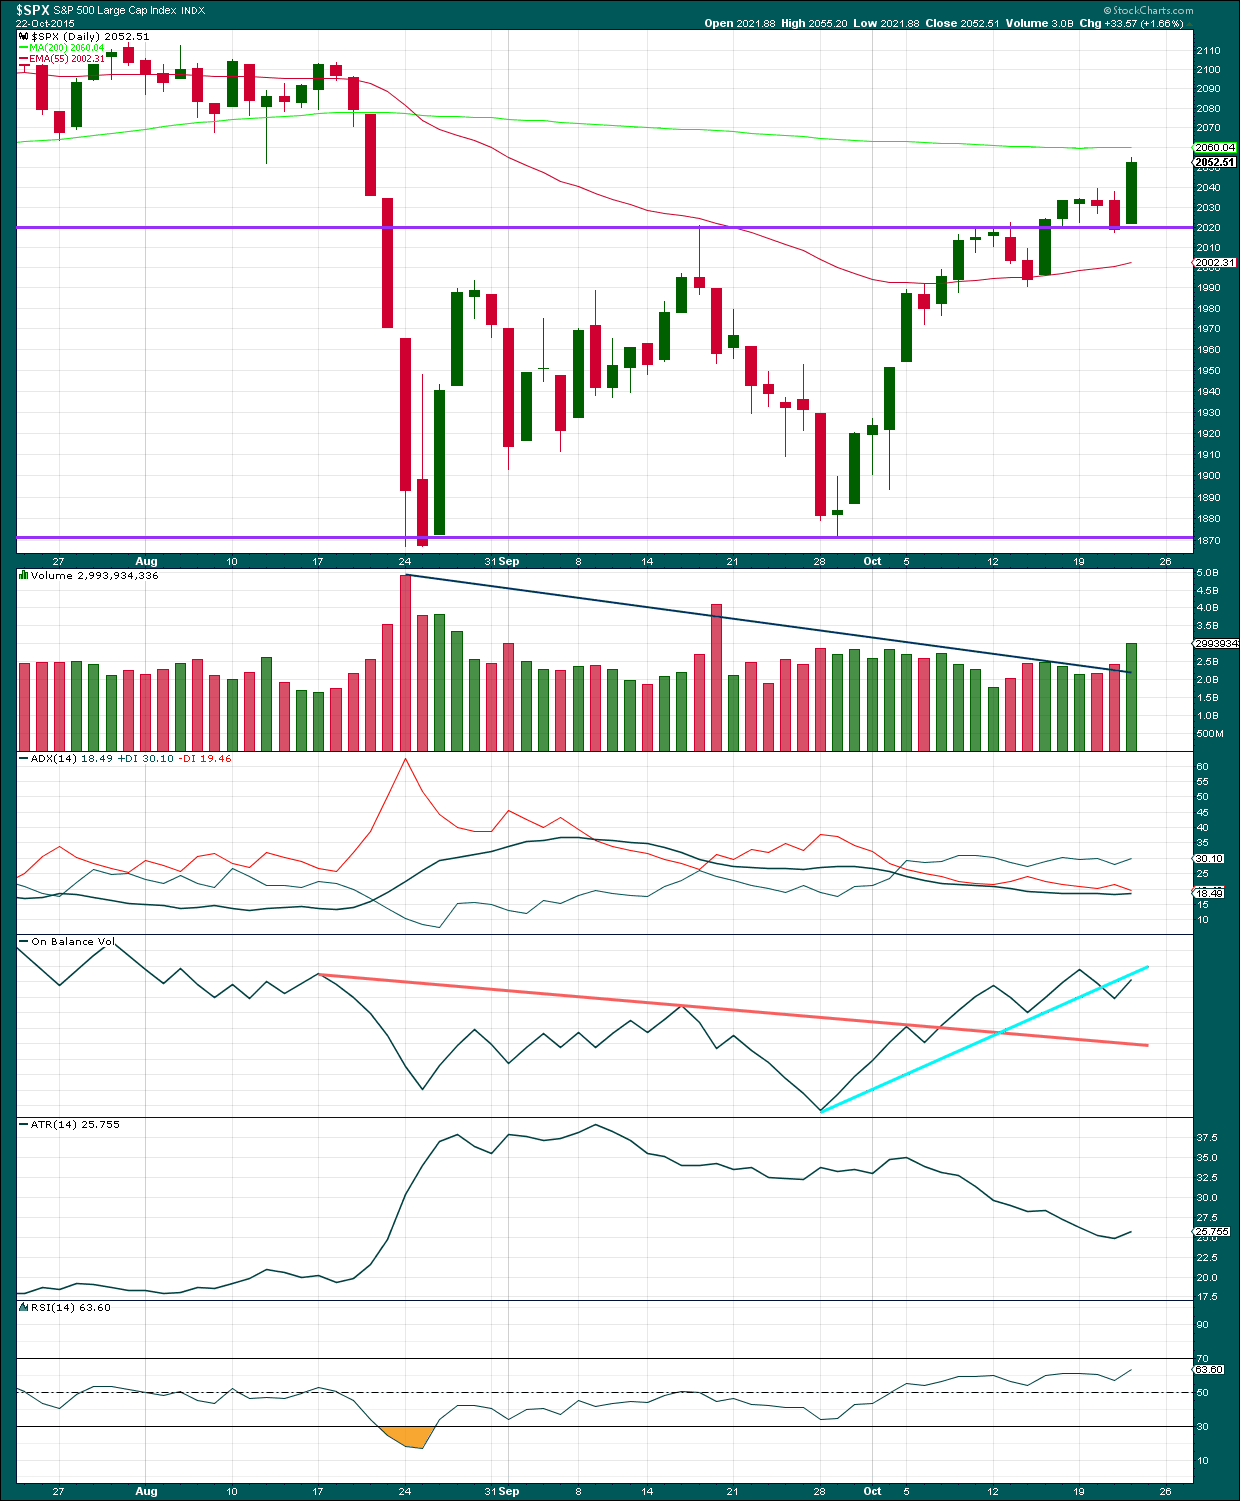
Click chart to enlarge. Chart courtesy of StockCharts.com.
Daily: Price has found strong support at the horizontal trend line, and Thursday’s strong upwards movement comes on a day with a good increase in volume. This is the most bullish indication from the S&P 500 for some time. It is not nearly enough to prefer the alternate bull Elliott wave count which sees a new bull market in the earliest stages, but it does place a little doubt over the more bearish wave counts today.
Today’s strong upwards movement on an increase in volume does look like an upwards breakout. Price is now close to the 200 day Simple Moving Average which may offer resistance.
The black ADX line is still mostly flat and below 20 indicating the market is not trending.
A range bound system should be used while price remains range bound. The idea outlined here is simple, and simple is usually best. When Stochastics reaches overbought and price reaches resistance expect the end of the upwards swing and a downwards swing to begin. Expect the downwards swing to continue until Stochastics reaches oversold and price reaches support. The problem with this approach (and the reason why trading a range bound market is inherently very risky) is neither Stochastics nor support / resistance lines will show exactly where and when price will turn as they are only general guides. Stochastics can remain extreme for a few days and price can overshoot support / resistance before turning back. Trading a range bound market must be done only with careful money management. Alternatively, step aside and wait for a clear trend to emerge before reentering this market.
On Balance Volume may find some resistance at the short bright blue trend line. However, this trend line is too steep, has been tested only twice, and does not offer a very strong technical indicator.
Average True Range (ATR) today is beginning to turn upwards. However, ATR should be used as a longer term indicator, so a small daily swing upwards does not indicate a new trend. The longer term picture for ATR is still flat to pointing lower since about 9th September indicating the market has most likely been consolidating and not trending during this time.
A note on Dow Theory: for the bear wave count I would wait for Dow Theory to confirm a huge market crash. So far the industrials and the transportation indices have made new major swing lows, but the S&P500 and Nasdaq have not.
S&P500: 1,820.66
Nasdaq: 4,116.60
DJT: 7,700.49 – this price point was breached.
DJIA: 15,855.12 – this price point was breached.
This analysis is published about 10:01 p.m. EST.
Hello Lara,
What do you think about this count on weekly chart. This move up as mentioned by other members too has technicals and emotions of second wave and todays gap up may be exhaustion gap.
I’m not an EW guru but do enjoy the challenges it presents. I believe that the wave IV has ended and this is the first impulse wave higher that should take the DJIA up close to 20,000 in the next year. I do follow cycles and it looks like the 76 month cycle bottomed in August. I’ve read some say there is a decent cycle due next April – June but I would be surprised if took the DJIA back below the August low.
If SPX and DJI both overtake their 200 day MA next week one would have to give serious consideration to wave four’s having concluded in August. The internal breadth of both indices is awful with just a few stocks holding up the indices and most components trading well below their 200 day MA, so unless the central banks pump in untold billions (and the scary thing is who is to say the won’t?) the rally faces substantial technical and fundamental headwinds. It is one of those situations that really make you wonder about the influence of central banks on the ultimate form elliott waves take. Afterall, it is the wave principle of human behaviour…
JB I would be interested in any information you could share on cycles. Educative sites too. TIA
John, I don’t have any websites I use; mainly I come up with them on my own or read about them in a newsletter. I had been expecting a 7 year low in the Sept./Oct period this year but after further research was able to modify that cycle to an average of about 76 months. I can provide you with the previous lows if interested. As for next year, Robert Prechter is showing a 34 year cycle due mid year and Sid Norris is showing a 4.5 year low in March/April. The problem I have with the 34 year is it only has 2 previous revolutions which may be too small for a reliable cycle. The other cycle I follow is the 20 year which is due again in 2022.
I know it does not fit the wave count but unless we are already in a new bull market, this rally really has the feel of a second wave. Against all technical and fundamental odds ( weak market breadth and earnings) futures again pointing higher. Hard to determine if we are seeing a buying climax fueled by central bank rhetoric and buying, or if a march towards new highs underway. Probably smart to hold both bullish and bearish credit spreads, or stand aside until picture clearer…personally I think longs are being set up for a blood-bath…
QE 4 on the way………..
I too believe this is second wave. 2 or B Up. Some of the elliot wave guys become skeptical of a wave being 4th wave if it retraces more than 38.2 %. I think we had a very quick 4th wave during August decline. Since then we had A, B complete and I think C may be complete now.
S&P Daily R1 on the HR chart is just at the dashed R/S line on thid daily chart.
Wondering if the VIX fills its gap. There was talk , a few days ago, about the very excessive small traders short positions….The past two days should have wiped out a lot of that.
No question that all the usual stops of short positions have been run the past few days or will be today. At the close of today’s trading, there will be very few shorts in the market I wager and I will be an exception. Loading up on puts three months out at the close…I am not drinking the kool-aid.
12:40 pm in France ES at a fib line
WOW just a moment or two after I posted the ES jumped 15 points……. The fib line did not hold
Lets see if this line holds holds …..