
Downwards movement was expected.
Summary: Both wave counts now expect downwards movement to continue for at least a few days. The target for the bear wave count is 1,778. The bull wave count may see a zigzag down for a C wave of a triangle which must end above 1,871.91, or a three wave structure down for an A wave of a flat correction.
To see how each of the bull and bear wave counts fit within a larger time frame see the Grand Supercycle Analysis.
To see last analysis of weekly and monthly charts go here.
If I was asked to pick a winner (which I am reluctant to do) I would say the bear wave count has a higher probability. It is better supported by regular technical analysis at the monthly chart level, it fits the Grand Supercycle analysis better, and it has overall the “right look”.
New updates to this analysis are in bold.
BULL ELLIOTT WAVE COUNT
DAILY CHART – COMBINATION
Click chart to enlarge.
Cycle wave IV should exhibit alternation to cycle wave II.
Cycle wave II was a shallow 0.41 zigzag lasting three months. Cycle wave IV should exhibit alternation in structure and maybe also alternation in depth. Cycle wave IV may end when price comes to touch the lower edge of the teal channel which is drawn about super cycle wave V using Elliott’s technique (see this channel on weekly and monthly charts).
Cycle wave IV is likely to end within the price range of the fourth wave of one lesser degree. Because of the good Fibonacci ratio for primary wave 3 and the perfect subdivisions within it, I am confident that primary wave 4 has its range from 1,730 to 1,647.
If a zigzag is complete at the last major low as labelled, then cycle wave IV may be unfolding as a flat, combination or triangle.
The possibile structures for cycle wave IV may now be narrowed down to either a combination or a triangle. A flat may at this stage be ruled out because the B wave did not reach 90% of the A wave. I will separate the two ideas out into two daily charts.
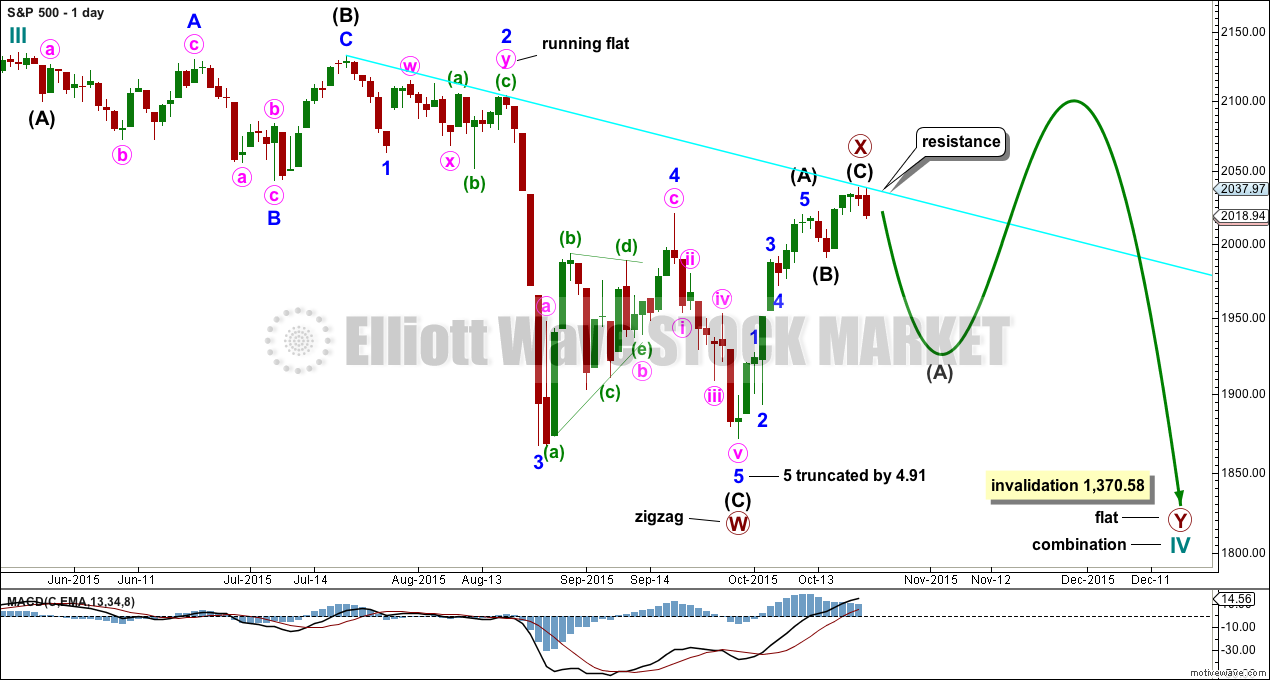
This first chart looks at a possible combination. The first structure in the double combination is a zigzag labelled primary wave W. The double is now joined by a complete three in the opposite direction, a zigzag labelled primary wave X. The second structure must be a flat correction.
Note: If the second structure were to be a triangle, then the whole of cycle wave IV would fit as a triangle. This possibility is looked at in the second daily chart. If the second structure were to be a zigzag, then that would make cycle wave IV a double zigzag which is different from a double combination, and would show inadequate alternation with the single zigzag of cycle wave II. For these reasons this first chart looks only at a possible flat correction for primary wave Y.
If cycle wave IV is a double combination, then the first structure in the double was a zigzag labelled primary wave W. The double is joined by a now complete three in the opposite direction, a zigzag labelled primary wave X. The second structure in the double for primary wave Y is expected to unfold as a flat correction. Flats subdivide 3-3-5. Intermediate wave (A) should subdivide as a three, most likely a zigzag, but it may also itself be a flat correction. At the hourly chart level, intermediate wave (A) needs to begin with a clear five down for a move at primary degree.
DAILY CHART – TRIANGLE
Click chart to enlarge.
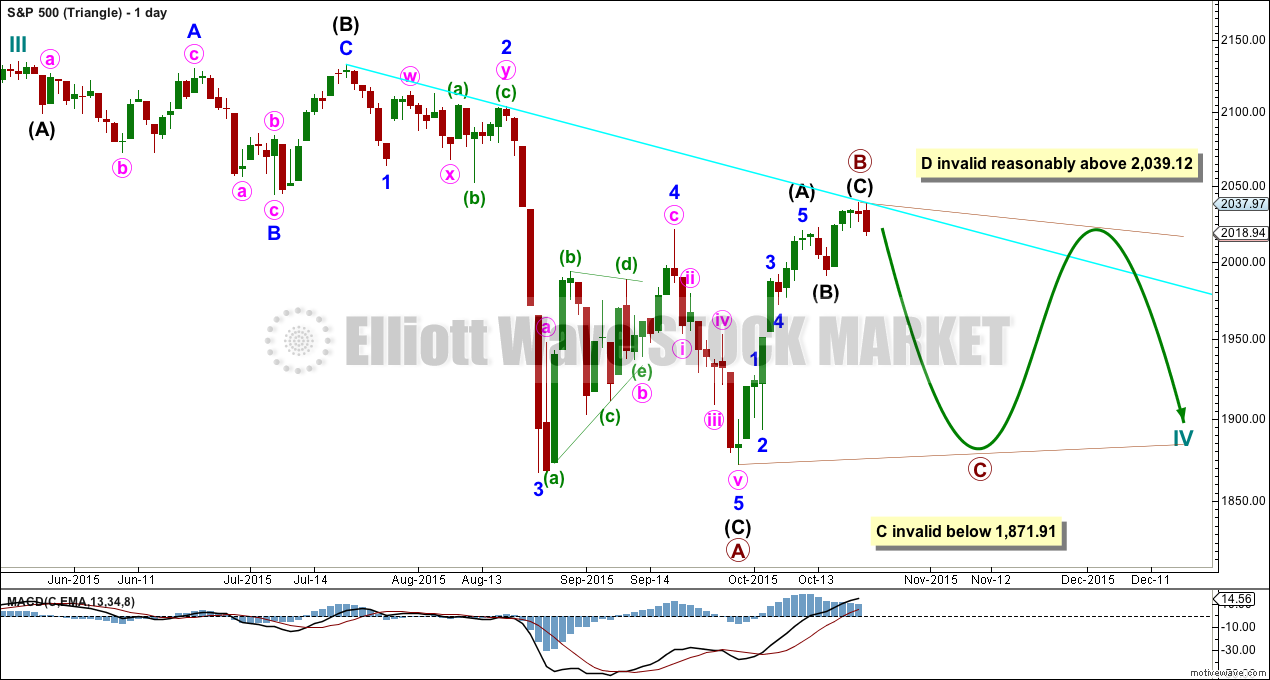
Cycle wave IV may unfold as a shallow triangle. This would provide alternation with the 0.41 zigzag of cycle wave II.
One of the five sub waves of a triangle is sometimes about 0.618 the length of its predecessor. Here primary wave B may now be a complete zigzag at 0.636 the length of primary wave A. Upwards movement may end due to resistance at the aqua blue trend line.
A single or double zigzag may unfold downwards for primary wave C. On the hourly chart, it should begin with a clear five down for a move at primary degree.
Primary wave C of a barrier or contracting triangle may not move beyond the end of primary wave A at 1,871.91.
I will consider only barrier or contracting triangle types as expanding triangles are very rare, the rarest of all Elliott Wave structures. I would only consider this possibility if it shows itself to be true. It has an exceptionally low probability.
When primary wave C is complete, then primary wave D upwards may not move beyond the end of primary wave C for a contracting triangle above 2,039.12.
For a barrier triangle, primary wave D may end about the same level as primary wave C at 2,039.12 as long as the B-D trend line is essentially flat. What this means in practice is that D can end slightly above B at 2,039.12. This is the only Elliott Wave rule which is not black and white.
The final wave of the triangle for primary wave E may not move beyond the end of primary wave C.
The whole structure moves sideways in an ever decreasing range. The purpose of triangles is to take up time and move price sideways.
At the hourly chart level, this idea requires a five down to begin the A wave of a single or double zigzag. The subdivisions are the same, so only one hourly chart is presented for these two daily charts for cycle wave IV.
HOURLY CHART
Click chart to enlarge.
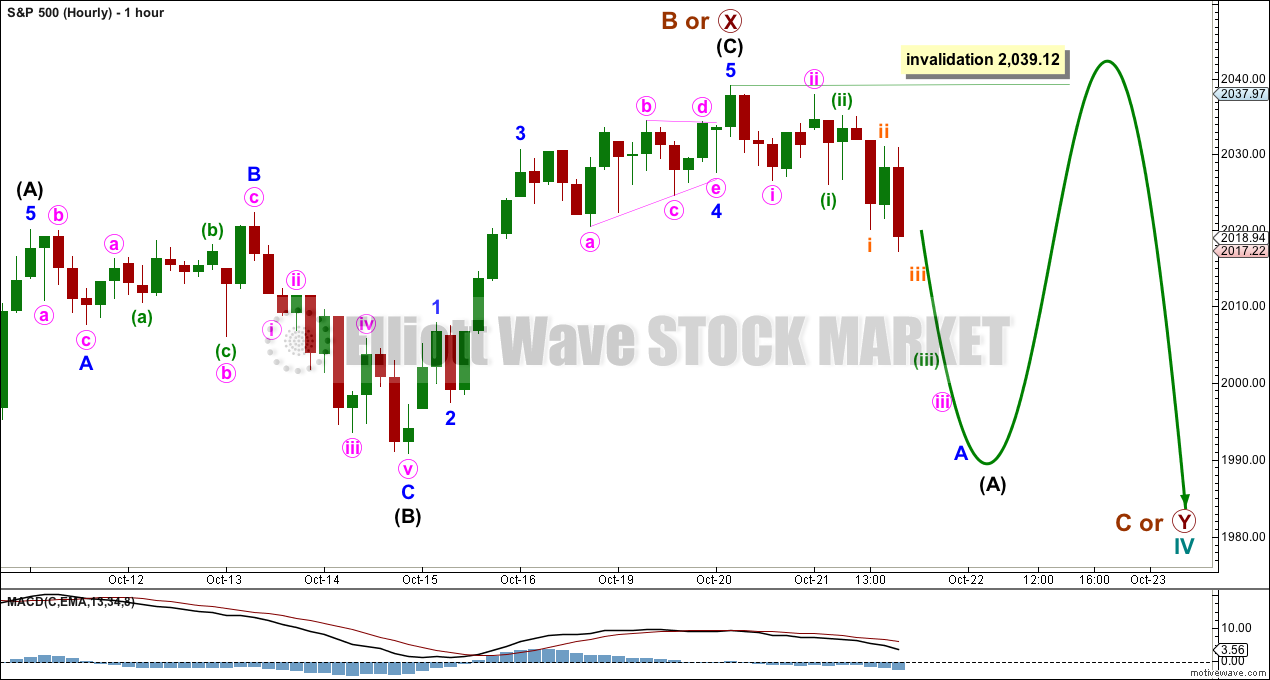
Within the first five down, no second wave correction may move beyond its start above 2,039.12.
To begin the first five down there may now be a series of three overlapping first and second waves. This indicates the next session should show some increase in downwards momentum.
Intermediate wave (A) should be a three wave structure, most likely a zigzag but it may also be a flat correction. Either way, the first move down on the hourly chart for a wave at intermediate degree should be a clear five. That is so far incomplete.
ALTERNATE BULL ELLIOTT WAVE COUNT
DAILY CHART
Click chart to enlarge.
It is possible to see cycle wave IV a completed flat correction. This would provide some structural alternation with the zigzag of cycle wave II.
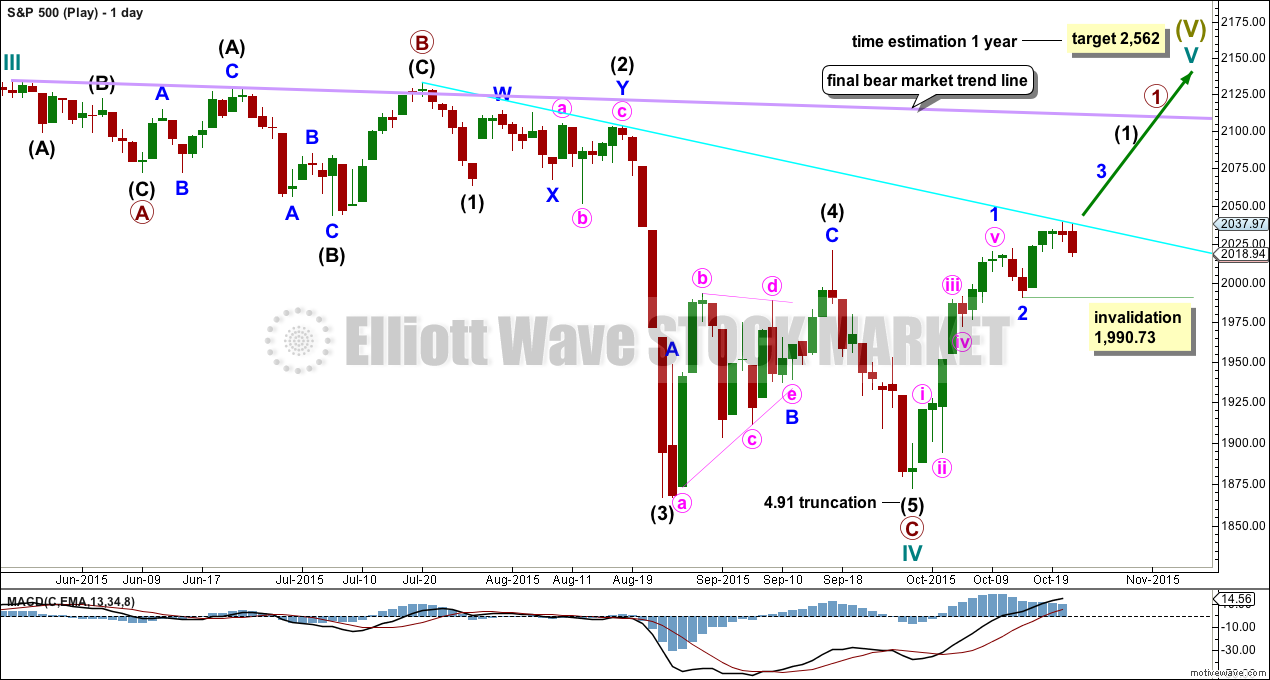
This is a regular flat but does not have a normal regular flat look. Primary wave C is too long in relation to primary wave A. Primary wave C would be 3.84 short of 4.236 the length of primary wave A. While it is possible to also see cycle wave IV as a complete zigzag (the subdivisions for that idea would be labelled the same as the bear wave count below, daily chart) that would not provide structural alternation with the zigzag of cycle wave II, and so I am not considering it.
This idea requires not only a new high but that the new high must come with a clear five upwards, not a three.
At 2,562 cycle wave V would reach equality in length with cycle wave I. Cycle wave I was just over one year in duration so cycle wave V should be expected to also reach equality in duration.
I added a bear market trend line drawn using the approach outlined by Magee in “Technical Analysis of Stock Trends”. When this lilac line is clearly breached by upwards movement that shall confirm a trend change from bear to bull. If it comes with a clear five up, then this wave count would be further confirmed.
While price remains below the bear market trend line, we should assume the trend remains the same: downwards.
The invalidation point for this idea now must be moved up. Minor wave 2 is a complete expanded flat correction and minor wave 3 is beginning. No second wave correction may move beyond its start below 1,990.73 within minor wave 3.
BEAR ELLIOTT WAVE COUNT
DAILY CHART
Click chart to enlarge.
This bear wave count has a better fit at Grand Super Cycle degree and is better supported by regular technical analysis at the monthly chart level. But it is a huge call to make, so I present it second, after a more bullish wave count, and until all other options have been eliminated.
There are two ideas presented in this chart: a huge flat correction or a double flat / double combination. The huge flat is more likely. They more commonly have deep B waves than combinations have deep X waves (in my experience).
A huge flat correction would be labelled super cycle (a)-(b)-(c). It now expects a huge super cycle wave (c) to move substantially below the end of (a) at 666.79. C waves can behave like third waves. This idea expects a devastating bear market, and a huge crash to be much bigger than the last two bear markets on the monthly bear chart.
The second idea is a combination which would be labelled super cycle (w)-(x)-(y). The second structure for super cycle wave (y) would be a huge sideways repeat of super cycle wave (a) for a double flat, or a quicker zigzag for a double combination. It is also possible (least likely) that price could drift sideways in big movements for over 10 years for a huge triangle for super cycle wave (y).
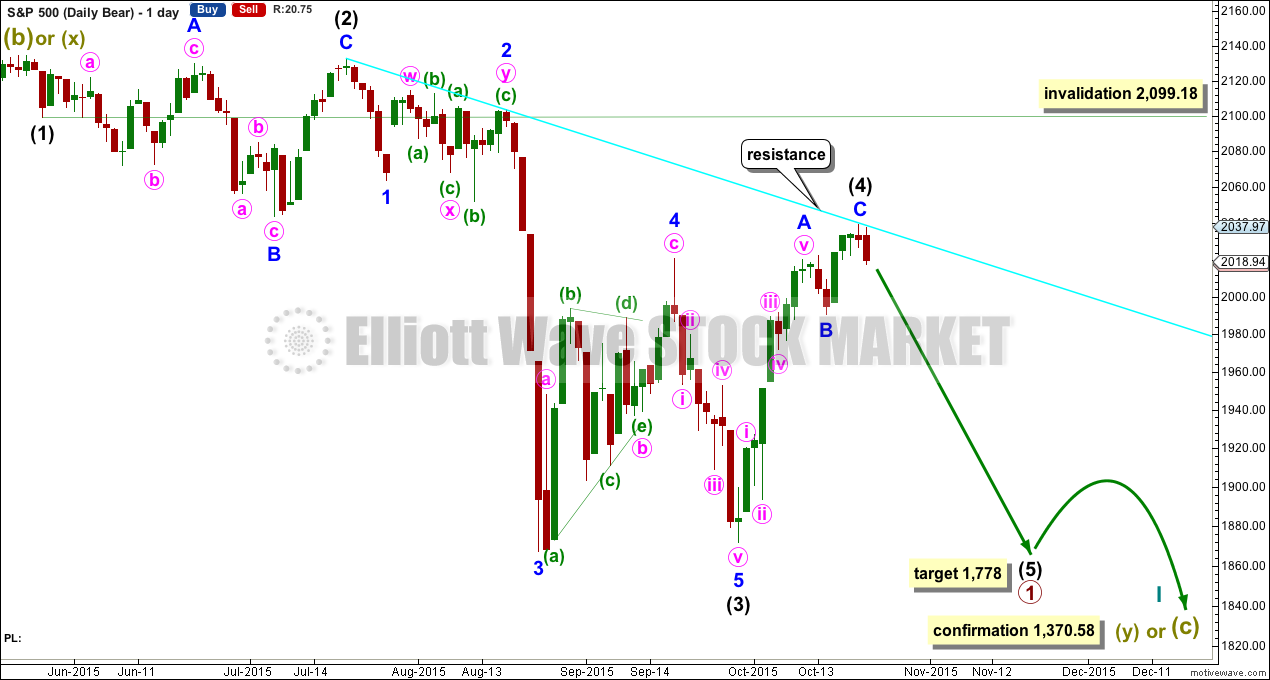
I am now seeing a third wave complete at the last major low for intermediate wave (3). Intermediate wave (3) is 17.31 longer than 6.854 the length of intermediate wave (1).
Minor wave 5 is seen as complete and slightly truncated.
A channel drawn using Elliott’s technique no longer works. Sometimes fourth waves aren’t contained within such a channel, which is why Elliott developed a second technique to use when they breach the channel.
Intermediate wave (2) was a very deep 0.95 expanded flat lasting 38 sessions. Intermediate wave (4) should exhibit alternation, is most likely to be more shallow, and be a quicker zigzag or zigzag multiple.
Intermediate wave (4) may have ended as a single zigzag in a total 15 sessions, with no Fibonacci duration. It may have ended when price found resistance at the aqua blue trend line.
If intermediate wave (4) continues higher (and it technically could as a double zigzag, although this has a low probability), then it may not move into intermediate wave (1) price territory above 2,099.18.
A new low below 1,990.73 would provide price confirmation that intermediate wave (4) is over. At that stage, I would move the invalidation point on the daily chart down to the high of intermediate wave (4).
HOURLY CHART
Click chart to enlarge.
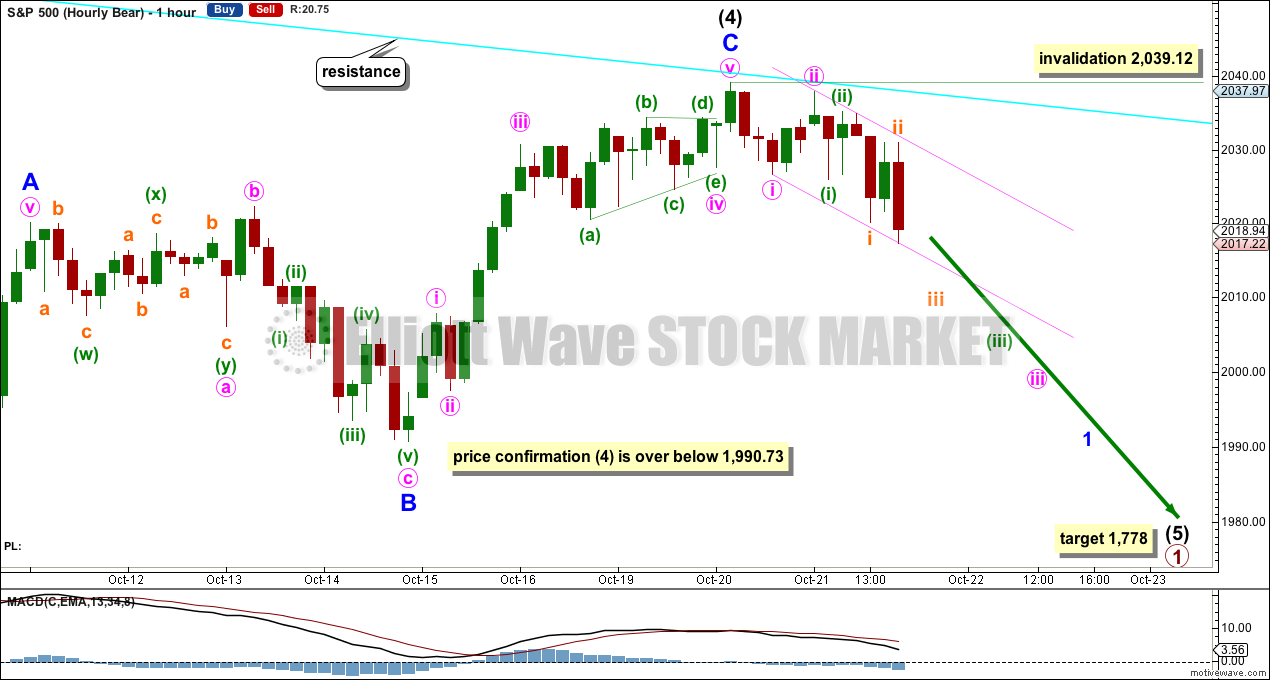
I have drawn an acceleration channel about minute waves i and ii on this chart. Draw the first trend line from the end of minute wave i to the last low, then place a parallel copy on the end of minute wave ii. As price keeps moving lower keep redrawing the channel. The upper edge may be useful to show where corrections may find resistance. When minute wave iii is complete the channel will be drawn using Elliott’s first technique and so may show where minute wave iv may find resistance.
At 1,778 intermediate wave (5) would reach equality in length with intermediate wave (3).
No second wave correction may move beyond the start of its first wave above 2,039.12 within intermediate wave (5).
TECHNICAL ANALYSIS
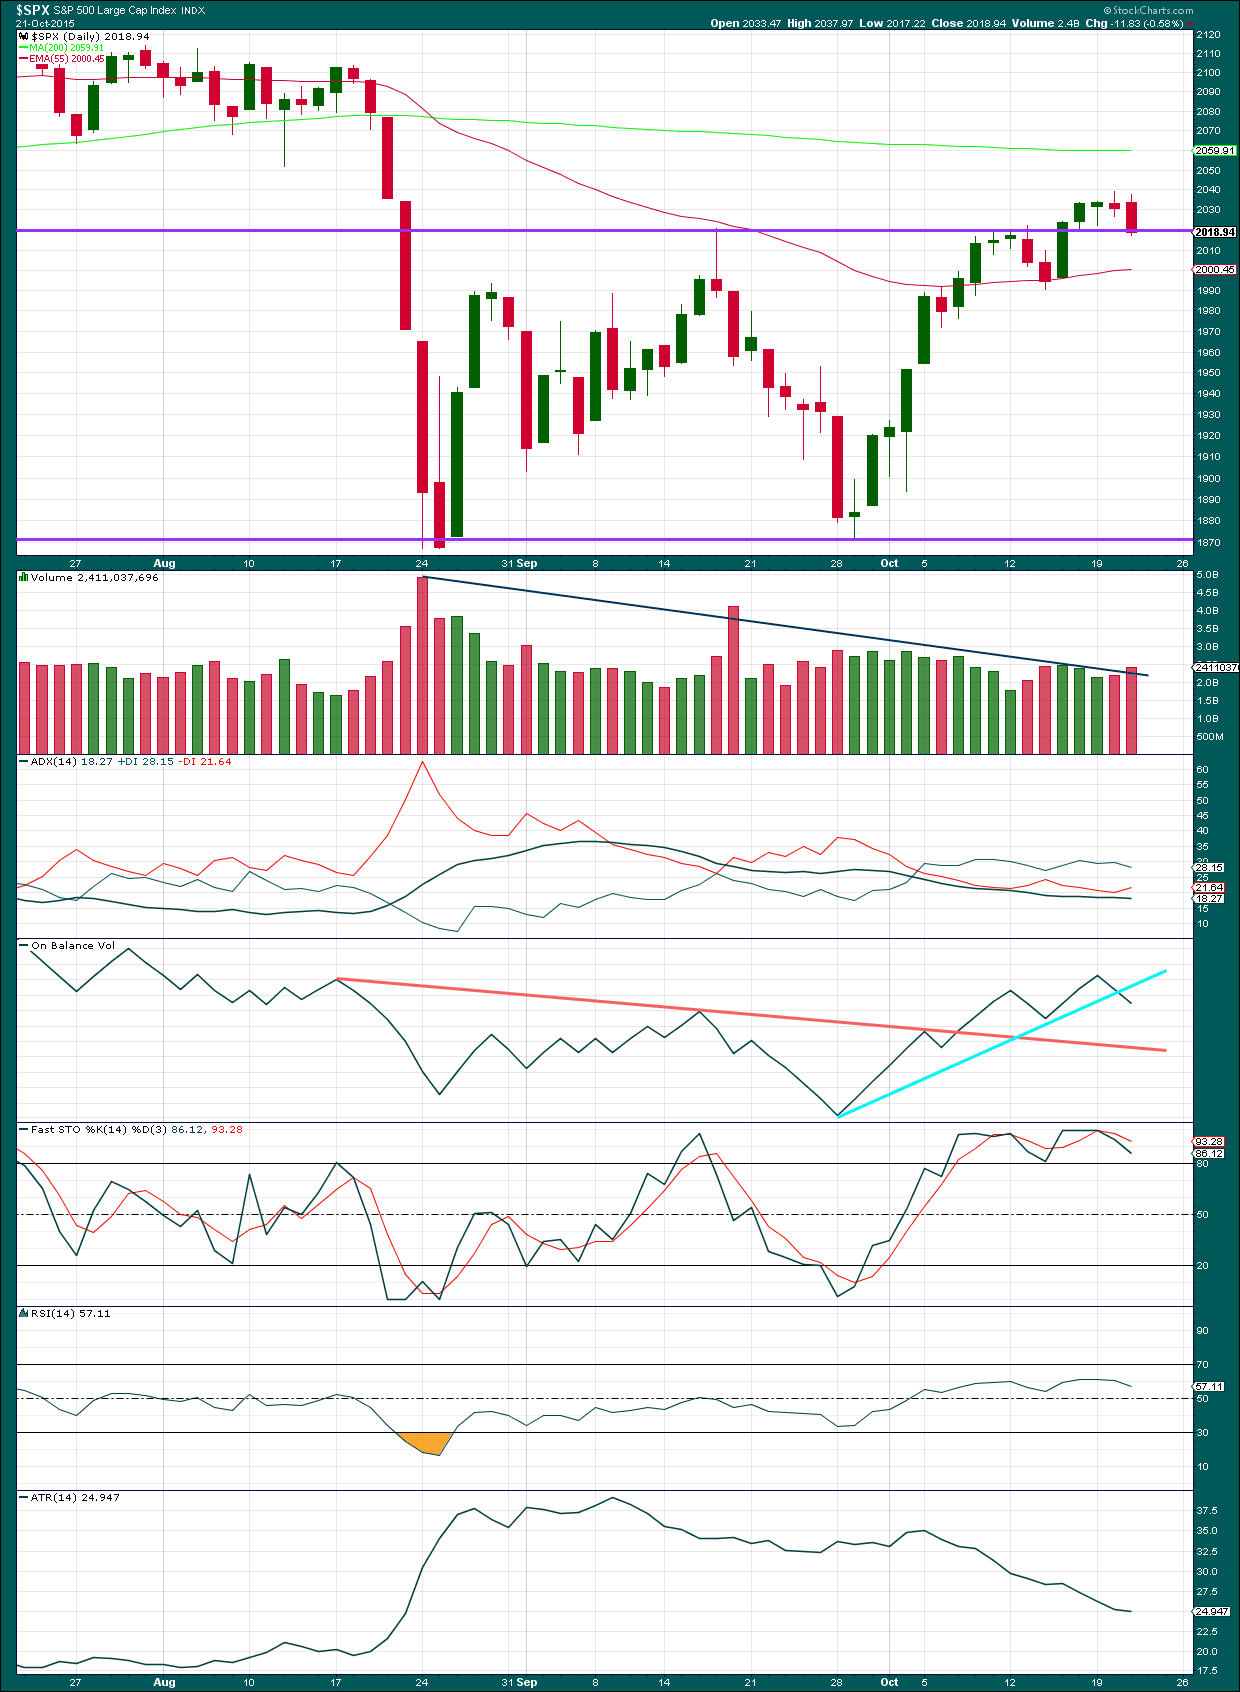
Click chart to enlarge. Chart courtesy of StockCharts.com.
Daily: Wednesday’s stronger downwards day comes on some increase in volume but not much. There was some support for the fall in price.
Price is finding support about the horizontal trend line. If price breaks below that line tomorrow, then I would have more confidence in the Elliott wave counts. Specifically, I would have more confidence in the analysis of the prior upwards zigzag being complete.
The black ADX line is flat and below 20 indicating the market is not trending. Overall volume is declining while price moves sideways. During this sideways consolidation contained within support and resistance lines it is a downwards day which shows clearly strongest volume. This indicates the breakout is most likely to be down. This trick does not always work, but it works often enough to be a good indicator of the breakout direction.
A range bound system should be used while price remains range bound. The idea outlined here is simple, and simple is usually best. When Stochastics reaches overbought and price reaches resistance expect the end of the upwards swing and a downwards swing to begin. Expect the downwards swing to continue until Stochastics reaches oversold and price reaches support. The problem with this approach (and the reason why trading a range bound market is inherently very risky) is neither Stochastics nor support / resistance lines will show exactly where and when price will turn as they are only general guides. Stochastics can remain extreme for a few days and price can overshoot support / resistance before turning back. Trading a range bound market must be done only with careful money management. Alternatively, step aside and wait for a clear trend to emerge before reentering this market.
Volume overall is still declining during this consolidation, an upwards breakout is not indicated.
On Balance Volume has broken below the short held bright blue line; that line was not very technically significant. This is a weak bearish signal.
I added Average True Range (ATR) today. It has been either flat or declining for much of the sideways movement which followed the last strong wave down to the low. ATR supports ADX in indicating price is currently consolidating. When the consolidation ends and price begins to trend again this will be indicated by ATR again showing an increase.
A note on Dow Theory: for the bear wave count I would wait for Dow Theory to confirm a huge market crash. So far the industrials and the transportation indices have made new major swing lows, but the S&P500 and Nasdaq have not.
S&P500: 1,820.66
Nasdaq: 4,116.60
DJT: 7,700.49 – this price point was breached.
DJIA: 15,855.12 – this price point was breached.
This analysis is published about 10:36 p.m. EST.
It would appear the bears were anticipating another run at the underside of the 200 day MA by the senior indices and they were right. Expect the next wave of selling at that intersection. If the smooch of the underside proves to be a final kiss good-bye as opposed to a re-capture on better volume than we have seen then the Santa Claus rally would have arrived early this year methinks…
This invalidation was unexpected.
The wave counts will see the correction continuing higher as a double zigzag. The second zigzag would have wave A probably complete at the end of today’s session. Wave B looks like it’s underway.
Volume will be important again today. If there’s a sharp increase in volume that would favour the bull wave count (which sees cycle wave IV over). But it would have to be substantial for that wave count, and even then I would not give it weight until it proves itself with a break above the bear market trend line AND a five up to do it.
If volume is lighter today that would favour the more bearish wave counts which see cycle wave IV incomplete.
Lara,
Isn’t it possible that only wave 1 of C of X is complete for the primary wave count? Wave 2 probably ended yesterday, and now we would be in 3 of C of X.
Thanks,
Peter
Yes, entirely possible.
I think what would be more likely though is that a double zigzag is continuing higher.
I will go with that idea because the first idea, to see wave (C) moving higher, would mean that with a single zigzag continuing the second wave within (C) breached the channel drawn about the zigzag. That looks odd.
A double zigzag has more of the right look.
Surprise, surprise…at another important inflection point in the markets the banksters trot out the EU apparatchik Draghi to jawbone about additional QE from the ECB. Despite the pop in futures, this is a fairly reliable sign that at the very least an intermediate top is in. The useless chatter was no doubt triggered by impending failure of small caps indices at the 50 day SMA and the SPX and transports turn down from a confluence of several trend lines.Hard to believe that anyone is buying what these folk are selling.
Keep an eye on what UVXY does today for clues as to how many suckers take the bait…key level remains DJI 17,000
Hi Lara
A question about the “quality” of the September low versus the August one… The auto version of MotiveWave favours your alternative bull count, but it is favouring the August low as a starting point instead of the truncated September one…
My question is about the reasoning for using the September low on that wave count – Is there any level that would make you revisit that count?
Duncan
Many thanks
DS
2 hour bars
1. I never use the auto labelling feature of Motive Wave. I have no confidence in it at all.
2. My reasoning is that a truncated fifth may occur after a third that moved “too far too fast”. That third wave certainly fits that description.
3. Your wave count kindly published here has some problems:
– C waves don’t subdivide as threes (unless it’s a C wave in a triangle). I know Motive Wave will do that, but it is contrary to the rules and guidelines in Frost and Prechter.
– In the downwards movement the B wave (circle) really should end further to the right. It’s leaving the C wave (circle) as a three, that C wave should be a five.
– (C) within A (circle) is a three. It should not be, it must be a five.
And that’s why I don’t use Motive Wave’s auto labelling feature ever. That wave count does not fit for those reasons.
And that’s why I have my low with a truncated fifth. The C wave must be a five, it cannot be a three.
There are some other problems with how it’s labelled the prior upwards movement, that ending diagonal. Specifically the A wave of the fifth wave has invalid labelling. It looks like it’s trying to label that as a leading diagonal, but the fourth wave moves beyond the end of wave two, that breaks an EW rule so it’s invalid.
Wow – thanks for that… I’m on the trial and I didn’t realise that there were such fundamental flaws in there… VERY important to know. Scary in a way also – to know that rules are not being followed. I won’t be buying.
Lara
Re hourly bearish count
I should be grateful if could please explain, for educational purposes, why you think Minute 1 and 2 are over and that we are not still tracing out Minute wave 1?
The degree could be moved down one, yes.
I chose it because of the expected length of intermediate (5). To be equal in length with intermediate (3) as the target expected the first wave would be expected also to be about equal in length.
And that’s one of the hardest things to get right at the start of a movement; what degree to label it? Flexibility is important.
Anyway, a new high above the start today has invalidated it.
I think that at count 1 hour bull need ((B))or((X)) at 2039.12 and not B or ((X)) . the same at C or ((y)) , need to be ((C))or ((Y)) .
Do you mean it needs to be moved down one degree?
If that’s the case, then yes. That’s a possibility.
Which I would consider when the double combination or triangle is complete.
An A wave of a flat could be a double combination.
So when its complete I’d have an alternate which moves it down one degree, but that would depend on how big the movement is when it’s over and what it looks like on the weekly and monthly charts.