
Downwards movement was expected for Wednesday’s session, but it did not happen.
Price moved sideways and then ended with upwards movement.
Summary: A short term target for upwards movement to end is at 2,013. When the channel on the hourly charts is breached by clear downwards movement then it should be expected that upwards movement is over and a downwards wave has begun, whether or not the target at 2,013 is reached. The next wave down is now expected to be a correction which may not move below 1,871.91. The regular technical analysis picture expects that the S&P remains within a consolidation. Volume still supports a downwards breakout when this consolidation is complete.
To see how each of the bull and bear wave counts fit within a larger time frame see the Grand Supercycle Analysis.
To see last analysis of weekly and monthly charts go here.
If I was asked to pick a winner (which I am reluctant to do) I would say the bear wave count has a higher probability. It is better supported by regular technical analysis at the monthly chart level, it fits the Grand Supercycle analysis better, and it has overall the “right look”.
New updates to this analysis are in bold.
BULL ELLIOTT WAVE COUNT
DAILY CHART
Click chart to enlarge.
Cycle wave IV should exhibit alternation to cycle wave II. Cycle wave IV may find support at the teal channel on the weekly and monthly charts.
Cycle wave II was a shallow 0.41 zigzag lasting three months. Cycle wave IV should exhibit alternation in structure and maybe also alternation in depth. Cycle wave IV may end when price comes to touch the lower edge of the teal channel which is drawn about super cycle wave V using Elliott’s technique.
Cycle wave IV is likely to end within the price range of the fourth wave of one lesser degree. Because of the good Fibonacci ratio for primary wave 3 and the perfect subdivisions within it, I am confident that primary wave 4 has its range from 1,730 to 1,647.
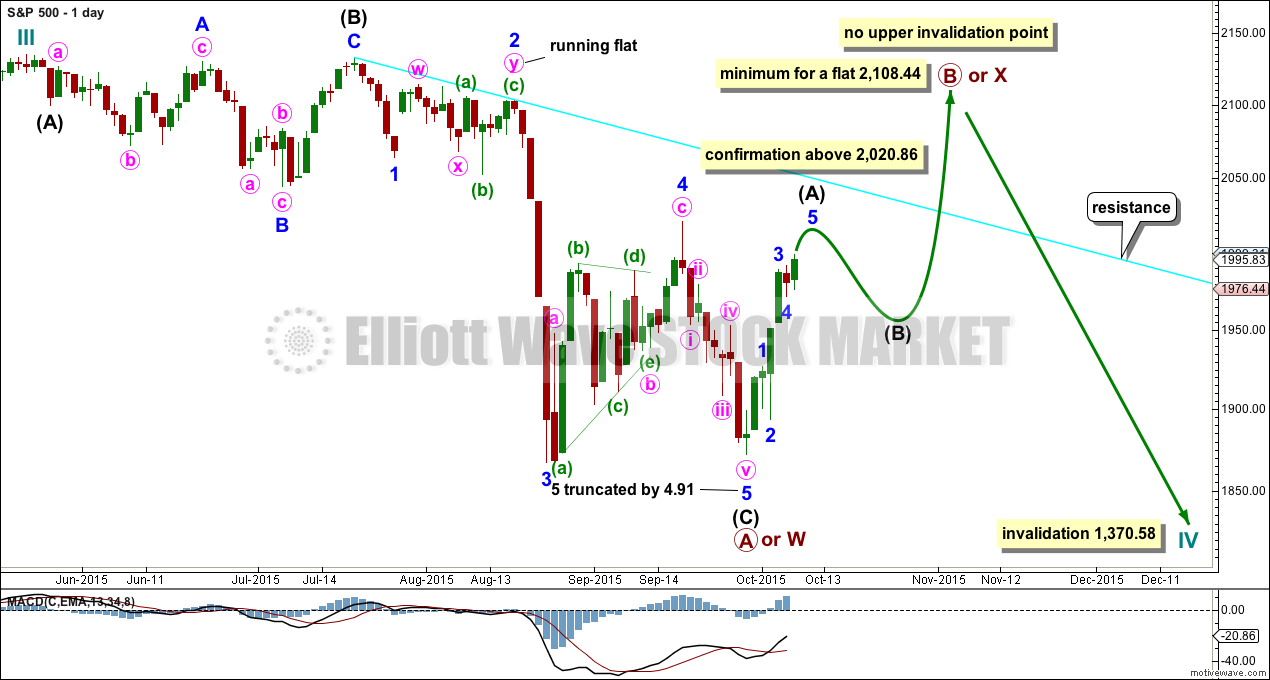
If a zigzag is complete at the last major low as labelled, then cycle wave IV may be unfolding as a flat, combination or triangle.
This idea would have earliest confirmation with a new high above 2,020.86. That would invalidate the first alternate.
If cycle wave IV is a flat correction, then within it primary wave B must subdivide as a corrective structure (a three or a triangle) and must end at least 90% the length of primary wave A at 2,108.44. Primary wave B of an expanded flat may make a new all time high above 2,134.72. There is no upper invalidation point for this idea.
If cycle wave IV is a combination, then it would be labelled primary waves W-X-Y. Primary wave X may be any corrective structure and it has no minimum requirement, unlike the B wave within a flat. X waves within combinations are most often deep corrections to achieve the purpose of a big sideways movement. X waves may move beyond the start of W waves. There is no upper invalidation point for this idea either.
If cycle wave IV is a triangle, then primary wave B upwards has no minimum requirement, must subdivide as a three wave structure (most likely a zigzag), and may also make a new all time high as in a running triangle. There is no upper invalidation point for this idea either.
Of all Elliott waves it is B waves which exhibit the greatest variety in structure and form. They are extremely difficult to analyse. Often, it is only when they are complete that their structure can be determined.
At this stage, primary wave B looks like it may be unfolding as a zigzag. This may change though.
HOURLY CHART
Click chart to enlarge.
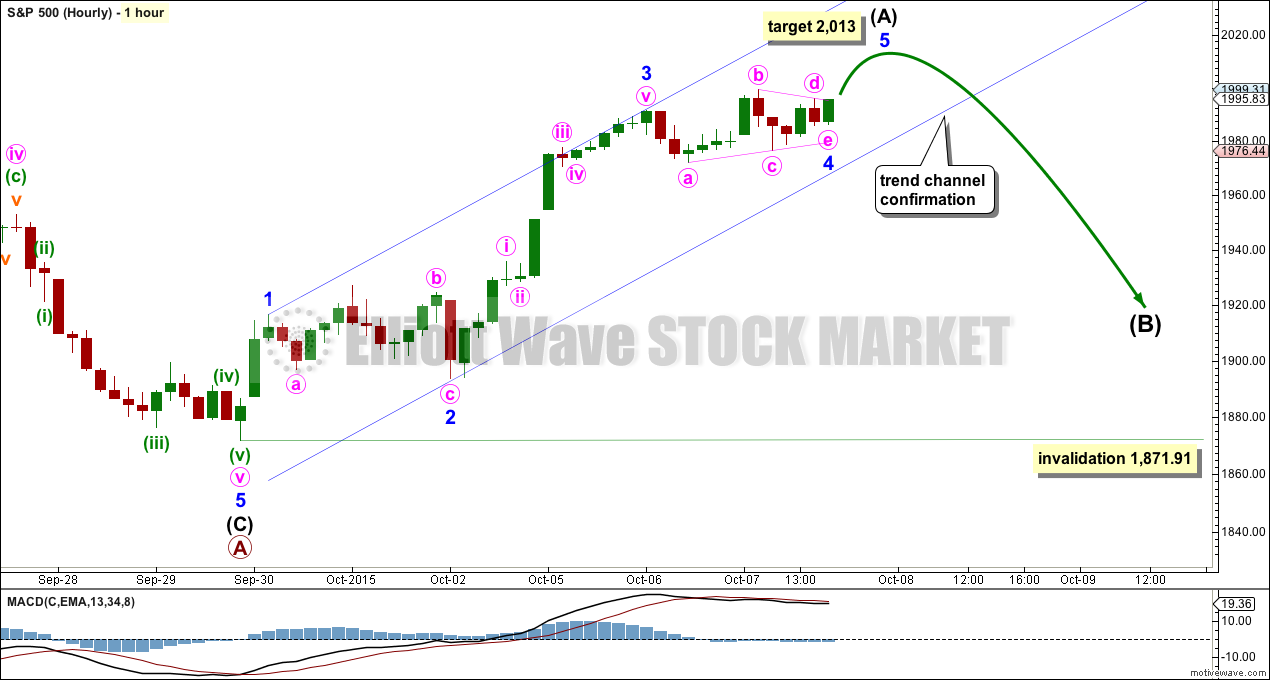
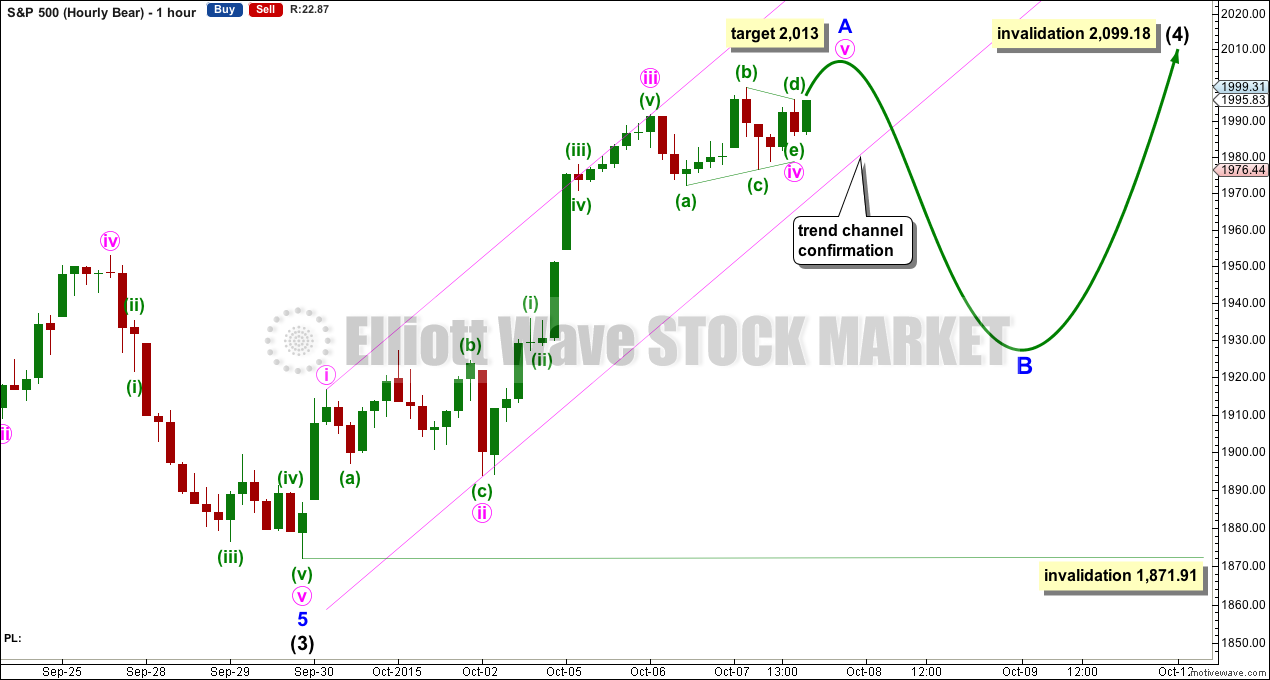
There is no Fibonacci ratio between minor waves 3 and 1 which makes it more likely that minor wave 5 will exhibit a ratio to either of minor waves 3 or 1. If it is over at Wednesday’s high (which is technically possible), then it would have no Fibonacci ratio to either of minor waves 3 or 1, so I judge this upwards movement to be incomplete on that basis.
At 2,013 minor wave 5 would reach 0.618 the length of minor wave 1.
Minor wave 4 continued sideways as a running contracting triangle. This still provides alternation with the deeper expanded flat of minor wave 2.
When downwards movement clearly breaches the small channel drawn here using Elliott’s first technique that shall provide trend channel confirmation that this upwards wave is over and the next wave down has begun. This breach will be indication of a trend change short term whether or not the target at 2,013 is met.
If intermediate wave (A) completes as a five wave impulse as labelled, and this does now look like an impulse, then intermediate wave (B) to follow may not move beyond the start of intermediate wave (A) below 1,871.91.
I am discarding the first alternate from yesterday’s analysis because it now looks entirely wrong. There are too many problems with it. I have no confidence in that idea anymore.
ALTERNATE BULL ELLIOTT WAVE COUNT
DAILY CHART
Click chart to enlarge.
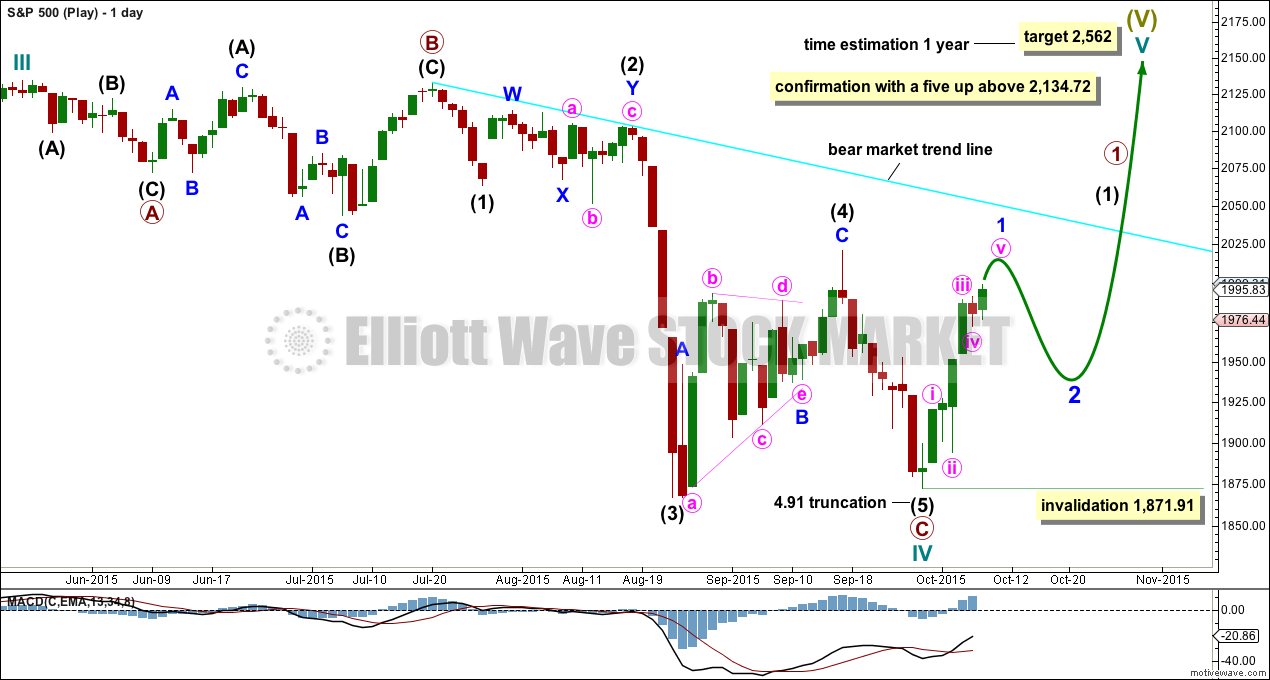
It is possible to see cycle wave IV a completed flat correction. This would provide some structural alternation with the zigzag of cycle wave II.
This is a regular flat but does not have a normal regular flat look. Primary wave C is too long in relation to primary wave A. Primary wave C would be 3.84 short of 4.236 the length of primary wave A.
This idea requires not only a new high but that the new high must come with a clear five upwards, not a three.
At 2,562 cycle wave V would reach equality in length with cycle wave I. Cycle wave I was just over one year in duration so cycle wave V should be expected to also reach equality in duration.
I am adding a bright aqua blue trend line to daily charts. Any bullish wave count such as this one must have three things for confirmation:
1. A clear breach of the bear market trend line (this line is less conservative than a bear market line drawn using Magee’s approach. That line would be almost flat. Hence two other conditions are required).
2. Price break above the 200 day Simple Moving Average.
3. A clear five up on the daily chart.
While none of these conditions are met, we should assume the trend remains the same: downwards.
BEAR ELLIOTT WAVE COUNT
DAILY CHART
Click chart to enlarge.
This bear wave count has a better fit at Grand Super Cycle degree and is better supported by regular technical analysis at the monthly chart level. But it is a huge call to make, so I present it second, after a more bullish wave count, and until all other options have been eliminated.
There are two ideas presented in this chart: a huge flat correction or a double flat / double combination. The huge flat is more likely. They more commonly have deep B waves than combinations have deep X waves (in my experience).
A huge flat correction would be labelled super cycle (a)-(b)-(c). It now expects a huge super cycle wave (c) to move substantially below the end of (a) at 666.79. C waves can behave like third waves. This idea expects a devastating bear market, and a huge crash to be much bigger than the last two bear markets on the monthly bear chart.
The second idea is a combination which would be labelled super cycle (w)-(x)-(y). The second structure for super cycle wave (y) would be a huge sideways repeat of super cycle wave (a) for a double flat, or a quicker zigzag for a double combination. It is also possible (least likely) that price could drift sideways in big movements for over 10 years for a huge triangle for super cycle wave (y).
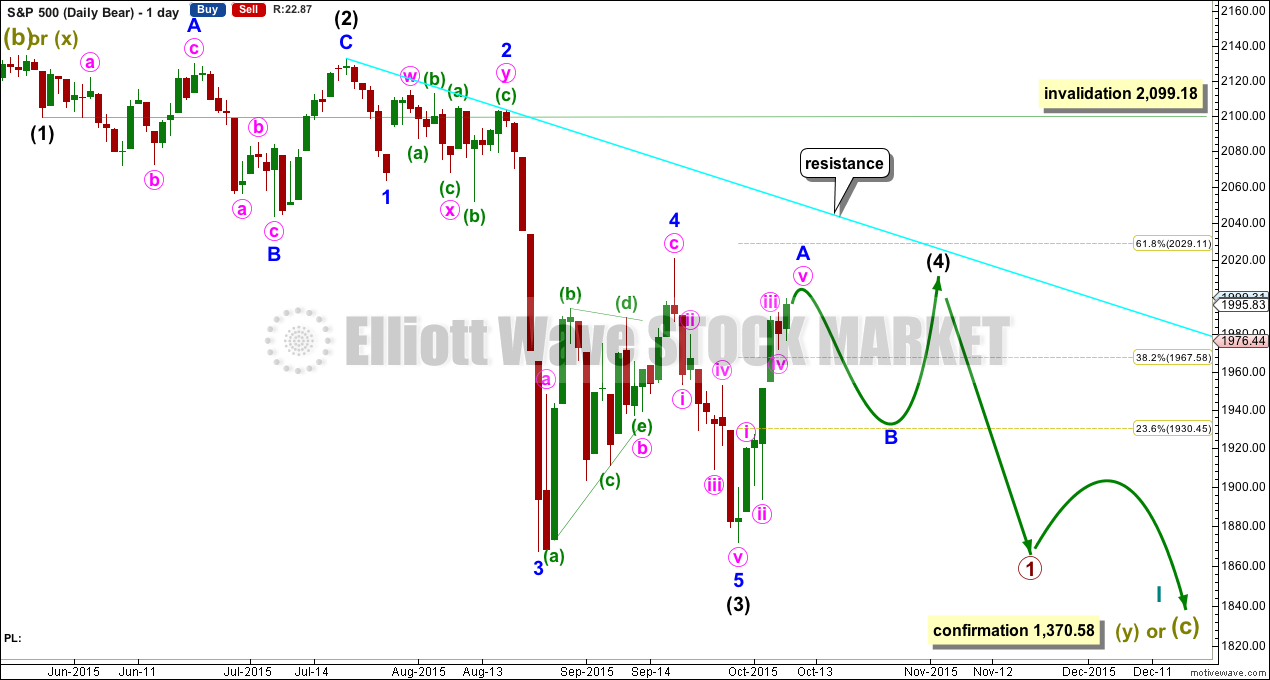
I am now seeing a third wave complete at the last major low for intermediate wave (3). Intermediate wave (3) is 17.31 longer than 6.854 the length of intermediate wave (1).
Minor wave 5 is seen as complete and slightly truncated.
A channel drawn using Elliott’s technique no longer works. Sometimes fourth waves aren’t contained within such a channel, which is why Elliott developed a second technique to use when they breach the channel.
Intermediate wave (2) was a very deep 0.95 expanded flat lasting 38 sessions. Intermediate wave (4) should exhibit alternation, is most likely to be more shallow, and be a quicker zigzag or zigzag multiple. It may not move into intermediate wave (1) price territory above 2,099.18.
At this stage, now there looks like a five up on the daily chart. For this bear wave count, this would be minor wave A either complete or close to complete. Subdivisions on the hourly chart level are the same today for all three wave counts. There is no divergence short term.
Intermediate wave (4) is not over. It may end in a total Fibonacci 21 sessions which would see it continue now for a further 15 sessions.
HOURLY CHART
Click chart to enlarge.
Within intermediate wave (4), minor wave A may be incomplete. The target is the same at 2,013. The channel is also the same and should be used in the same way. The channel needs to be breached to indicate minor wave A as complete.
Minor wave B may not move beyond the start of minor wave A below 1,871.91. The rule for B waves within zigzags is the same as the rule for second waves within impulses.
A target for minor wave C may be calculated when minor wave B is complete.
Minor wave B may be any one of 23 possible structures. It is impossible to tell which one it will be and so the pathway of price during a B wave is impossible to predict. Analysis during B waves should focus on identifying their conclusion.
TECHNICAL ANALYSIS
DAILY CHART
Click chart to enlarge. Chart courtesy of StockCharts.com.
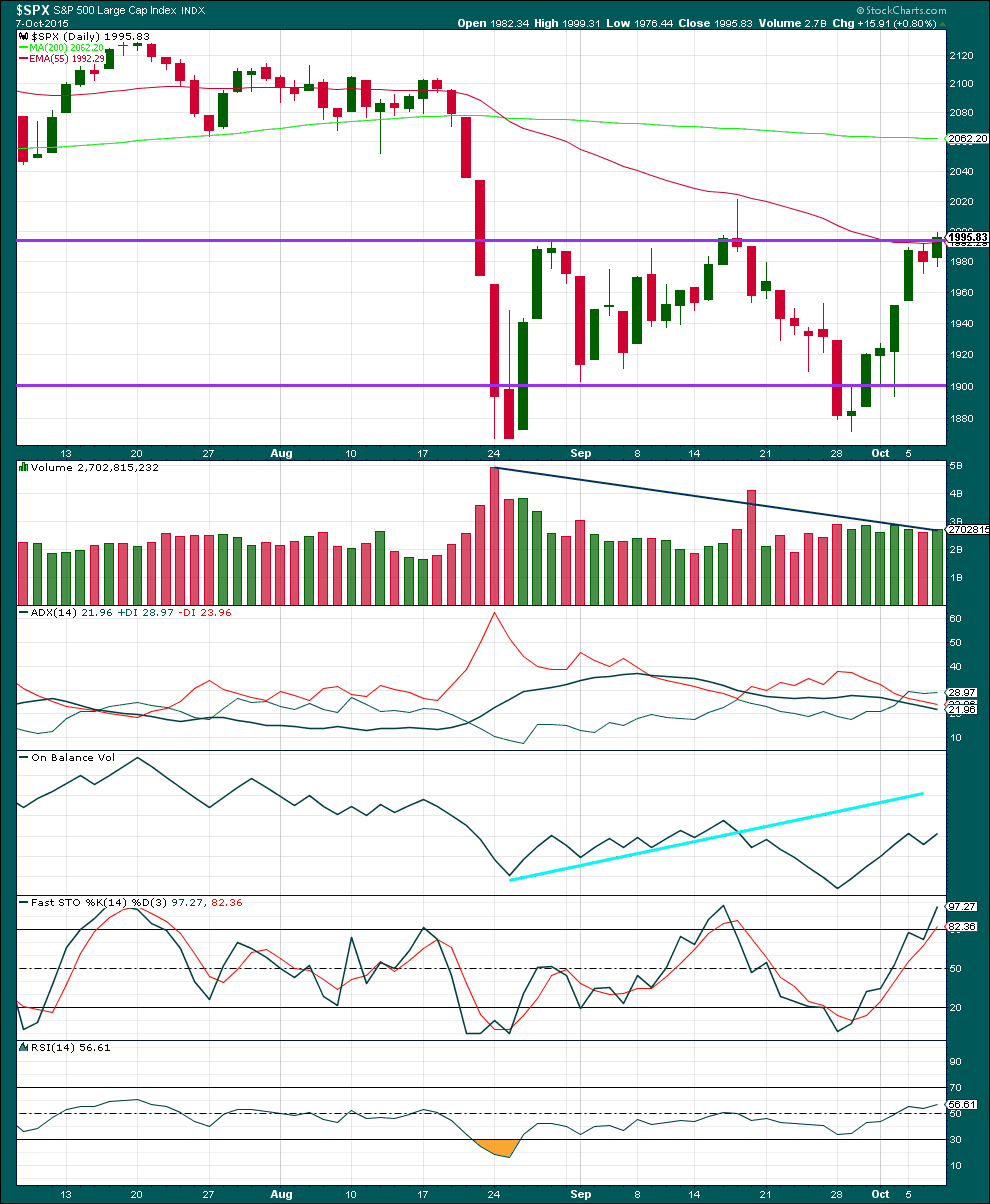
Daily: Upwards movement has slightly overshot the horizontal trend line again, and slightly overshot the 55 day Exponential Moving Average (incorrectly stated yesterday as Kaufman’s Moving Average). I use 55 because it is a Fibonacci number.
Volume overall continues to decline as price moves higher. The rise in price is consistently not supported well by volume.
The black ADX line remains flat indicating the market is not trending. Overall volume is declining while price moves sideways. During this sideways consolidation mostly contained within support and resistance lines it is a downwards day which shows clearly strongest volume. This indicates the breakout is most likely to be down.
Each time price falls volume rises, and each time price rises or drifts sideways volume has been declining. The volume profile is bearish. There is little ambiguity.
I am removing the green trend line from On Balance Volume as it does not provide resistance and is not of use. While price made new highs today OBV was flat. This is slightly bearish.
Stochastics is now overbought. With ADX indicating a range bound market and price slightly overshooting resistance, downwards movement would be expected from this approach. The problem though with range bound markets is price can overshoot support and resistance with Stochastics remaining oversold or overbought for a few sessions before one swing ends and the next begins. This is why trading range bound markets is so risky. Careful money management is essential when trading during a range bound market. Alternatively, step aside and wait until a clear trend is evident, then join it.
RSI is neither overbought or oversold. There is room for the market to fall or rise.
A note on Dow Theory: for the bear wave count I would wait for Dow Theory to confirm a huge market crash. So far the industrials and the transportation indices have made new major swing lows, but the S&P500 and Nasdaq have not.
S&P500: 1,820.66
Nasdaq: 4,116.60
DJT: 7,700.49 – this price point was breached.
DJIA: 15,855.12 – this price point was breached.
This analysis is published about 08:41 p.m. EST.
Still a bit higher to go on frenetic central bank buying and mandatory pension fund inflows. Low volume continues. Wave pattern a bit unclear for me( looking like a C up) but I think the next decline is close and very likely going to be steep and swift. Market quite oversold. VIX punched through lower B band today. Next close within bands a classic buy signal.
Going off the height of the triangle in minor (4) of intermediate (A), it would project the likely end of minor (5) to complete the (A) wave to be around 2018
I tacked onto the bottom of the monthly SPX chart the weekly MACD and RSI for comparison with the monthly MACD and RSI : Year 2000 almost managed a new high but considering the extent of the downward turn in the 2015 monthly MACD , new highs are hard to imagine.
I agree. Almost everything I see at the weekly and monthly chart levels is bearish. Its really hard to find much bullishness in the bigger picture.
Which leads me to believe that this rise over the last seven days is more likely a bear market rally than the continuation or return of a bull market.
Lara,
This looks like (c) wave up to complete a B wave at [2,030-2,050]. We have completed already wave 3, with 4 and 5 still to come. One or two more weeks and this is done.
Hello Lara,
Your image 4 of 6 is in line with my comments from last week, but now I’m wondering if we can satisfy the “right look” if this current A of ABC up, corrects higher than wave 4 of one lessor degree ( 2020 ), and instead, continues up to 2055 area where wave C would not only be equal to the length of wave A, but would also show confluence with 76.4% retracement of the entire move down which is a familiar % of a wave 2 retracement. ….. In other words, wave 1 would’ve ended at the truncation near 1873 and everything since the Sept 29th truncation is a corrective wave 2?? Is this possible?
I’m believe wave 5 of 5 of A was either completed today, or will finish up tomorrow. Then, like you said, will be followed by 3 waves down. Then possibly 3 or 5 waves up to the 76.4% retracement level, followed by the beginning of the move down that we’ve all been looking for. A move down of the magnitude I believe is around the corner so far fetched for most. This is one psychological reason why I feel we will correct higher. Technically, the steepness of wave A is also doing a good job of giving the appearance of a strong market.
Lisa, I have similar view as you expressed (below). Do you see the possible move down as a primary bull correction down to 1700, 1600 etc then back up or….. beginning of primary bear going down, down down?
” A move down of the magnitude I believe is around the corner so far fetched for most. This is one psychological reason why I feel we will correct higher. Technically, the steepness of wave A is also doing a good job of giving the appearance of a strong market. “
I think psychologically a Dead Cat Bounce such as this one may be has the purpose of convincing market participants that there is no bear market, the fall in price was just a correction, and a bull market is here to stay. The deeper the bounce the better this works. And bear market rallies can be deep and sharp.
Intermediate (4) is likely to end within the territory of minor 4, but it does not have to. Thats a guideline not a rule. Its not how fourth waves always work, just often.
Intermediate (2) was really time consuming and very deep indeed. So there’s a fair amount of leeway we can have for intermediate (4) to take its time and move a bit deeper and still have the “right look”. It is the proportion of the second and fourth wave corrections within an impulse that give the impulse the right look.
I am more concerned with price finding resistance at the new downwards sloping aqua blue trend line. If that is breached then I suspect something else may be happening rather than a fourth wave correction.
However, the picture at the monthly chart level for regular technical analysis remains extremely bearish. Even if that trend line is breached such a bullish indication would be overwhelmed by the bearishness at the monthly chart level.