
More upwards movement to 1,963 was expected for Friday.
It was stated in yesterday’s Elliott wave analysis that if the target was wrong, it may be too high. Price did move higher to reach 1,951.21.
Summary: I expect more upwards movement for the next trading session. The target for this correction to end is at 1,963, but that may be too high. When the small orange channel on the hourly chart is clearly breached by downwards movement, that shall provide trend channel confirmation that this correction is over and the next wave down has begun. The middle of a strong third wave may be approaching, so expect any surprises to be to the downside.
To see an outline of the bigger picture on monthly and weekly charts click here.
Changes to last analysis are bold.
BULL ELLIOTT WAVE COUNT
DAILY CHART
Click chart to enlarge.
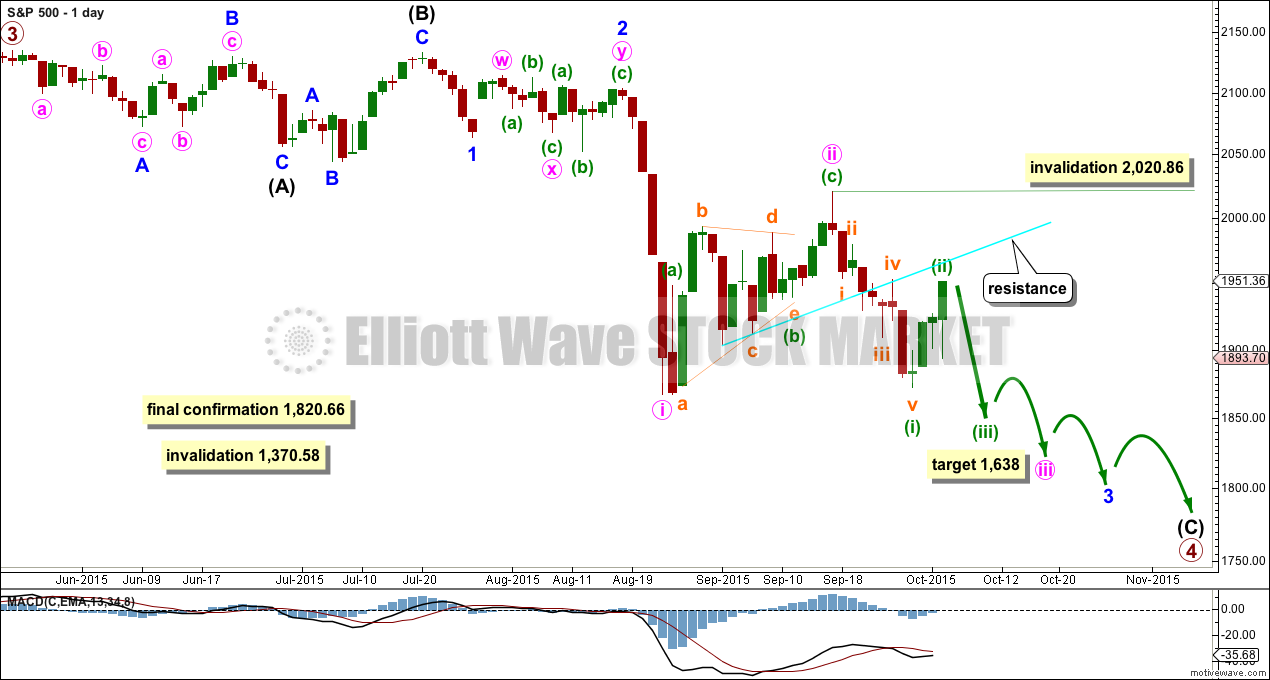
Primary wave 4 may be longer lasting than primary wave 2 as these types of sideways corrective structures tend to be more time consuming than zigzags. Primary wave 4 may complete in a total Fibonacci 21 weeks. Primary wave 4 ended its 19th week, but it may not exhibit a Fibonacci duration because the S&P does not reliably do this. Time estimates may only be taken as a very rough guide.
Within primary wave 4, it may be that intermediate waves (A) and (B) are both complete as three wave structures indicating a flat may be unfolding. Intermediate wave (C) down must be a five wave structure; it looks like it is unfolding as an impulse. For now I will leave this degree as is, but depending on where intermediate wave (C) ends I may move it back down one degree. It is also possible that only minor wave A may be unfolding as a flat correction.
At the daily chart level, this wave count sees primary wave 4 as a possible regular flat correction: intermediate wave (B) is a 98% correction of intermediate wave (A). However, regular flats normally have C waves which are close to equality with their A waves, and they normally fit nicely within parallel channels. Here intermediate wave (C) is much longer than (A) and will still move lower as its structure is incomplete. When the five wave impulse down for intermediate wave (C) is complete, then I will revisit the structure of primary wave 4 which may not be a flat. The structure at the daily chart level so far fits for the very bearish wave count better than this wave count.
If this impulse does not bring price down to the lower edge of the big channel on the weekly chart, then it may only be intermediate wave (A) of a bigger flat for primary wave 4.
Full and final confirmation of a bear market (mid term) would come with:
1. A clear five down on the daily chart.
2. A new low below 1,820.66.
As each condition is met further confidence may be had in the bigger picture for this wave count.
Primary wave 4 may not move into primary wave 1 price territory below 1,370.58. Invalidation of this bull wave count (still bullish at cycle degree) would be confirmation of the bear wave count.
Within the next wave down, whether it be a third wave or a fifth wave (as per the alternate daily wave count), no second wave correction may move beyond its start above 2,020.86.
The Dead Cat Bounce still looks more like a second wave than a fourth wave. It is most common for the S&P to show the subdivisions of its third waves clearly on the daily chart when they extend, and so this current downwards movement looks like a typical third wave so far.
At 1,638 minute wave iii would reach 1.618 the length of minute wave i.
Every day I look at the structure from the all time high on this daily chart to see if I can see a complete corrective structure for primary wave 4. Today it is again possible and this is presented at the end of this analysis.
HOURLY CHART
Click chart to enlarge.
This hourly chart will suffice today for both the main wave count and the alternate below. For the alternate everything is just moved up one degree.
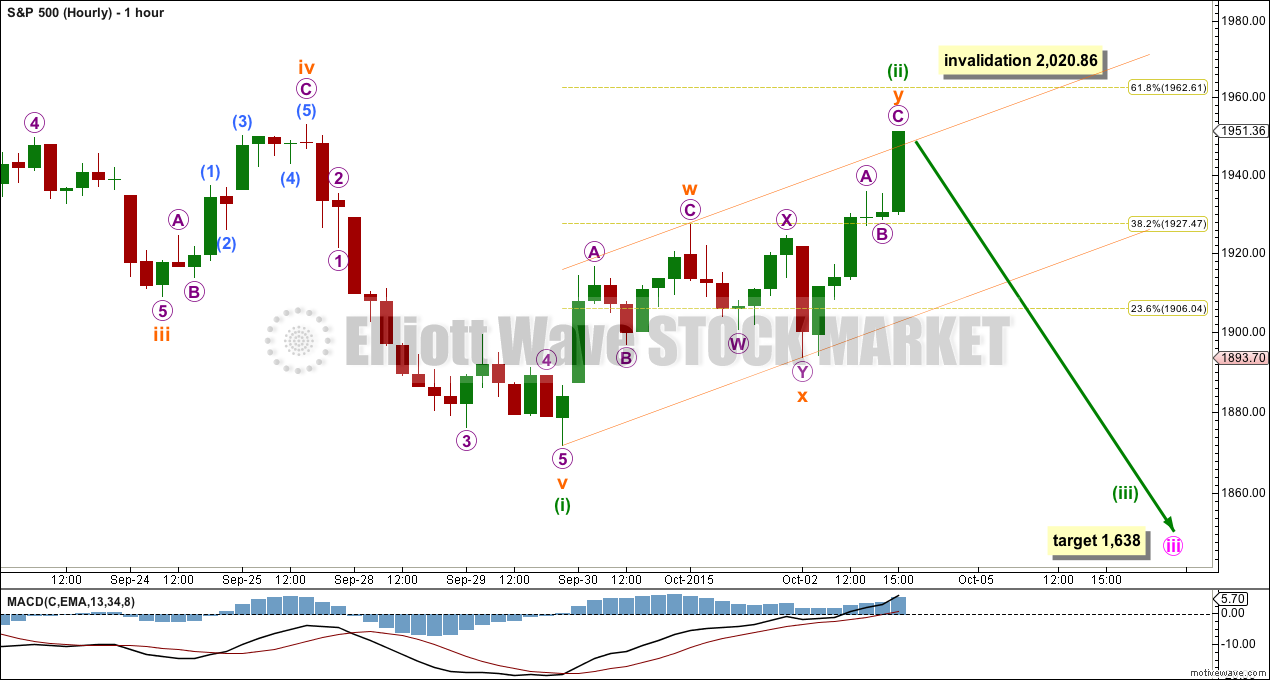
Minuette wave (ii) may be complete and slightly overshoots the upper edge of the channel drawn about it. However, there is no downwards movement at the end of the session to confirm a trend change. A new low below the start of subminuette wave y at 1,893.70 would provide price confirmation of a trend change. Before that, a clear breach of the channel containing this upwards movement would indicate a trend change.
If minuette wave (ii) continues higher, it may end about the 0.618 Fibonacci ratio of minuette wave (i) at 1,963 and may find resistance at the upwards sloping aqua blue trend line on the daily chart.
I will not calculate a target for minuette wave (iii); I have no confidence in the starting point. That would be premature.
Minuette wave (i) lasted a Fiboancci eight days and minuette wave (ii) lasted a Fibonacci three days. With a ratio of 0.382 between them in terms of duration and a potentially complete structure, it is somewhat likely that minuette wave (ii) is over.
Minuette wave (ii) may not move beyond the start of minuette wave (i) above 2,020.86.
ALTERNATE BULL ELLIOTT WAVE COUNT
DAILY CHART
Click chart to enlarge.
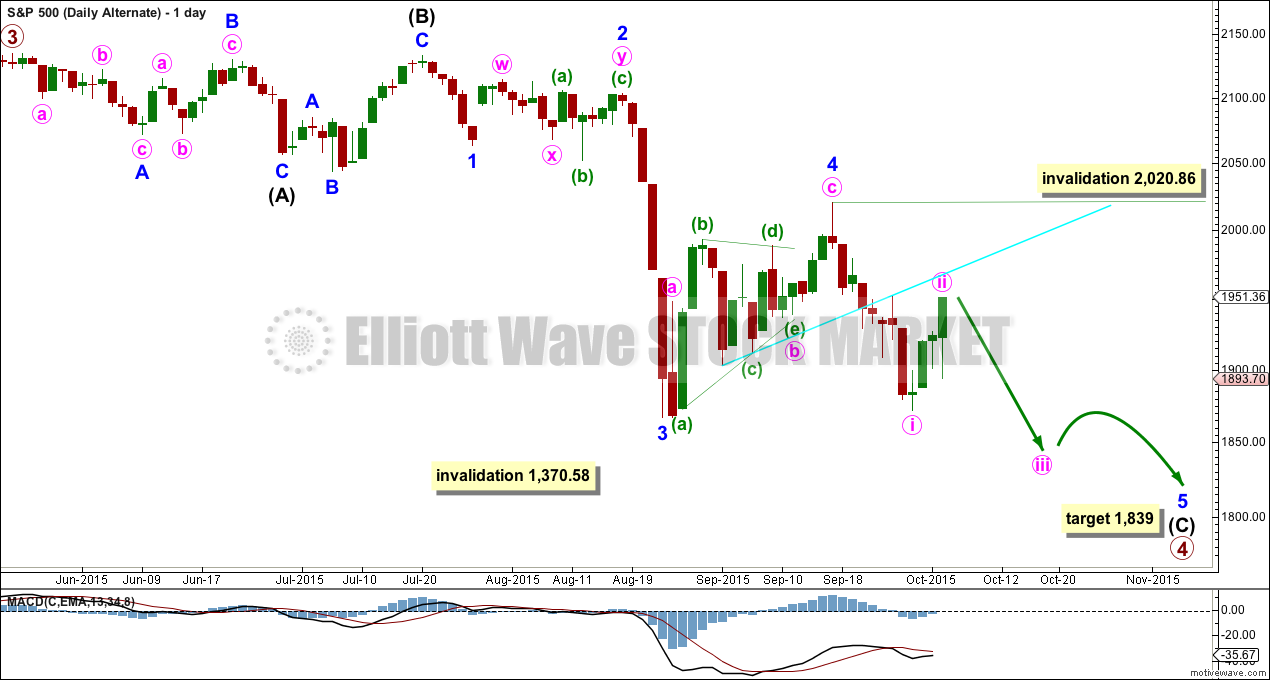
Here the subdivisions of the waves are seen in exactly the same way as the main wave count, except the degree of labelling within the last wave down and the following Dead Cat Bounce are all moved up one degree.
Minor wave 2 was a deep 0.58 double combination and minor wave 4 was a deep 0.65 zigzag. There is little alternation in depth but adequate alternation in structure. Minor wave 2 lasted 15 days and minor wave 4 lasted 17 days. There is good proportion which gives the wave count the right look.
At 1,839 minor wave 5 would reach 2.618 the length of minor wave 1.
The subdivisions on the hourly chart are exactly the same only moved up one degree. The short term outlook is exactly the same.
The difference is in the expected momentum. If the next wave down does not exhibit an increase in momentum, then this would be a reasonable explanation.
Sometimes for the S&P its fifth waves show a small increase in momentum. This idea will only be discarded if the next wave down shows a strong increase in momentum.
It is most common for third waves to be extended for the S&P. When its third waves extend they show their subdivisions clearly on the daily chart. Here the third wave does not show its subdivisions, but the current fifth wave does. This looks opposite to how I would expect these waves to unfold, and at this point this is my main objection to this alternate wave count. However, it is entirely viable. Momentum may tell us which wave count is correct.
SECOND ALTERNATE BULL ELLIOTT WAVE COUNT
DAILY CHART
Click chart to enlarge.
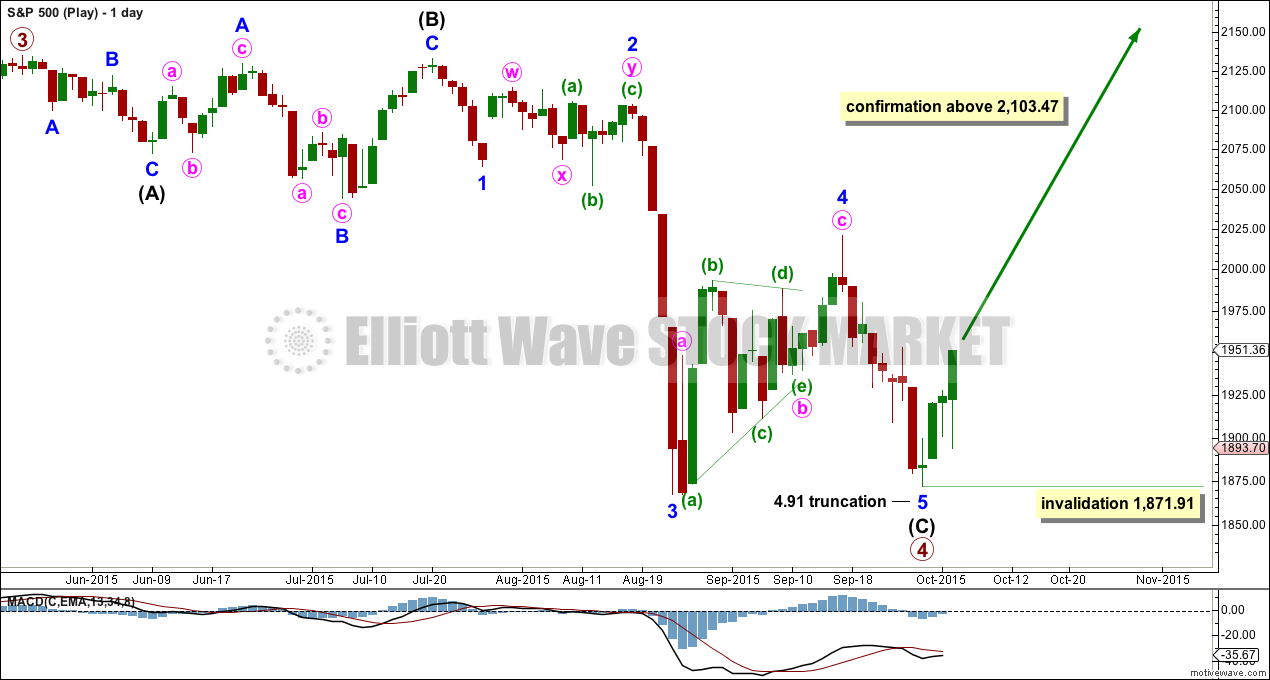
This idea is the same as the first alternate except the degree of labelling within the final fifth wave is moved up one degree. Minor wave 5 can be seen as a complete five wave impulse and is only 4.91 truncated. The truncation comes after a third wave which moved “too far too fast”.
This idea absolutely still requires confirmation before I would have any confidence at all in it. A new high above 2,103.47 is required. That would eliminate the possibility that the Dead Cat Bounce is a second wave which may be continuing. It may not move beyond the start of its first wave at 2,103.47.
There is too much regular technical analysis at the monthly chart level which indicates a continuing bear market for this very bullish wave count to be taken seriously at this stage (see S&P historical analysis for this). In July a bull market trend line was breached by a close more than 3% of market value below that line. The bull market trend line had held since November 2011, was repeatedly tested and reasonably shallow, so it was highly technically significant. And so at this stage, I will assume the S&P remains in a bear market until proven otherwise. Any bull wave count will be presented with this caveat.
To the downside, a new low below 1,871.91 would invalidate this idea.
BEAR ELLIOTT WAVE COUNT
DAILY CHART
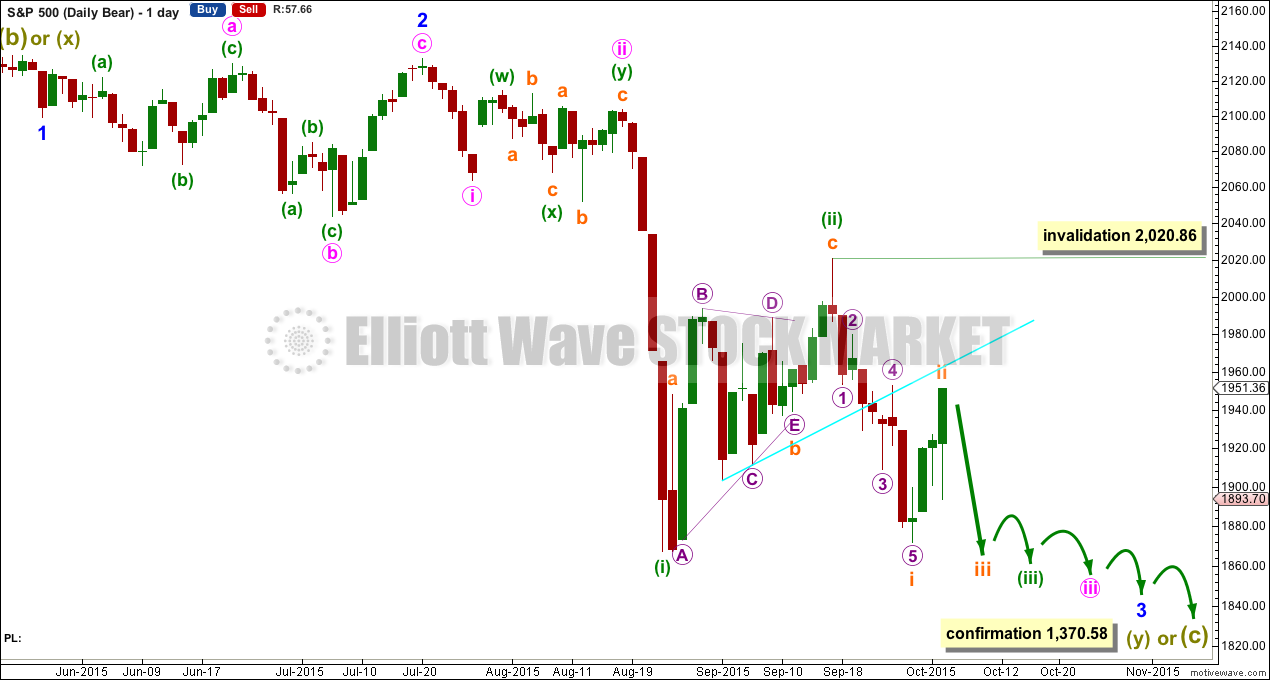
Click chart to enlarge.
A big impulse down must begin, for this bear wave count, so a series of overlapping first and second waves should now be complete. The idea for the bull wave count (a flat correction unfolding downwards) does not work for this bear wave count.
A new low below 1,370.58 would invalidate the bull wave count confirming a huge market crash. Before that price point is passed though, structure should be a strong indication that this bear wave count would be correct. It is supported by regular technical analysis at the monthly chart level.
TECHNICAL ANALYSIS
DAILY CHART
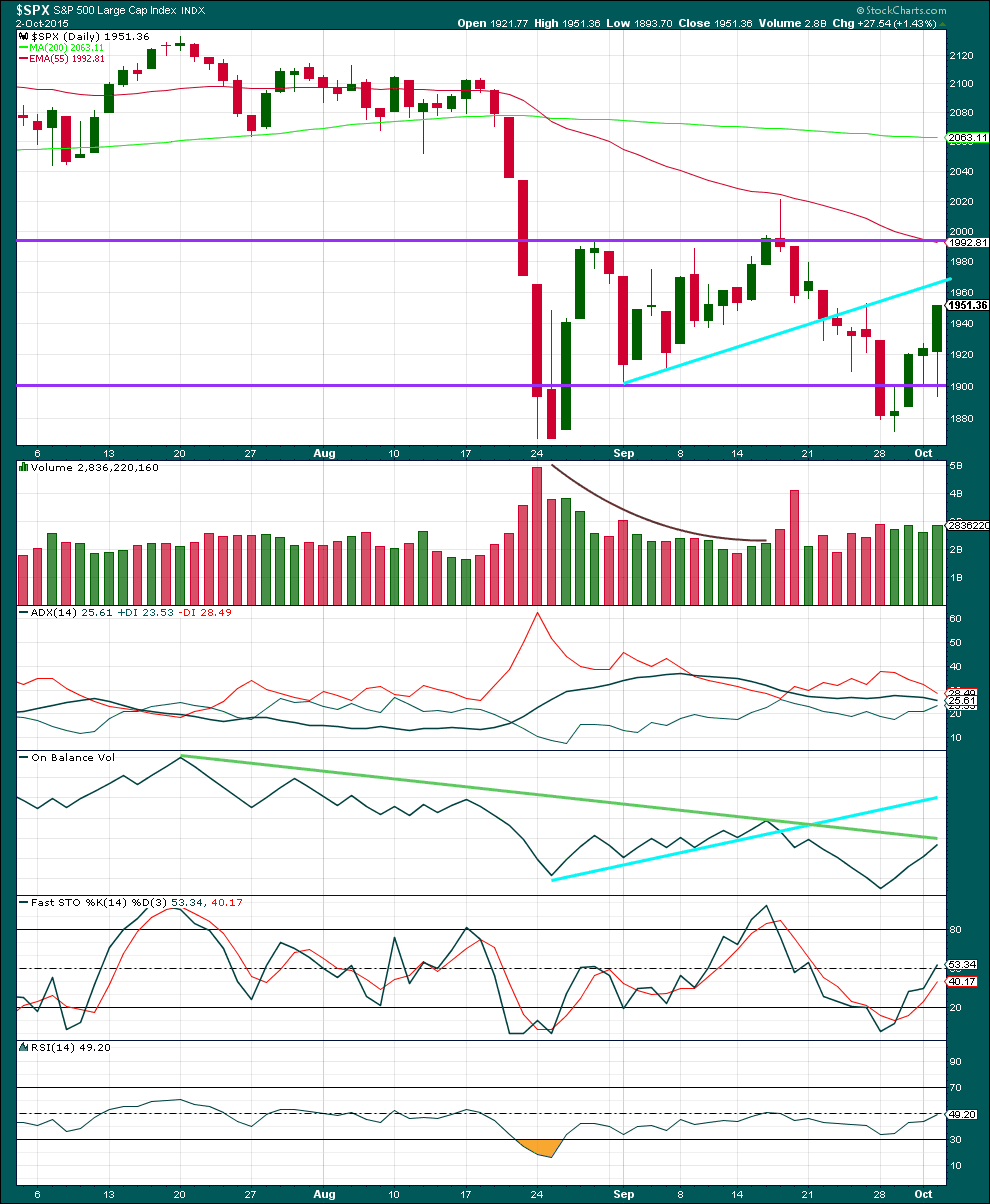
Click chart to enlarge. Chart courtesy of StockCharts.com.
Daily: Volume for Friday was higher than Thursday, but slightly lower than Wednesday, and all four days of green candlesticks come on lighter volume than the prior downwards day. The rise in price is not supported by volume and is suspicious.
The morning doji star candlestick pattern at the end of the last low came after a downwards trend lasting seven days. This has now been followed by three upwards days which may be enough to fulfill the prediction of the candlestick pattern.
Each time price falls volume rises, and each time price rises or drifts sideways volume has been declining. The volume profile is bearish. There is little ambiguity.
The black ADX line has flattened off indicating the market is not trending.
If price moves higher, it may stop when OBV comes up to touch the downwards sloping green trend line. This line is almost touched by OBV suggesting that any further upwards movement when markets open on Monday may be short lived. However, this trend line has only been tested once and not very technically significant.
If price gets up that high, then it should find resistance again at the upwards sloping bright aqua blue trend line on the price chart.
Kaufman’s Moving Average has provided resistance to upwards movement.
RSI is neither overbought or oversold. There is room for the market to fall or rise.
A note on Dow Theory: for the bear wave count I would wait for Dow Theory to confirm a huge market crash. So far the industrials and the transportation indices have made new major swing lows, but the S&P500 and Nasdaq have not.
S&P500: 1,820.66
Nasdaq: 4,116.60
DJT: 7,700.49 – this price point was breached.
DJIA: 15,855.12 – this price point was breached.
This analysis is published about 03:28 a.m. EST.
Today again moves price higher on lighter volume.
Consistently these rises in price, although higher then I am expecting, keep coming on declining volume. They’re not supported, its suspicious.
Another deep second wave correction, now finding resistance at the upper horizontal trend line.
The wave count will expect a third wave down from here. The breakout should (hopefully!) come this week.
But again, at the end of this session there is zero downwards movement. This correction could continue higher. The risk is up to 2,020.86. As vernecarty states, it may provide a good risk / reward opportunity with the invalidation point this close now. The risk that price may rise to 2,020.86 must be accepted for tomorrow.
Although I now have a very bullish wave count I still don’t have confidence in it. Price must tell us that idea is correct before I’ll take it seriously, especially as the rise in price is not supported by volume.
I think we could go up to the [2,020 – 2,050] range and top the B wave of this correction (B wave is a zig-zag. or combination depending on how you prefer) before plunging in wave C starting mid month. Lows likely in the 1,700s to finish up this P4 wave.
Contingency short S&P 500 trade triggered @1989.15
DOW bumping up against upper B band. S&P should continue moving a bit higher to do the same. Second wave doing exactly what it should. Lots of bloggers arguing that long lower wick reversal last week confirming the bull being alive and well…
Where do we go from here? UVXY back up to a spike at 90 ?
If we are about to see a third wave down UVXY is going to blow right past 90. Option prices three months out again ridiculously mispriced considering all the red flags in this market….backwardation continues
Looks like price rising to confluence of upper B band and 50 day SMA and should meet stiff resistance. I expect a spike above upper B band to shake out persistent bears. Fired off contingency order to short above 1989. B bands also showing compression.
The upwards rally does seem to be running out of steam just below 1989.
Getting ready to do a bit of shorting myself as I’m fed up with this relentless re-bound. Probably best to wait until the lower trend line of this rise is clearly breached though…….rather than to guess a top.
Stop set at 2020.9 per Lara’s invalidation point. Very good risk to reward ratio and I don’t think we are going that high.
Lara,
If Primary Wave 4 has ended with a slight truncation, do you have a target for Primary Wave 5 and possible time frame?
Thanks,
Peter
will add to todays analysis