
Downwards movement was expected, but did not happen.
Summary: Downwards movement should continue to new lows this week. If this downwards wave shows a clear strong increase in momentum beyond the last big wave down, then it would be a third wave. If it does not show a clear strong increase in momentum, then it would most likely be a fifth wave. Tomorrow may begin with a little upwards movement to 1,930 – 1,932. Thereafter, downwards movement should show some increase in momentum.
To see an outline of the bigger picture on monthly and weekly charts click here.
Changes to last analysis are bold.
BULL ELLIOTT WAVE COUNT
DAILY CHART
Click chart to enlarge.
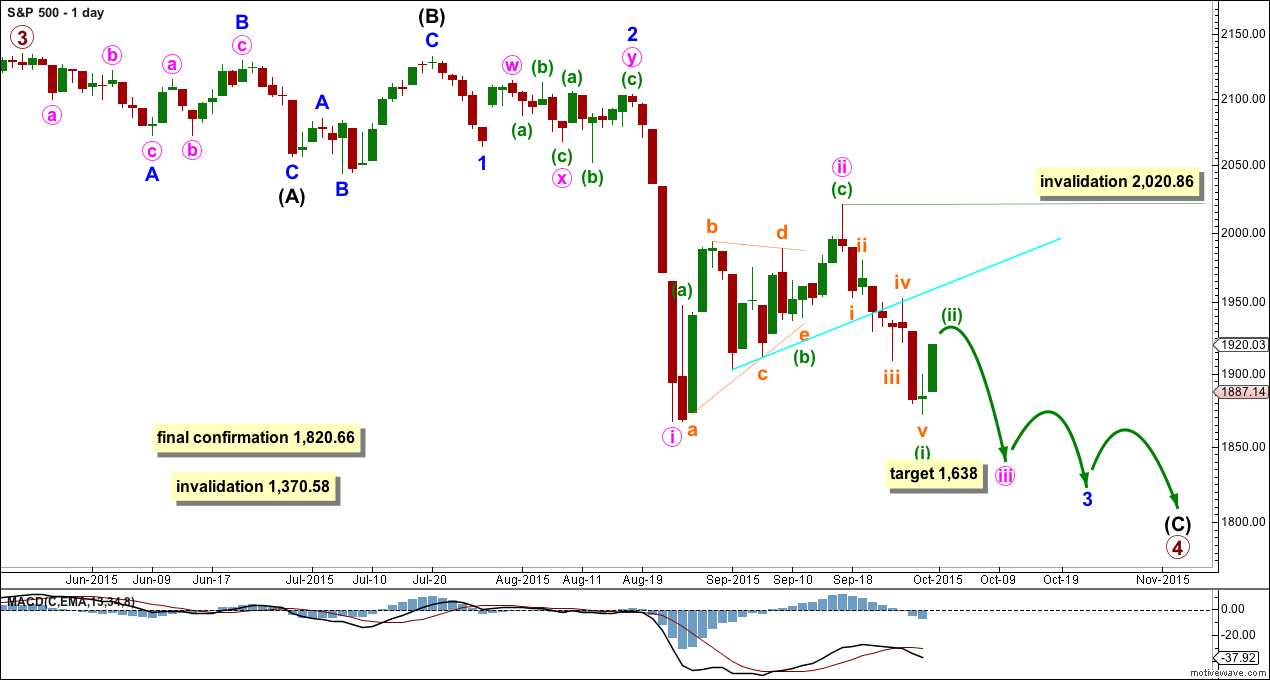
Primary wave 4 may be longer lasting than primary wave 2 as these types of sideways corrective structures tend to be more time consuming than zigzags. Primary wave 4 may complete in a total Fibonacci 21 weeks. Primary wave 4 is within its 19th week, but it may not exhibit a Fibonacci duration because the S&P does not reliably do this. Time estimates may only be taken as a very rough guide.
Within primary wave 4, it may be that intermediate waves (A) and (B) are both complete as three wave structures indicating a flat may be unfolding. Intermediate wave (C) down must be a five wave structure; it looks like it is unfolding as an impulse. For now I will leave this degree as is, but depending on where intermediate wave (C) ends I may move it back down one degree. It is also possible that only minor wave A may be unfolding as a flat correction.
At the daily chart level, this wave count sees primary wave 4 as a possible regular flat correction: intermediate wave (B) is a 98% correction of intermediate wave (A). However, regular flats normally have C waves which are close to equality with their A waves, and they normally fit nicely within parallel channels. Here intermediate wave (C) is much longer than (A) and will still move lower as its structure is incomplete. When the five wave impulse down for intermediate wave (C) is complete, then I will revisit the structure of primary wave 4 which may not be a flat. The structure at the daily chart level so far fits for the very bearish wave count better than this wave count.
If this impulse does not bring price down to the lower edge of the big channel on the weekly chart, then it may only be intermediate wave (A) of a bigger flat for primary wave 4.
Full and final confirmation of a bear market (mid term) would come with:
1. A clear five down on the daily chart.
2. A new low below 1,820.66.
As each condition is met further confidence may be had in the bigger picture for this wave count.
Primary wave 4 may not move into primary wave 1 price territory below 1,370.58. Invalidation of this bull wave count (still bullish at cycle degree) would be confirmation of the bear wave count.
Within the next wave down, whether it be a third wave or a fifth wave (as per the alternate daily wave count), no second wave correction may move beyond its start above 2,020.86.
The Dead Cat Bounce which may have ended ten trading days ago still looks more like a second wave than a fourth wave. It is most common for the S&P to show the subdivisions of its third waves clearly on the daily chart when they extend, and so this current downwards movement looks like a typical third wave so far.
At 1,638 minute wave iii would reach 1.618 the length of minute wave i.
Every day I look at the structure from the all time high on this daily chart to see if I can see a complete corrective structure for primary wave 4. Today it is not possible that it is over because the current downwards wave is incomplete.
HOURLY CHART
Click chart to enlarge.
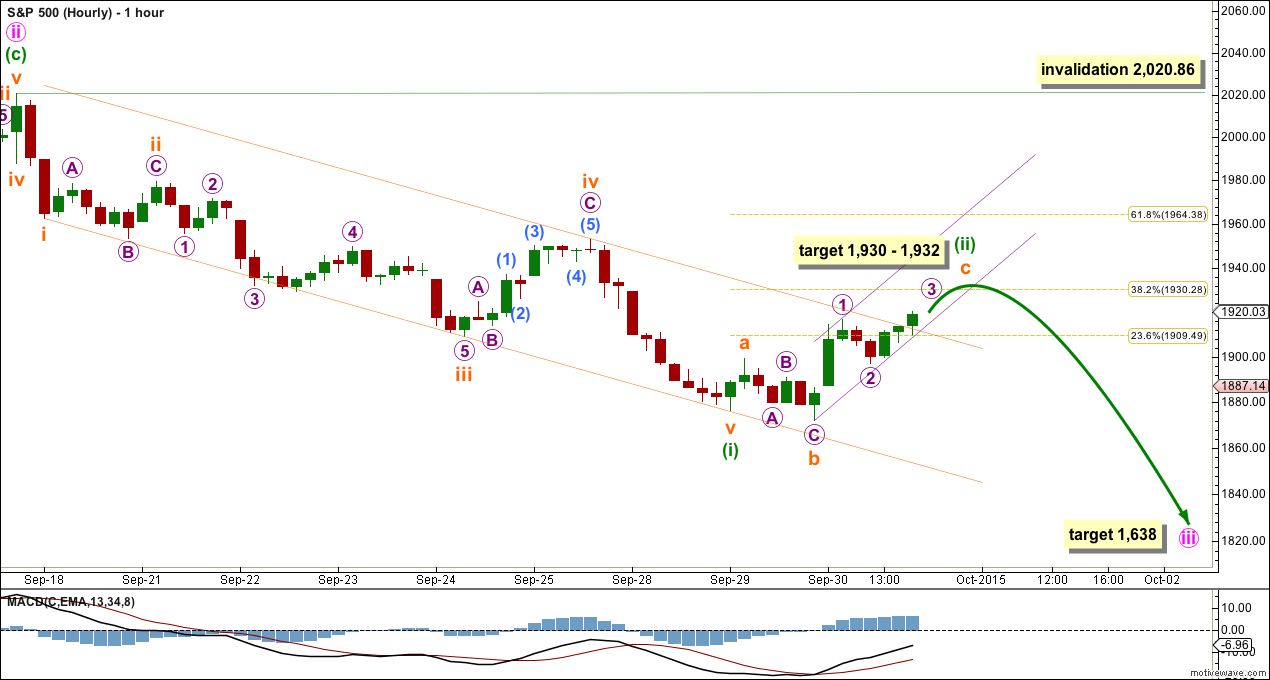
This hourly chart will suffice today for both the main wave count and the alternate below. For the alternate everything is just moved up one degree.
With price moving higher today for a strong upwards day on the daily chart, the prior wave down now looks like a complete five wave impulse, so this upwards movement is most likely a second wave correction.
Ratios within minuette wave (i) are: subminuette wave iii has no Fibonacci ratio to subminuette wave i, and subminuette wave v is 5.83 points longer than equality in length with subminuette wave iii (this variation is less than 10% of the length of subminuette wave v, so I consider it acceptable).
Minuette wave (i) fits nicely within a best fit channel, drawn as shown. The channel is not yet breached. If it is breached when markets open tomorrow, then I would have more confidence in the target for minuette wave ii to end.
Minuette wave (ii) is unfolding as an expanded flat correction. Subminuette wave b is 1.19 the length of subminuette wave a, which is within the normal range of 1 to 1.38. At 1,932 subminuette wave c would reach 2.618 the length of subminuette wave a. This is close to the 0.382 Fibonacci ratio of minuette wave (i) at 1,930.
The biggest reason for expecting a little more upwards movement when markets open tomorrow is the structure of subminuette wave c. This should be a five wave structure, but it is incomplete.
Minuette wave (ii) may not move beyond the start of minuette wave (i) above 2,020.86.
When minuette wave (ii) is complete then this wave count expects a third wave down to begin at three wave degrees. The S&P very often exhibits swift strong extended third waves. The middle of this one is approaching fast. Expect any surprises from here to be to the downside.
ALTERNATE BULL ELLIOTT WAVE COUNT
DAILY CHART
Click chart to enlarge.
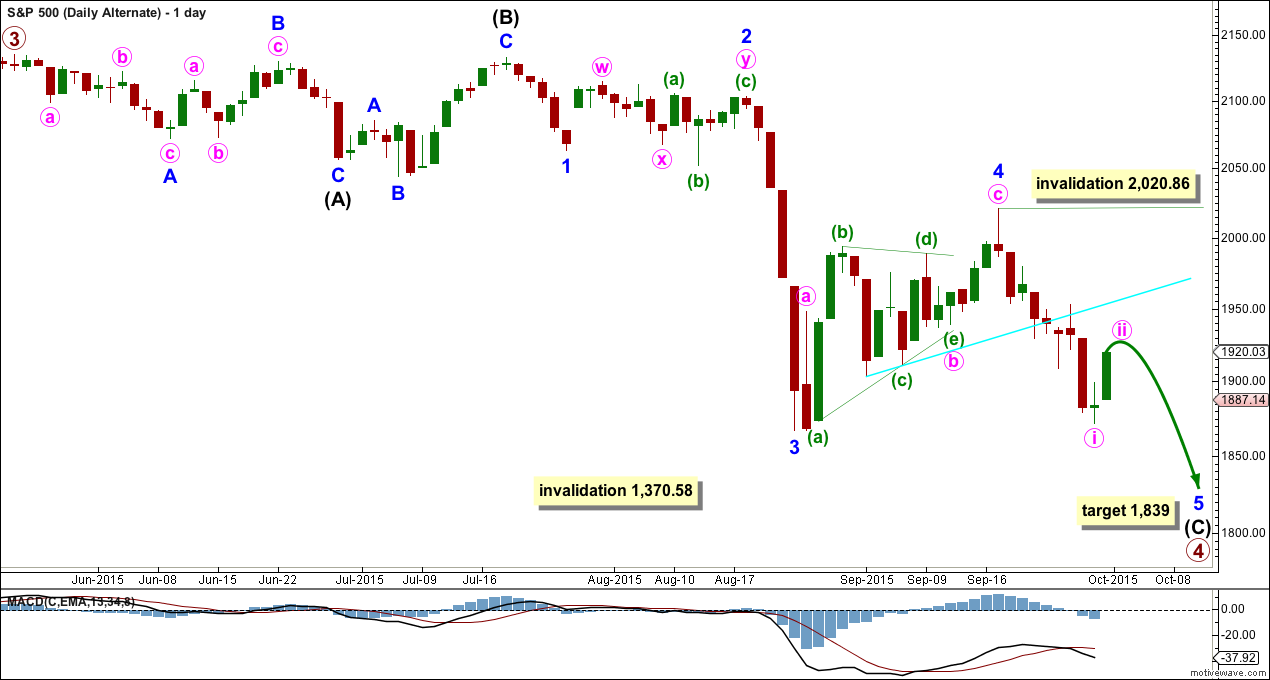
Here the subdivisions of the waves are seen in exactly the same way as the main wave count, except the degree of labelling within the last wave down and the following Dead Cat Bounce are all moved up one degree.
Minor wave 2 was a deep 0.58 double combination and minor wave 4 was a deep 0.65 zigzag. There is little alternation in depth but adequate alternation in structure. Minor wave 2 lasted 15 days and minor wave 4 lasted 17 days. There is good proportion which gives the wave count the right look.
If the next wave down does not exhibit a strong increase in momentum, then this would be a good explanation.
At 1,839 minor wave 5 would reach 2.618 the length of minor wave 1.
The subdivisions on the hourly chart are exactly the same only moved up one degree. The short term outlook is exactly the same.
The difference is in the expected momentum. If the next wave down does not exhibit an increase in momentum, then this would be a reasonable explanation.
Sometimes for the S&P its fifth waves show a small increase in momentum. This idea will only be discarded if the next wave down shows a strong increase in momentum.
It is most common for third waves to be extended for the S&P. When its third waves extend they show their subdivisions clearly on the daily chart. Here the third wave does not show its subdivisions, but the current fifth wave does. This looks opposite to how I would expect these waves to unfold, and at this point this is my main objection to this alternate wave count. However, it is entirely viable. Momentum may tell us which wave count is correct.
BEAR ELLIOTT WAVE COUNT
DAILY CHART
Click chart to enlarge.
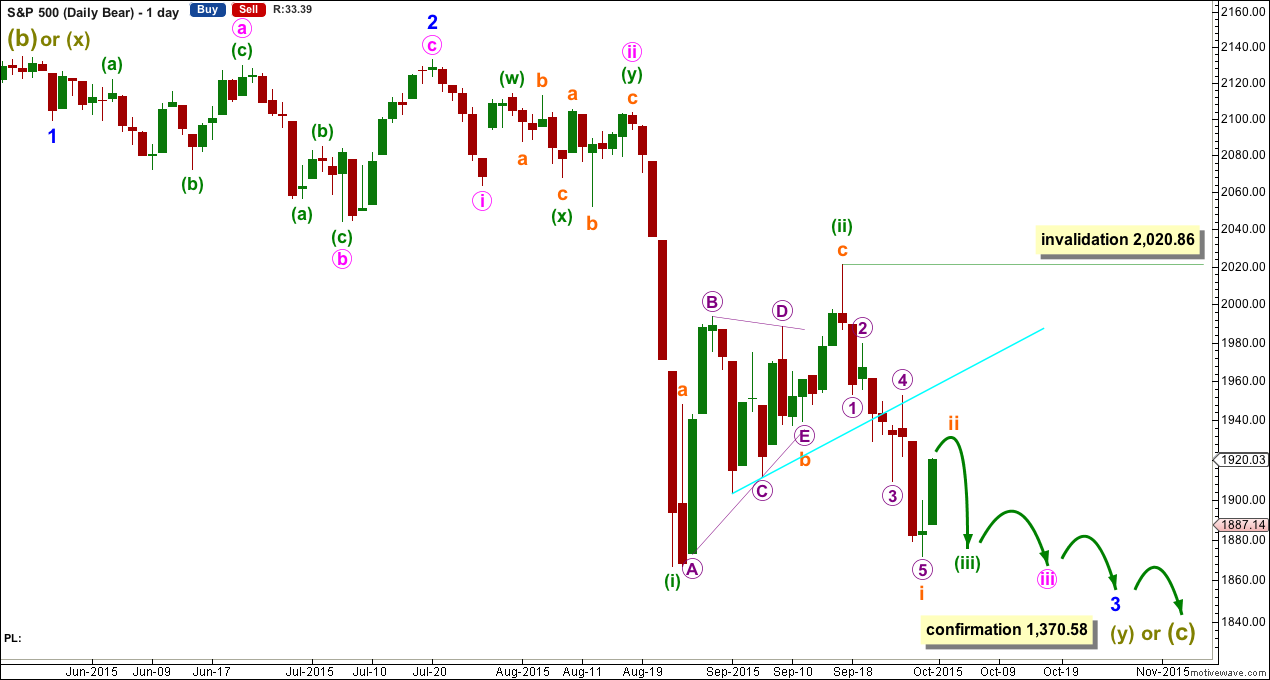
A big impulse down must begin, for this bear wave count, so a series of overlapping first and second waves should now be complete. The idea for the bull wave count (a flat correction unfolding downwards) does not work for this bear wave count.
A new low below 1,370.58 would invalidate the bull wave count confirming a huge market crash. Before that price point is passed though, structure should be a strong indication that this bear wave count would be correct. It is supported by regular technical analysis at the monthly chart level.
TECHNICAL ANALYSIS
DAILY CHART
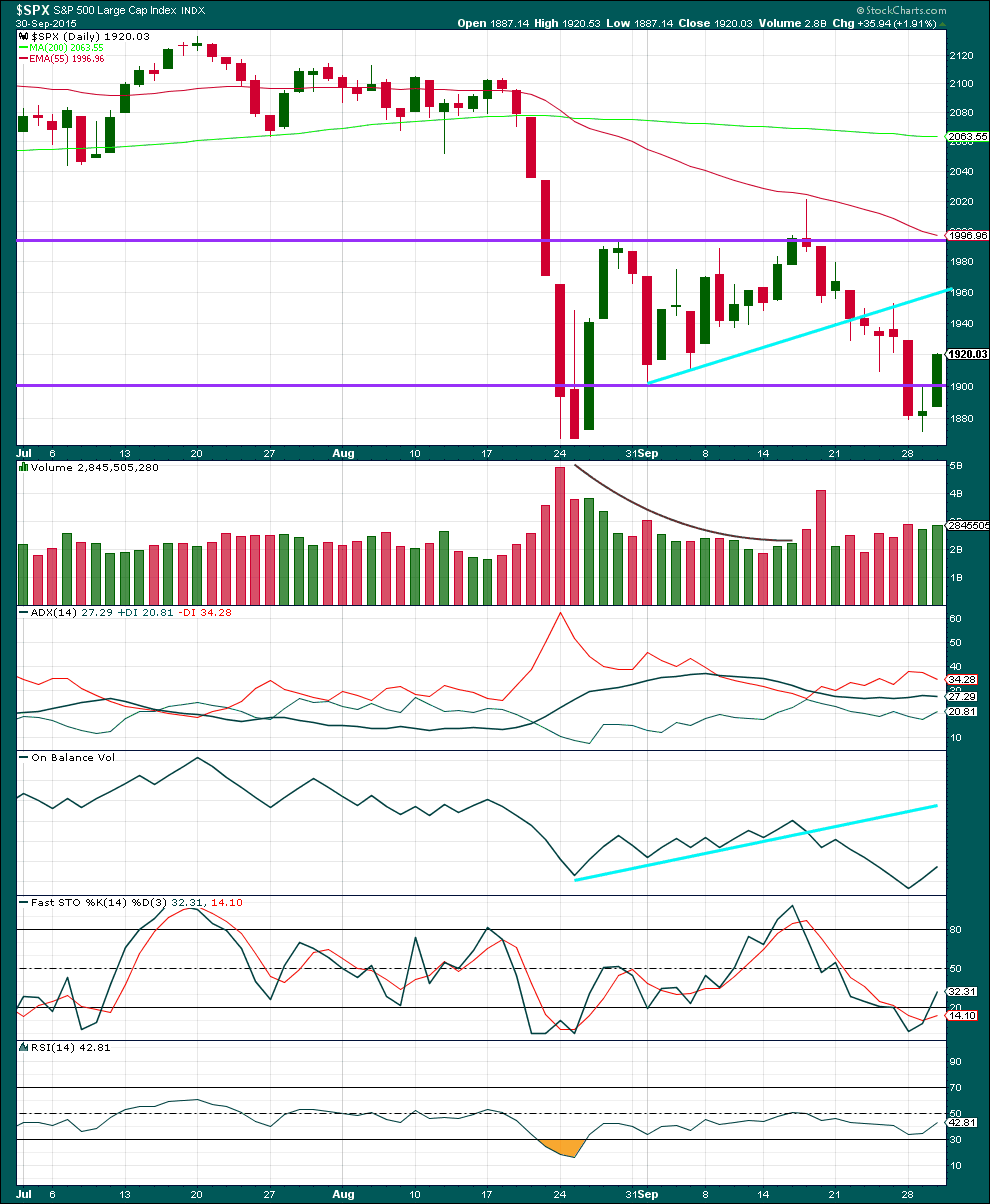
Click chart to enlarge. Chart courtesy of StockCharts.com.
Daily: A very slight rise in volume provides a little support for the rise in price today. However, it remains lower than a downwards day two days ago.
Today completes a morning doji star candlestick pattern. Coming after a downwards trend lasting seven days, this would indicate a trend change, a low in place, and further upwards movement. Today this is the most bullish indicator I have seen for some time. But this candlestick pattern does not always work.
Each time price falls volume rises, and each time price rises or drifts sideways volume has been declining or as in the case today increasing only very slightly. The volume profile is bearish. There is little ambiguity.
The black ADX line has flattened off today indicating the market is not trending. I would expect it to begin to rise again and indicate a downwards trend when we see the next downwards day, maybe tomorrow.
Kaufman’s Moving Average has provided resistance to upwards movement.
On Balance Volume moves lower, and continues to agree with the downwards move in price.
RSI is neither overbought or oversold. There is room for the market to fall or rise.
A note on Dow Theory: for the bear wave count I would wait for Dow Theory to confirm a huge market crash. So far the industrials and the transportation indices have made new major swing lows, but the S&P500 and Nasdaq have not.
S&P500: 1,820.66
Nasdaq: 4,116.60
DJT: 7,700.49 – this price point was breached.
DJIA: 15,855.12 – this price point was breached.
This analysis is published about 08:55 p.m. EST.
I’m really sorry everybody. My code was not updated.
It’s fixed now. The hourly chart is now correct.
yes re my last comment, you have not used the same chart but just not updated the price bars as others have said.
Hi Lara,
I think that you have used the same Daily chart for the preferred bear count two days in a row?
It does look like sub-minuette 5 ended on Tuesday with the new low and green candlestick. Very interesting that sub-minuette five down sported a 300 point down day while sub-minuette three never displayed that kind of strong decline on any of its down days. Could be a hint about future wave developments as the market is always changing to keep traders off balance. The second wave will probably approach the aqua blue line where sub-minuette four also found resistance. So, no third wave this week after all. In hind sight, Tuesday’s green candlestick should have been a clue. Live and learn….
I’m thinking that subminuette wave © to complete the expanding flat correction of minuette (ii) might be un-folding as an ending contracting triangle.
I do hope so………because it would mean i’m actually learning something from Lara 🙂
Also……If it is an ending contracting triangle that is un-folding, because the 3rd wave is shorter than the first, it limits the 5th wave to around the 1930 area which was the 0.382 target Lara mentioned in her last post.
I’m a bit more confident now.
Hmmm………Just noticed that wave 4 is longer than wave 2 and so it can’t be contracting even if it was an ending diagonal.
Back to learning !
Well done. You’re correct, the diagonal doesn’t meet the rules for either a contracting or expanding variety.
I’m going to have to consider other structural possibilities for minuette (ii).
So Vern you think we’re done for the down move for now and that wave 5 was truncated?
I thought we were in wave 5 a while ago because of the reluctant move down from the start, but I did expect the August low to be taken out as did Lara. Where is wave 5 of 5 that you say ended Tuesday?
Thanks!
I was assuming sub-minuette five of minuette one with minuette two up now underway. Lara’s count is one degree higher and gives the waves a better proportional look…
The hourly chart does not show the price bars. Can you amend?
Actually I think its more accurate to say its an old hrly chart … that needs to be brought up to date. It does not show all the bars.
I agree. This is an old chart by mistake…