
Downwards movement is unfolding so far exactly as expected.
Summary: Downwards movement should continue to new lows this week. If this downwards wave shows a clear strong increase in momentum beyond the last big wave down, then it would be a third wave. If it does not show a clear strong increase in momentum, then it would most likely be a fifth wave.
To see an outline of the bigger picture on monthly and weekly charts click here.
Changes to last analysis are bold.
BULL ELLIOTT WAVE COUNT
DAILY CHART
Click chart to enlarge.
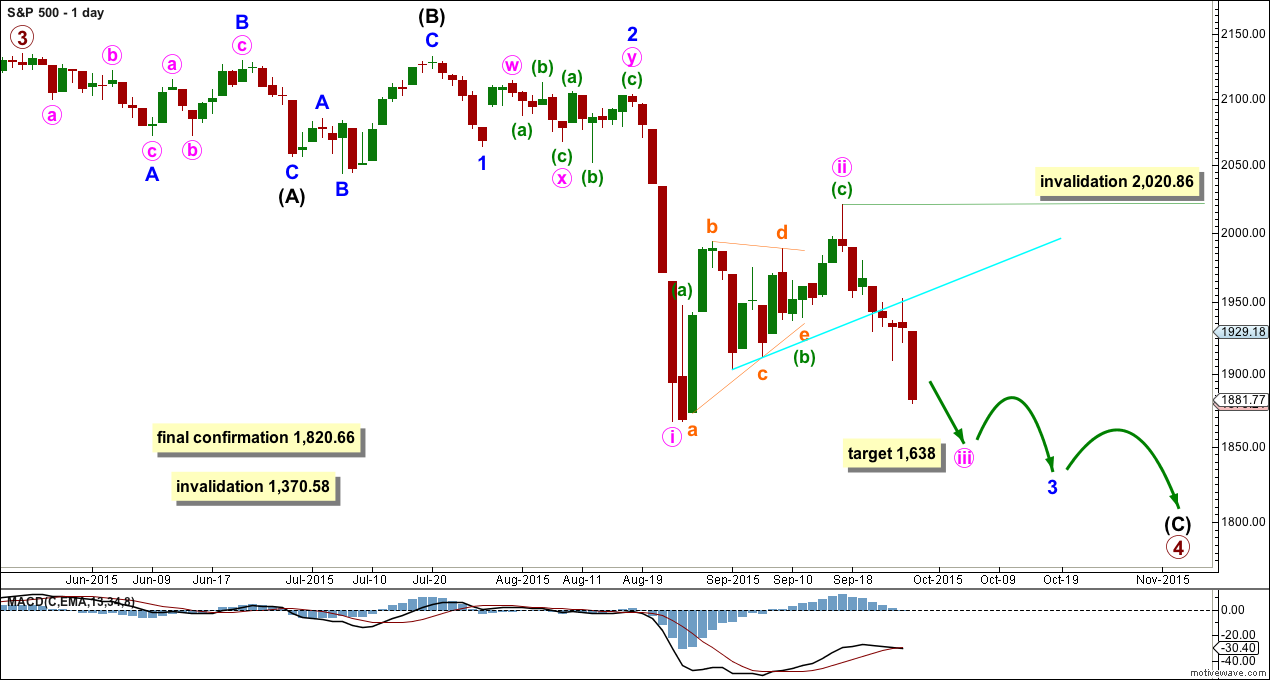
Primary wave 4 may be longer lasting than primary wave 2 as these types of sideways corrective structures tend to be more time consuming than zigzags. Primary wave 4 may complete in a total Fibonacci 21 weeks. Primary wave 4 has begun its 19th week, but it may not exhibit a Fibonacci duration because the S&P does not reliably do this. Time estimates may only be taken as a very rough guide.
Within primary wave 4, it may be that intermediate waves (A) and (B) are both complete as three wave structures indicating a flat may be unfolding. Intermediate wave (C) down must be a five wave structure; it looks like it is unfolding as an impulse. For now I will leave this degree as is, but depending on where intermediate wave (C) ends I may move it back down one degree. It is also possible that only minor wave A may be unfolding as a flat correction.
At the daily chart level, this wave count sees primary wave 4 as a possible regular flat correction: intermediate wave (B) is a 98% correction of intermediate wave (A). However, regular flats normally have C waves which are close to equality with their A waves, and they normally fit nicely within parallel channels. Here intermediate wave (C) is much longer than (A) and will still move lower as its structure is incomplete. When the five wave impulse down for intermediate wave (C) is complete, then I will revisit the structure of primary wave 4 which may not be a flat. The structure at the daily chart level so far fits for the very bearish wave count better than this wave count.
If this impulse does not bring price down to the lower edge of the big channel on the weekly chart, then it may only be intermediate wave (A) of a bigger flat for primary wave 4.
Full and final confirmation of a bear market (mid term) would come with:
1. A clear five down on the daily chart.
2. A new low below 1,820.66.
As each condition is met further confidence may be had in the bigger picture for this wave count.
Primary wave 4 may not move into primary wave 1 price territory below 1,370.58. Invalidation of this bull wave count (still bullish at cycle degree) would be confirmation of the bear wave count.
I am drawing the bright aqua blue trend line on all charts in exactly the same way. It is this line which I want to use to confirm the end of this correction and the resumption of the downwards trend. There is now a full daily candlestick below this trend line and not touching it, with a downwards day on slightly higher volume. This is enough to provide some confidence in a downwards breakout, so the invalidation point may now be moved lower.
Within the next wave down, whether it be a third wave or a fifth wave (as per the alternate daily wave count), no second wave correction may move beyond its start above 2,020.86.
The Dead Cat Bounce which may have ended eight trading days ago still looks more like a second wave than a fourth wave.
At 1,638 minute wave iii would reach 1.618 the length of minute wave i.
Every day I look at the structure from the all time high on this daily chart to see if I can see a complete corrective structure for primary wave 4. Today it is not possible that it is over because the current downwards wave is incomplete.
HOURLY CHART
Click chart to enlarge.
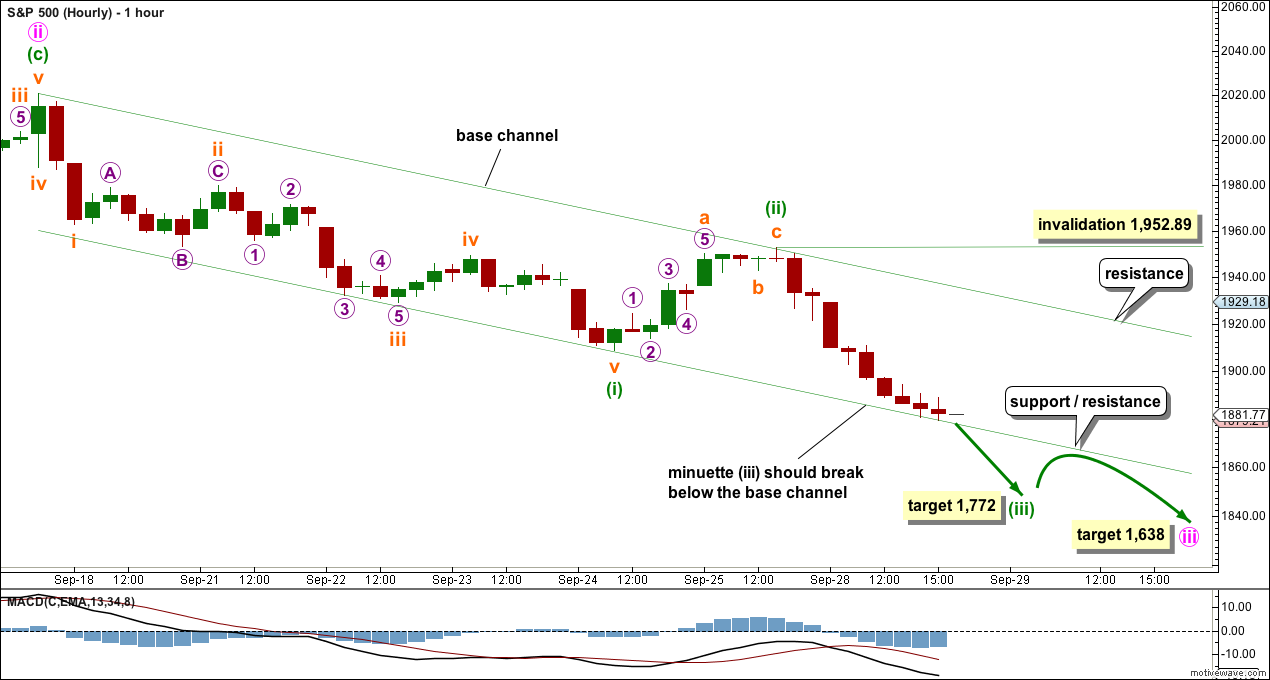
This hourly chart will suffice today for both the main wave count and the alternate below. For the alternate everything is just moved up one degree.
At 1,772 minuette wave (iii) would reach 1.618 the length of minuette wave (i).
Draw a base channel about minuette waves (i) and (ii): draw the first trend line from the start of minuette wave (i) to the end of minuette wave (ii), then place a parallel copy on the end of minuette wave (i). Minuette wave (iii) should have the power to break through support at the lower edge of the base channel. Before it does that though price will find support. When price breaks below that trend line it should provide resistance.
Along the way down, while price is still within the channel, upwards corrections should find resistance at the upper edge of the channel.
No second wave correction may move beyond its start above 1,952.89 within minuette wave (iii).
Minuette wave (iii) should be a sheer drop downwards at this point. The next interruption to the trend should not come until minuette wave (iii) is complete.
ALTERNATE BULL ELLIOTT WAVE COUNT
DAILY CHART
Click chart to enlarge.
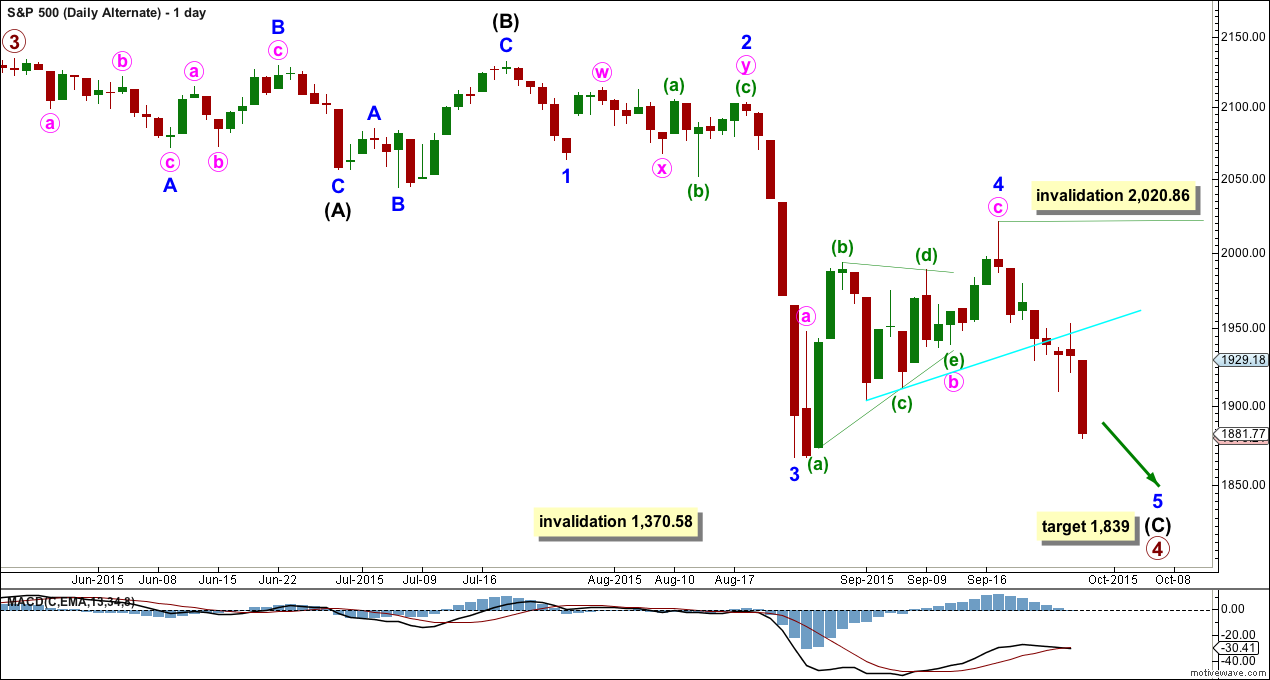
Here the subdivisions of the waves are seen in exactly the same way as the main wave count, except the degree of labelling within the last wave down and the following Dead Cat Bounce are all moved up one degree.
Minor wave 2 was a deep 0.58 double combination and minor wave 4 was a deep 0.65 zigzag. There is little alternation in depth but adequate alternation in structure. Minor wave 2 lasted 15 days and minor wave 4 lasted 17 days. There is good proportion which gives the wave count the right look.
If the next wave down does not exhibit a strong increase in momentum, then this would be a good explanation.
At 1,839 minor wave 5 would reach 2.618 the length of minor wave 1.
The subdivisions on the hourly chart are exactly the same only moved up one degree. The short term outlook is exactly the same.
The difference is in the expected momentum. If the next wave down does not exhibit an increase in momentum, then this would be a reasonable explanation.
Sometimes for the S&P its fifth waves show a small increase in momentum. This idea will only be discarded if the next wave down shows a strong increase in momentum.
BEAR ELLIOTT WAVE COUNT
DAILY CHART
Click chart to enlarge.
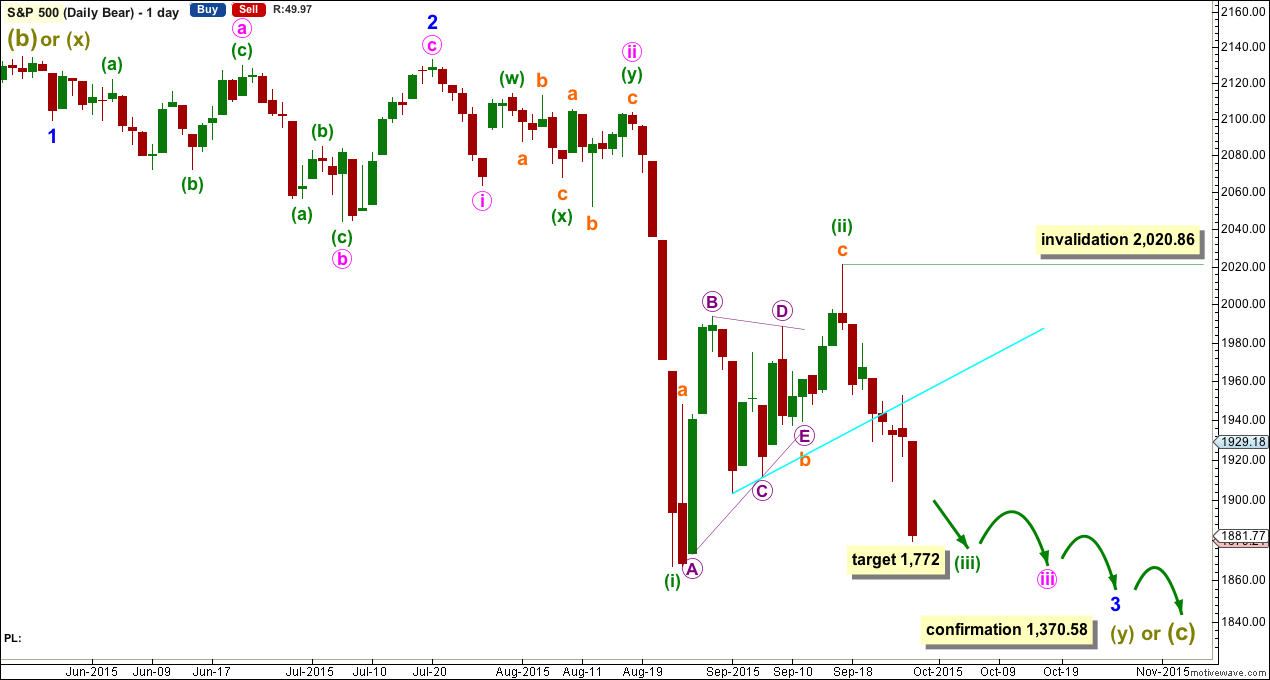
A big impulse down must begin, for this bear wave count, so a series of overlapping first and second waves should now be complete. The idea for the bull wave count (a flat correction unfolding downwards) does not work for this bear wave count.
A new low below 1,370.58 would invalidate the bull wave count confirming a huge market crash. Before that price point is passed though, structure should be a strong indication that this bear wave count would be correct. It is supported by regular technical analysis at the monthly chart level.
TECHNICAL ANALYSIS
DAILY CHART
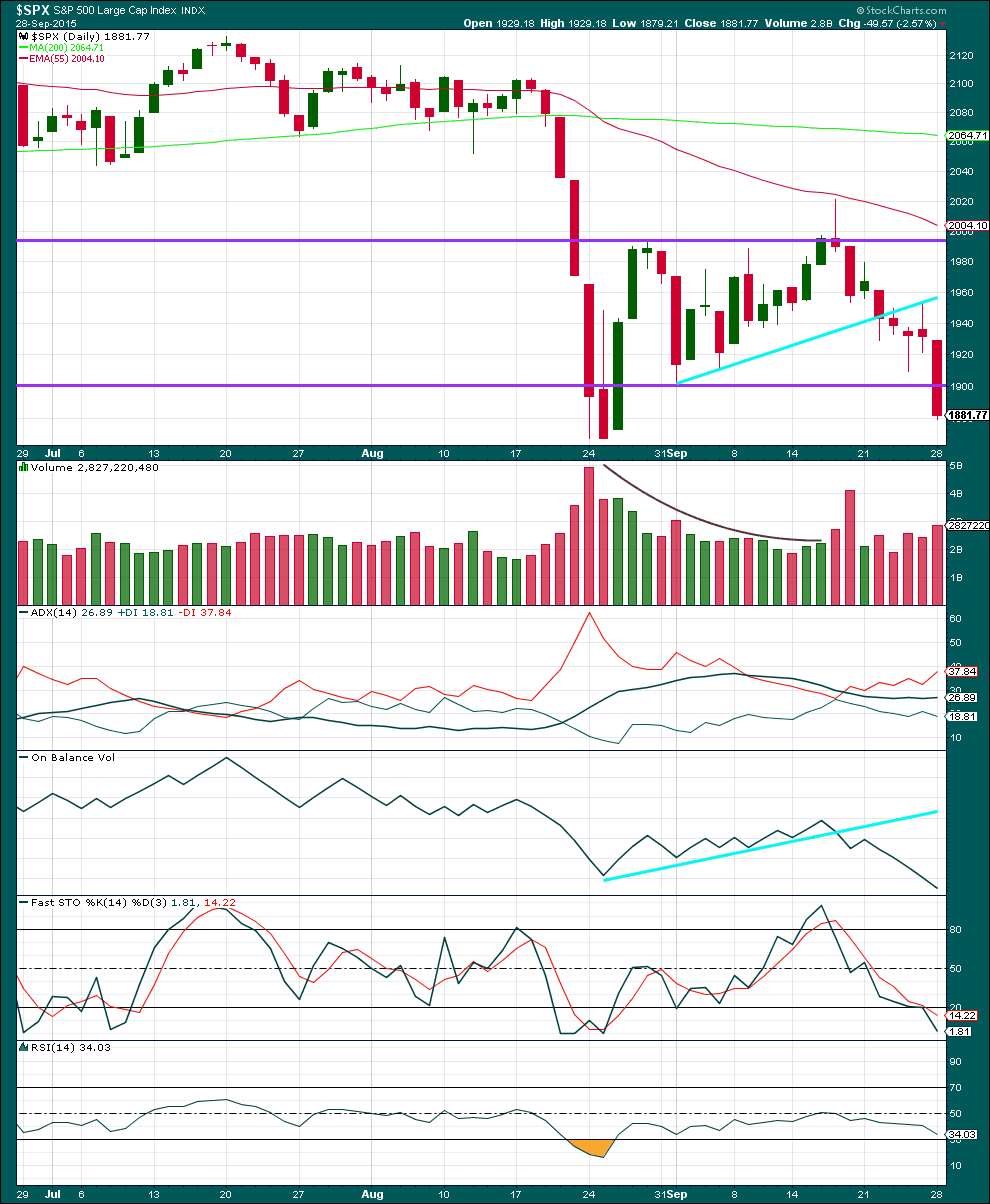
Click chart to enlarge. Chart courtesy of StockCharts.com.
Daily: A strong downwards day with an increase in volume fits the wave count perfectly. Each time price falls volume rises, and each time price rises or drifts sideways volume has been declining. The volume profile is bearish. There is no ambiguity at all.
With a close below the lower horizontal line of support on a day with increased volume, I have confidence today that price will continue to new lows this week. A downwards breakout is underway.
ADX is still mostly flat indicating the market is not trending. However, during this consolidation it is clearly a downwards day which has the strongest volume, so a downwards breakout is indicated as more likely than upwards.
Kaufman’s Moving Average has provided resistance to upwards movement.
On Balance Volume moves lower, and continues to agree with the downwards move in price.
Both Stochastics and RSI are neither overbought or oversold. There is room for the market to fall or rise.
A note on Dow Theory: for the bear wave count I would wait for Dow Theory to confirm a huge market crash. So far the industrials and the transportation indices have made new major swing lows, but the S&P500 and Nasdaq have not.
S&P500: 1,820.66
Nasdaq: 4,116.60
DJT: 7,700.49 – this price point was breached.
DJIA: 15,855.12 – this price point was breached.
This analysis is published about 08:12 p.m. EST.
The banksters seem to think that DOW 16000 is important to market confidence. They persistently bought futures out of deep in the red overnight and are expending an awful lot of firepower to defend that pivot. I think the bears are toying with their efforts…
Lara,
Why do you keep calling the 1st chart in your analysis ” BULL ELLIOTT WAVE COUNT”
when clearly your target of 1638 and all you describe would be a bear ?
Is it because we haven’t passed the 1820 you keep mentioning?
Its a bull wave count because presumably once the 4th wave correction ends, the bull wave count predicts the 5th wave up will likely take out the old highs in the market. The 4th wave down in this scenario is seen as a correction in an up-trend which would start with the 5th wave up once the 4th wave is complete…
The current situation is a great place to be a bear. The market is either crashing (the bear wave count) or its correcting in a big-time way down to S&P 1638 or 1820 (depending on whether we’re in a 3rd wave down or a 5th wave down) before it starts going back up again… its going down either way…
Hope that helps…
Ari has replied perfectly.
At cycle degree the bull count is bullish, this is a fourth wave correction within a cycle wave V.
The bear wave count expects a huge market crash is beginning.
Look at S&P Historical Analysis to see weekly and monthly charts, that will provide a visual explanation. You’ll see this correction is just another multi week correction within a longer term bull market for the bull count, and a huge market crash for the bear.
Hi, what are the re-tracement levels for the current correction? Just looking for a good point to re-enter
I won’t worry about re-tracement levels. Whenever the trend has been established as being down, just short the rallies, and take profits as soon as the materialize. It is very counter-intuitive but really the only way to overcome the elevated premiums in a bear market if you are using options. If not using options, you should be short this market until Lara signals an intermediate trend change. Another option is to just use a 10 – 15 % trailing stop to limit your risk if you are short.
Thankyou. I don’t use options, stop losses in place and looking to ride which ever wave this is down