
Yesterday’s Elliott wave analysis expected for Friday’s session a little upwards movement to end about 1,951.
Price moved higher to start the session, reaching up to 1,952.89, before turning lower to complete a small red candlestick.
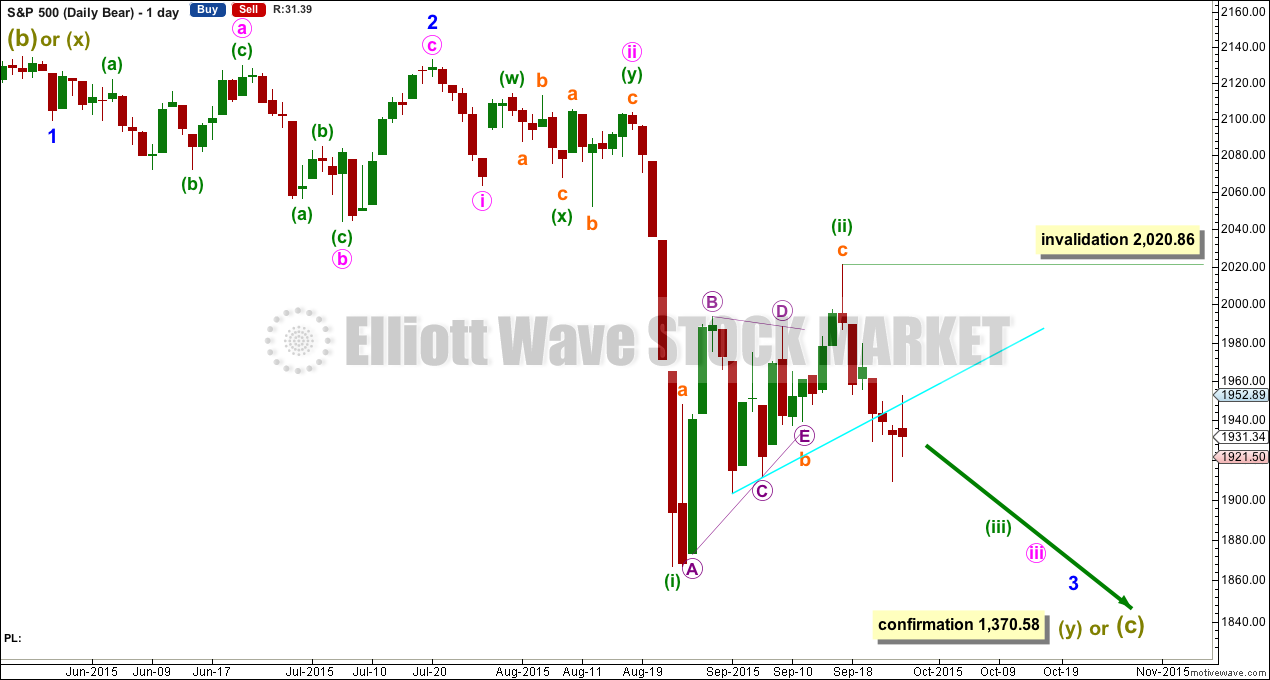
Summary: I expect to see downwards movement next week which should show an increase in downwards momentum. The downwards movement may be the middle of a third wave which may be very strong indeed. If momentum does not show a strong increase, then downwards movement may be a fifth wave.
To see an outline of the bigger picture on monthly and weekly charts click here.
Changes to last analysis are bold.
BULL ELLIOTT WAVE COUNT
DAILY CHART
Click chart to enlarge.
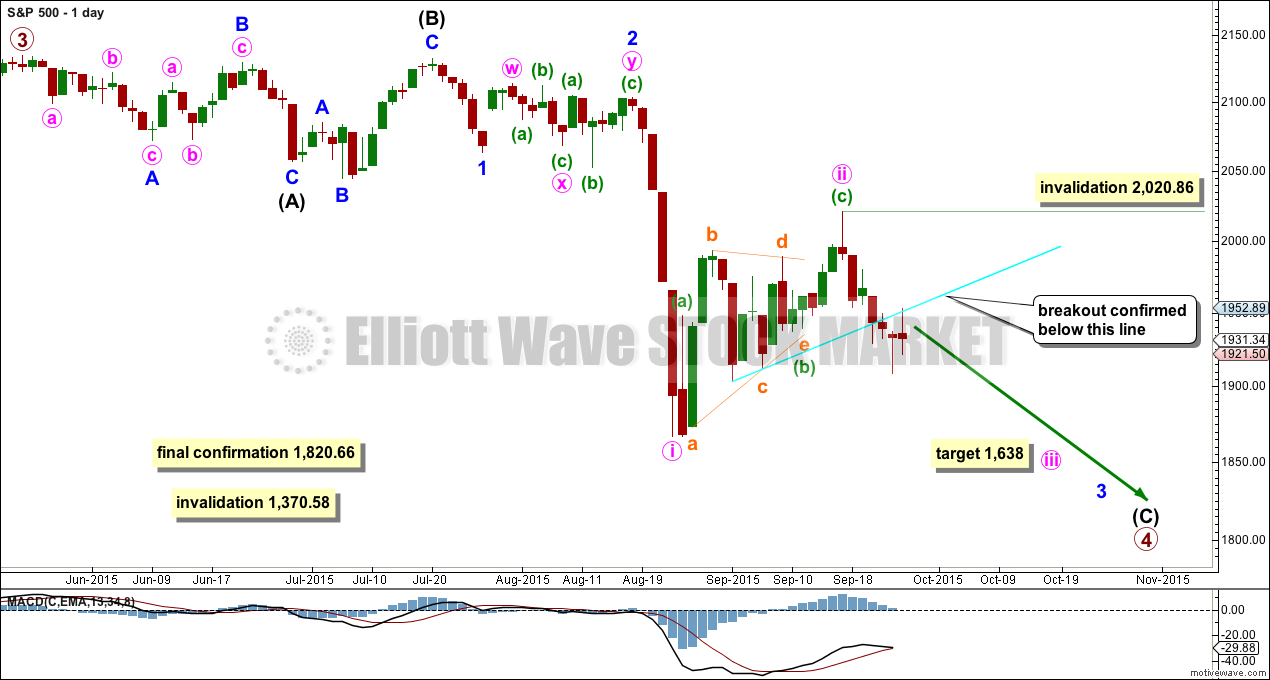
Primary wave 4 may be longer lasting than primary wave 2 as these types of sideways corrective structures tend to be more time consuming than zigzags. Primary wave 4 may complete in a total Fibonacci 21 weeks. Primary wave 4 has completed its 18th week, but it may not exhibit a Fibonacci duration because the S&P does not reliably do this. Time estimates may only be taken as a very rough guide.
Within primary wave 4, it may be that intermediate waves (A) and (B) are both complete as three wave structures indicating a flat may be unfolding. Intermediate wave (C) down must be a five wave structure; it looks like it is unfolding as an impulse. For now I will leave this degree as is, but depending on where intermediate wave (C) ends I may move it back down one degree. It is also possible that only minor wave A may be unfolding as a flat correction.
At the daily chart level, this wave count sees primary wave 4 as a possible regular flat correction: intermediate wave (B) is a 98% correction of intermediate wave (A). However, regular flats normally have C waves which are close to equality with their A waves, and they normally fit nicely within parallel channels. Here intermediate wave (C) is much longer than (A) and will still move lower as its structure is incomplete. When the five wave impulse down for intermediate wave (C) is complete, then I will revisit the structure of primary wave 4 which may not be a flat. The structure at the daily chart level so far fits for the very bearish wave count better than this wave count.
If this impulse does not bring price down to the lower edge of the big channel on the weekly chart, then it may only be intermediate wave (A) of a bigger flat for primary wave 4.
Full and final confirmation of a bear market (mid term) would come with:
1. A clear five down on the daily chart.
2. A new low below 1,820.66.
As each condition is met further confidence may be had in the bigger picture for this wave count.
Primary wave 4 may not move into primary wave 1 price territory below 1,370.58. Invalidation of this bull wave count (still bullish at cycle degree) would be confirmation of the bear wave count.
I am drawing the bright aqua blue trend line on all charts in exactly the same way. It is this line which I want to use to confirm the end of this correction and the resumption of the downwards trend. There is now a full daily candlestick below this trend line and not touching it, with a downwards day on slightly higher volume. This is enough to provide some confidence in a downwards breakout, so the invalidation point may now be moved lower.
Within the next wave down, whether it be a third wave or a fifth wave (as per the alternate daily wave count), no second wave correction may move beyond its start above 2,020.86.
The Dead Cat Bounce which may have ended seven trading days ago still looks more like a second wave than a fourth wave.
At 1,638 minute wave iii would reach 1.618 the length of minute wave i.
Every day I look at the structure from the all time high on this daily chart to see if I can see a complete corrective structure for primary wave 4. Today I can see a possible end to this correction. This is published at the end of this analysis. However, it has an extremely low probability.
HOURLY CHART
Click chart to enlarge.
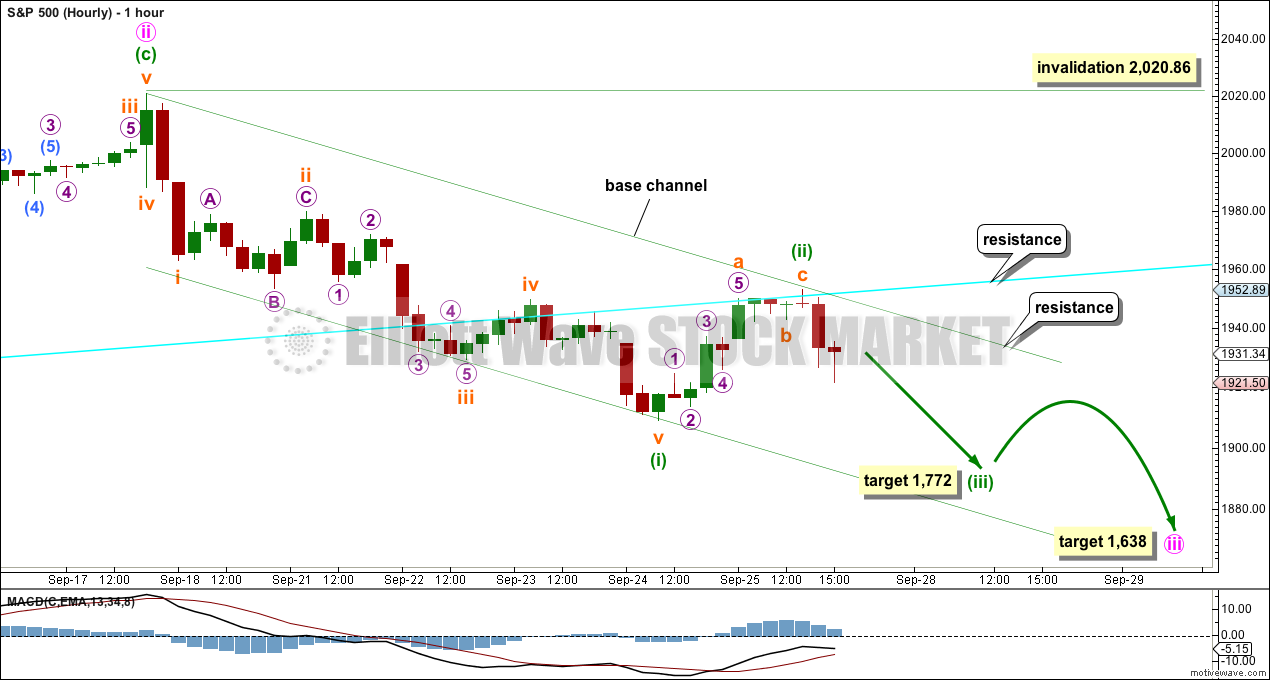
This hourly chart will suffice today for both the main wave count and the alternate below. For the alternate everything is just moved up one degree.
The bright aqua blue trend line previously provided support and is now providing resistance. Minuette wave (ii) moved higher ending about the 0.382 Fibonacci ratio of minuette wave (i). I expect it is most likely that minuette wave (ii) is over here because it should find resistance at this line. However, it is possible that it could continue sideways and higher as a flat, combination or double zigzag. Only a clear five down on the hourly chart would eliminate those possibilities.
I have drawn a base channel about minuette waves (i) and (ii). If minuette wave (ii) is complete, then upwards movement should find strong resistance there and should not breach that channel.
If the base channel is breached, then minuette wave (ii) may be expected to be continuing. The degree of labelling within it would then be moved down one degree: subminuette wave a would be a zigzag within a flat correction or subminuette wave w would be a zigzag within a combination or double zigzag.
If minuette wave (ii) continues any further, then it should continue to find resistance at the aqua blue trend line.
I expect that minuette wave (ii) is over. At 1,772 minuette wave (iii) would reach 1.618 the length of minuette wave (i).
Minuette wave (iii) should be very strong and should break below support at the lower edge of the base channel. Breaking out of a base channel in the direction of a trend is confirmation for a third wave. If that happens, then there would be no doubt that minuette wave (iii) is underway.
Along the way down, the next correction to interrupt the trend at the daily chart level would be minuette wave (iv).
If minuette wave (ii) continues, then it may not move beyond the start of minuette wave (i) above 2,020.86.
ALTERNATE BULL ELLIOTT WAVE COUNT
DAILY CHART
Click chart to enlarge.
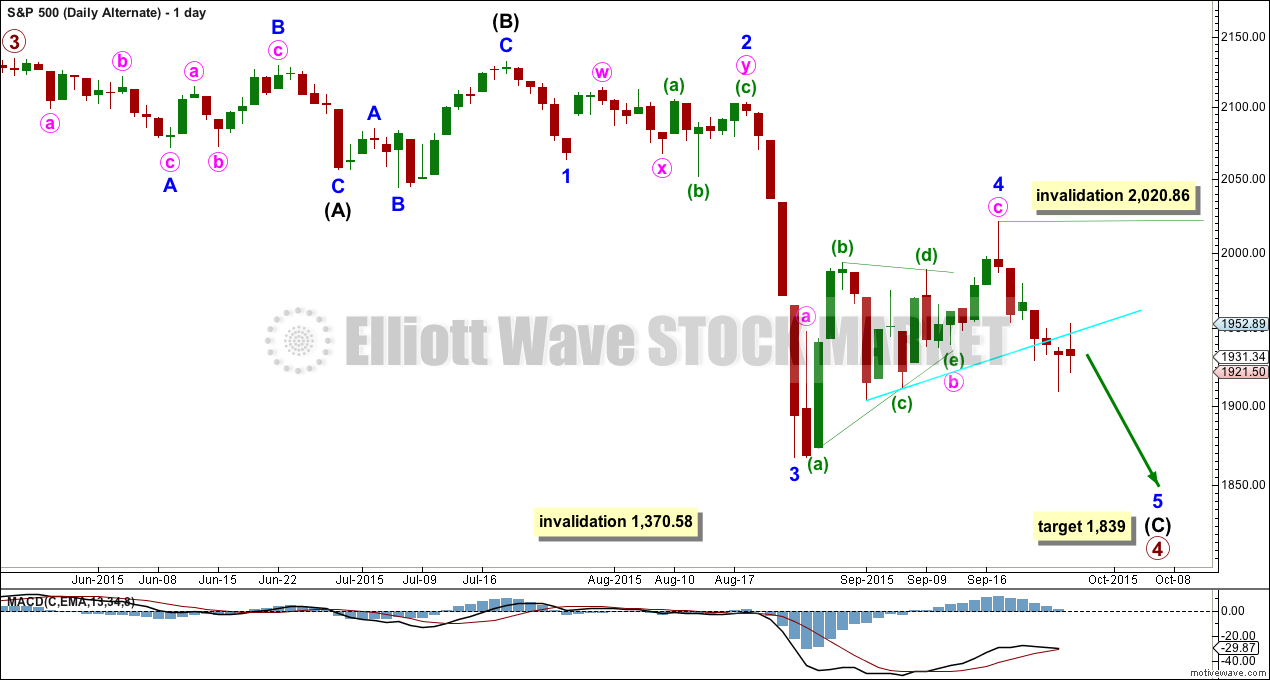
Here the subdivisions of the waves are seen in exactly the same way as the main wave count, except the degree of labelling within the last wave down and the following Dead Cat Bounce are all moved up one degree.
Minor wave 2 was a deep 0.58 double combination and minor wave 4 was a deep 0.65 zigzag. There is little alternation in depth but adequate alternation in structure. Minor wave 2 lasted 15 days and minor wave 4 lasted 17 days. There is good proportion which gives the wave count the right look.
If the next wave down does not exhibit a strong increase in momentum, then this would be a good explanation.
At 1,839 minor wave 5 would reach 2.618 the length of minor wave 1.
The subdivisions on the hourly chart are exactly the same only moved up one degree. The short term outlook is exactly the same.
The difference is in the expected momentum. If the next wave down does not exhibit an increase in momentum, then this would be a reasonable explanation.
SECOND ALTERNATE BULL ELLIOTT WAVE COUNT
DAILY CHART
Click chart to enlarge.
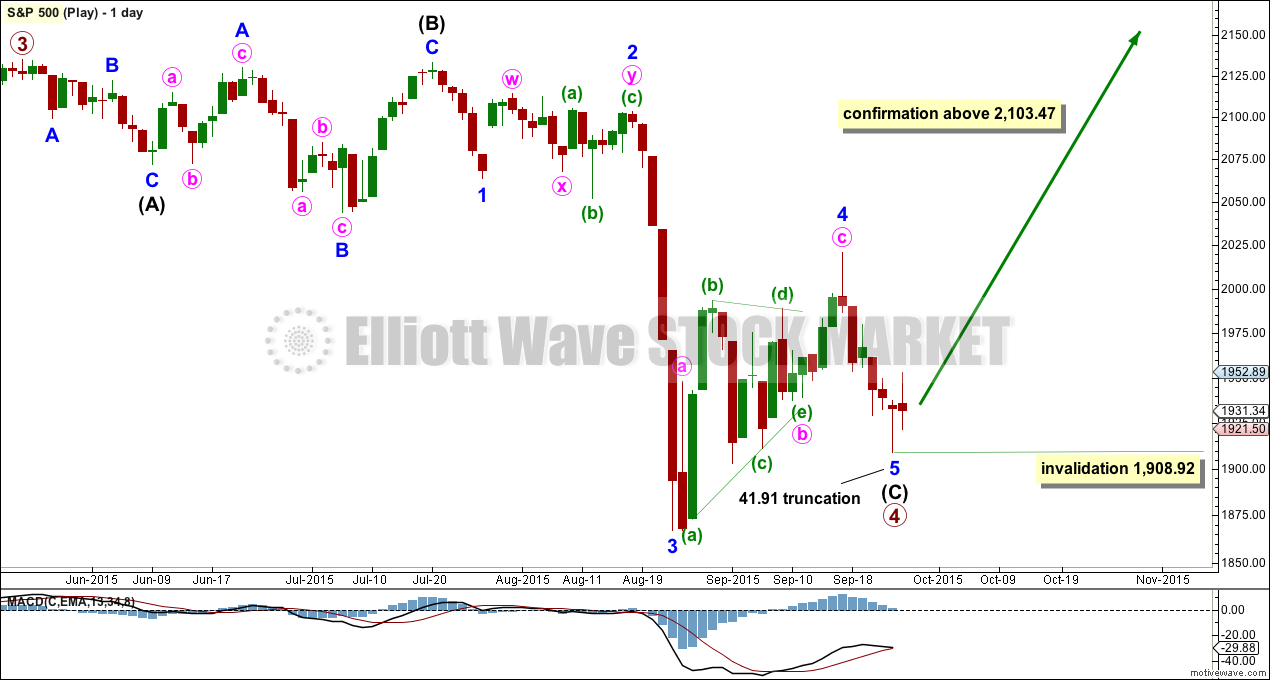
Every day I look to see if it is technically possible that downwards movement could be over. This is the first time it is possible.
Primary wave 4 will now subdivide as a complete 3-3-5 flat correction. Intermediate wave (C) can technically be a complete impulse. However, minor wave 5 is severely truncated by 41.91 points. Although a truncation can come after a movement which moves “too far too fast”, and that certainly could be an appropriate description of the downwards wave for minor wave 3, this truncation is huge.
The probability of this idea is exceptionally low. I will not take it at all seriously until price moves above 2,103.47. That would eliminate any possibility that sees the Dead Cat Bounce as a second wave correction.
BEAR ELLIOTT WAVE COUNT
DAILY CHART
Click chart to enlarge.
A big impulse down must begin, for this bear wave count, so a series of overlapping first and second waves should now be complete. The idea for the bull wave count (a flat correction unfolding downwards) does not work for this bear wave count.
A new low below 1,370.58 would invalidate the bull wave count confirming a huge market crash. Before that price point is passed though, structure should be a strong indication that this bear wave count would be correct. It is supported by regular technical analysis at the monthly chart level.
TECHNICAL ANALYSIS
DAILY CHART
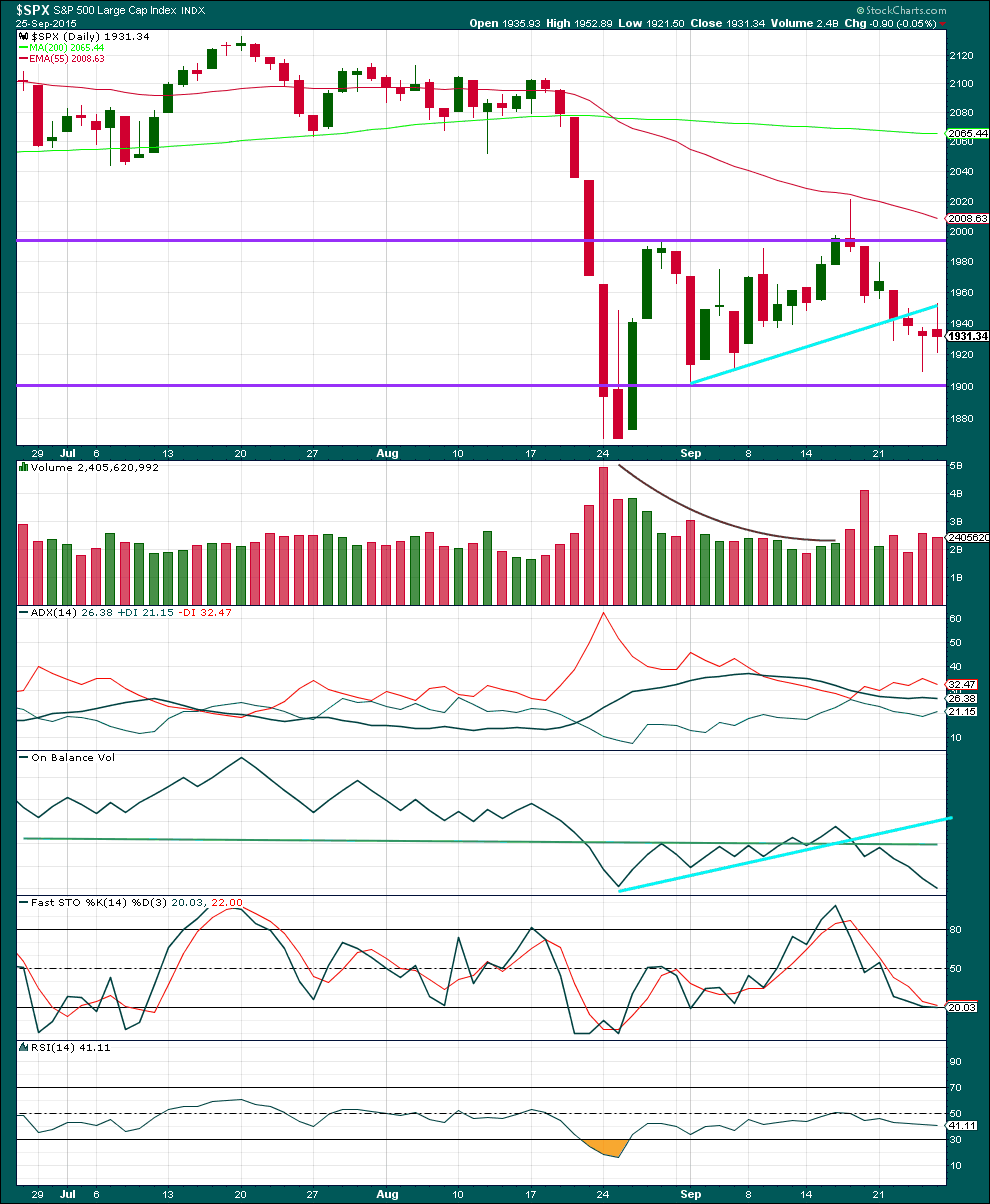
Click chart to enlarge. Chart courtesy of StockCharts.com.
Daily: Another test of the aqua blue trend line reinforces the strength of that line. Price should continue now to find resistance there for any further upwards movement.
When price breaks through support / resistance of a trend line and then throws back to that line, it will offer a good opportunity to join a trend (if a trend is indicated or expected to be in place). On a throwback the stop may be set just beyond the line, always allowing for overshoots and widening of margins during periods of volatility. If a trend is evident and expected to continue for some time, then this technique can offer a good risk / reward opportunity to join the trend. It is my favourite technique of all to find entry points in a trending market.
The other favourite technique I like to employ in a trending market is channels showing resistance / support. When a trend is clear I wait for price to find resistance / support at the channel on the opposite side of the trend: for a downwards trend I would wait for price to touch a line of resistance and for an upwards trend I would wait for price to touch a line of support. Again, the stop can be set just beyond the trend line offering a low risk / high reward set up. The more shallow a line is and the more often it is tested the more technically significant it is, and so the more confident I would be in such an entry.
Today’s small red body with a long upper wick is more bearish than bullish, but it does represent somewhat of a balance between bulls and bears for Friday, with the bulls more in charge than the bears. What this looks like is a small correction within a trend, and with slightly lower volume that makes sense. It fits the Elliott wave count nicely.
For Friday ADX is again flat indicating the market is not trending. However, during this consolidation it is clearly a downwards day which has the strongest volume, so a downwards breakout is indicated as more likely than upwards. The volume spike of six days ago does look like the start of a downwards breakout, and ADX does tend to be a lagging indicator.
Kaufman’s Moving Average has provided resistance to upwards movement.
If price breaks below the lower horizontal line of support, and if this comes on a day with increased volume, then I would have full and final confidence that price is breaking out downwards.
The green trend line on On Balance Volume is very shallow, repeatedly tested, and reasonably technically significant. The trend line has shown perfectly when price would stop upwards movement, and it ended when OBV again touched that trend line. Resistance at that trend line is reinforced.
Both Stochastics and RSI are neither overbought or oversold. There is room for the market to fall or rise.
A note on Dow Theory: for the bear wave count I would wait for Dow Theory to confirm a huge market crash. So far the industrials and the transportation indices have made new major swing lows, but the S&P500 and Nasdaq have not.
S&P500: 1,820.66
Nasdaq: 4,116.60
DJT: 7,700.49 – this price point was breached.
DJIA: 15,855.12 – this price point was breached.
This analysis is published about 08:01 p.m. EST.
UVXY–if this is a 5 up, possibly end of 2 was (using yahoo chart) 52.38 at 4.15 AM, possibly now in a 3. Where does 3 top?
Better to close UVXY today and wait out 4th correction or just hold UVXY all way to end of 5th up?
Any ideas on best way to trade UVXY during this move?
I took profits on half my position so now I am playing with “house money” so to speak. Looking at the previous impulse waves, they lasted about five days so we should see a few more days of upside action, even with intra-day retracements. The real money is made on the final spike up so I would keep at least some of my position open as I do not think we have seen the top of wave three yet. You could also use a contingency order to sell over 90 as I think that high will probably be exceeded.
Verne, thanks for comments. I notice several times you used 90 as target for UVXY . What is basis for that 90 target?
And thanks agin for sending me UVXY strategy.
That was the high for UVXY at August the SPX low, and which I expect to be exceeded if the next wave down is a third, and closely approached intra-day if it is a fifth.
Thanks
Hi Lara: I know Elliott Wave rules do not allow a third wave to be the shortest so theoretically, and as is sometimes the case, a fifth wave can be longer both in depth and duration. I know we are looking for slowing momentum to distinguish the third and fourth wave counts but does this necessarily have to be the case, or can we sometimes see fifth waves which exceed third waves in momentum?
A good point.
For the S&P third waves are usually the strongest, but not always. Sometimes it has fifth waves which are a little stronger.
And so the answer can’t be definitive. Price will eventually tell us though.
If the next wave down shows a strong increase in momentum which is really clear then I’d discard the fifth wave idea.
If the next wave down shows a slight increase in momentum I’ll probably go with the fifth wave idea. If it shows a slowing of momentum I’ll discard the third wave idea with confidence.
Once this next wave down is complete how high price goes on the next bounce may differentiate the wave counts: if this next wave down is a third wave then the following bounce can’t move above 1,867.01. If the next wave down is a fifth wave then that would be it for primary wave 4, and a new high above 1,867.01 would provide some price confidence for that idea.
But for the big bear wave count expecting a huge market crash only a new high above 2,099.18 would invalidate that at this stage. That’s the low of minor wave 1. If minor wave 3 is completing its fifth wave right now then the following bounce for minor 4 can’t move back into minor 1 price territory.
So that’s the long answer 🙂
The short answer is price will tell us. And at the appropriate time I’ll indicate what price points will tell us what’s happening, and why.
Thanks Lara!
Lara, have you used VIX as another indicator? VIX was up today even when SPX was up. This behavior had been followed up by a downside breakout from my limited experience. Thanks for the good work.
I’m still learning how to use VIX. I have published some VIX analysis once or twice, but it’s not an indicator that I’m very confident with quite yet. I’m working on it. I need to for CMT LIII.
StockCharts have VIX inverted which makes it a bit easier. I do look most days, I’m just not publishing daily.