
There is only one Elliott Wave count for FTSE.
Summary: I have only a bear wave count for FTSE. The bull wave count was invalided and so far I have not been able to find other bull alternatives which fit. Of all the markets I currently analyse FTSE is the clearest bear.
Changes to last analysis are bold.
Click charts to enlarge.
BEAR WAVE COUNT
Click chart to enlarge.
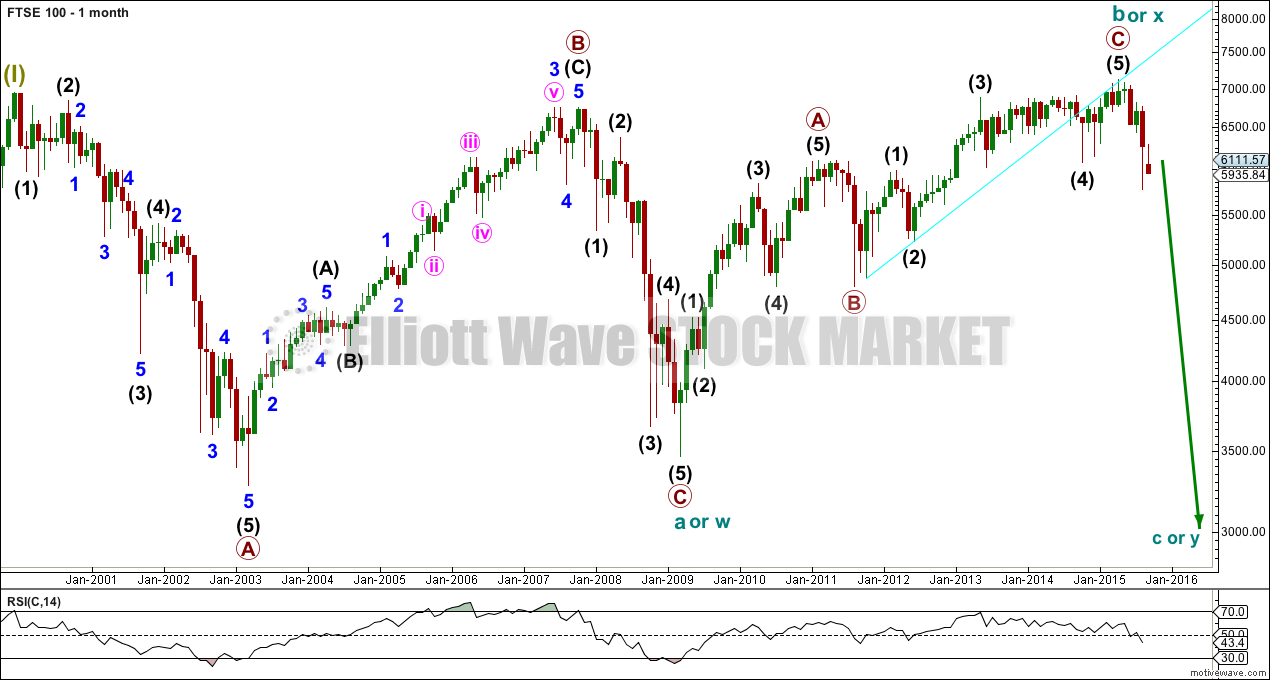
Upwards movement of the last six years is over and subdivides as a three wave structure. It is very difficult to see this as a completed five. It could be forced, but there would be problems of disproportion and at least one large truncation.
There are four possibilities I can see, all very bearish, for this bear wave count:
1. A large regular flat. Cycle wave b is a 105% correction of cycle wave a. A regular flat would expect cycle wave c to end a little below cycle wave a at 3,460.
2. A combination with cycle wave (y) a zigzag to end about the same level as cycle wave w at 3,460, because combinations move price sideways. A zigzag may be a quick structure.
3. A combination with cycle wave (y) a triangle. This would see huge overlapping waves in an ever decreasing range for several years.
4. A double flat with cycle wave (y) to be a second flat correction, a repeat of cycle wave (w). Two market crashes for primary waves a and c within it, to eventually end about 3,470 and last about 8-9 years.
There is a strong evening doji star or bearish engulfing candlestick pattern at the all time high on the monthly chart. The red candlestick not only completely engulfs the green candlestick, it is more than twice the body size. This is a very bearish candlestick pattern. Because it comes at the end of a multi year bull market and is at the monthly chart level, it is highly technically significant.
Primary wave C is a complete five wave structure which ended with a terminal ending contracting diagonal.
There is no Fibonacci ratio between primary waves A and C.
Within primary wave C, there is no Fibonacci ratio between intermediate waves (3) and (1), intermediate wave (5) is 33.39 points longer than 0.618 the length of intermediate wave (3), intermediate wave (2) is a quick deep 0.63 zigzag, and intermediate wave (4) exhibits alternation as a shallow 0.49 regular flat.
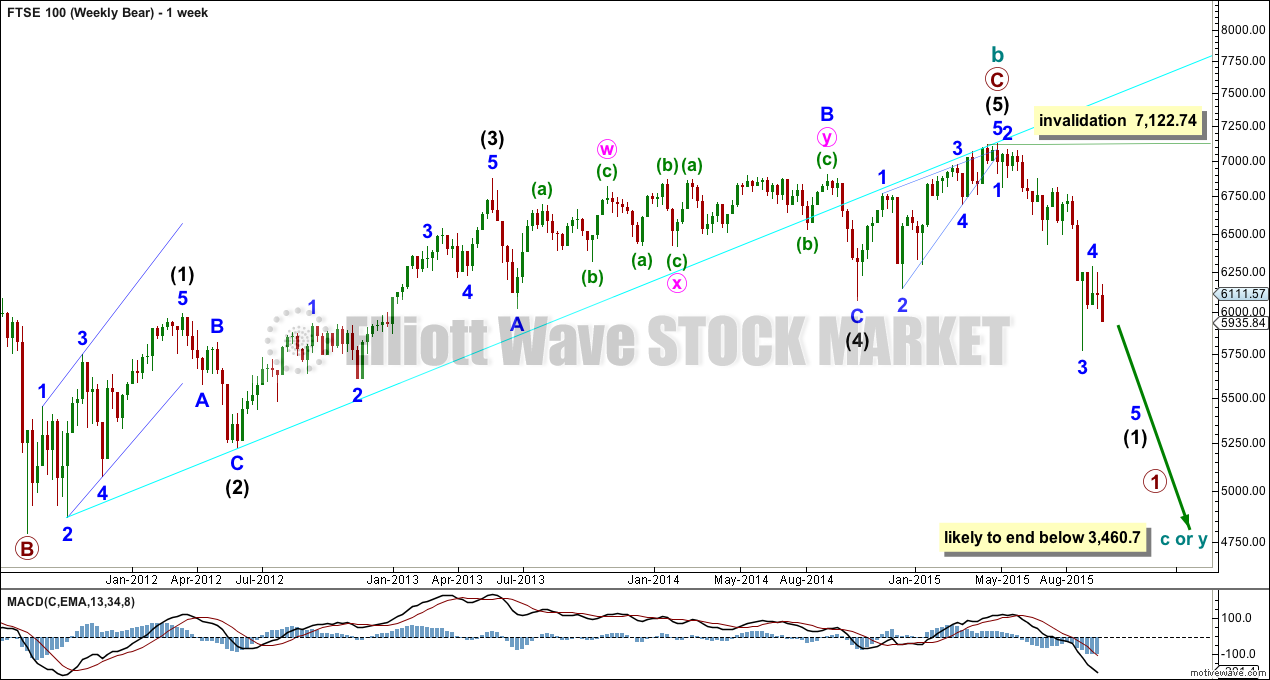
Intermediate wave (2) will arrive to convince all that the bull market has resumed. Intermediate wave (2) may not move beyond the start of intermediate wave (1) above 7,122.74.
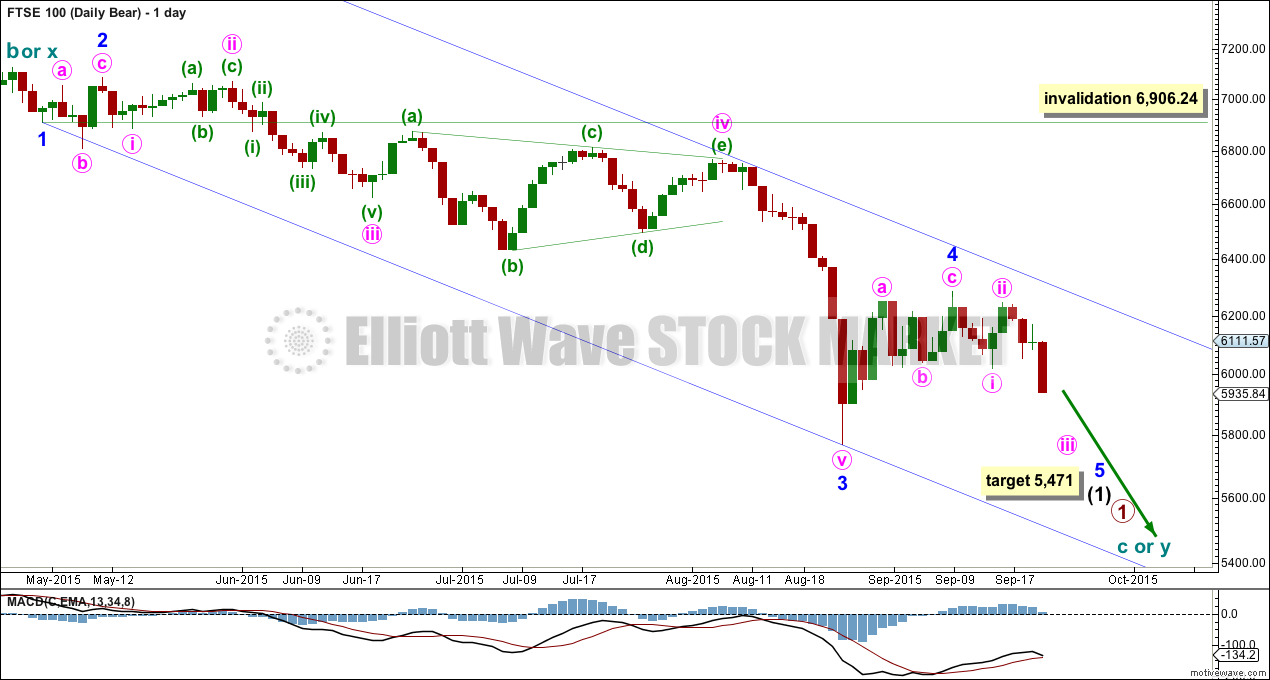
Minor wave 4 may have completed as a small shallow zigzag, lasting 11 days and 0.39 of minor wave 3. This provides perfect alternation with the deep 0.82 expanded flat of minor wave 2.
At 5,471 minor wave 5 would reach 0.618 the length of minor wave 3.
Draw a channel about this downwards movement: draw the first trend line from the ends of minor waves 1 to 3, then push a parallel copy up to contain the whole movement. Minor wave 5 may end either midway within the channel, or about the lower edge.
If minor wave 4 continues any further, then it may not move into minor wave 1 price territory above 6,906.24.
TECHNICAL ANALYSIS
DAILY CHART
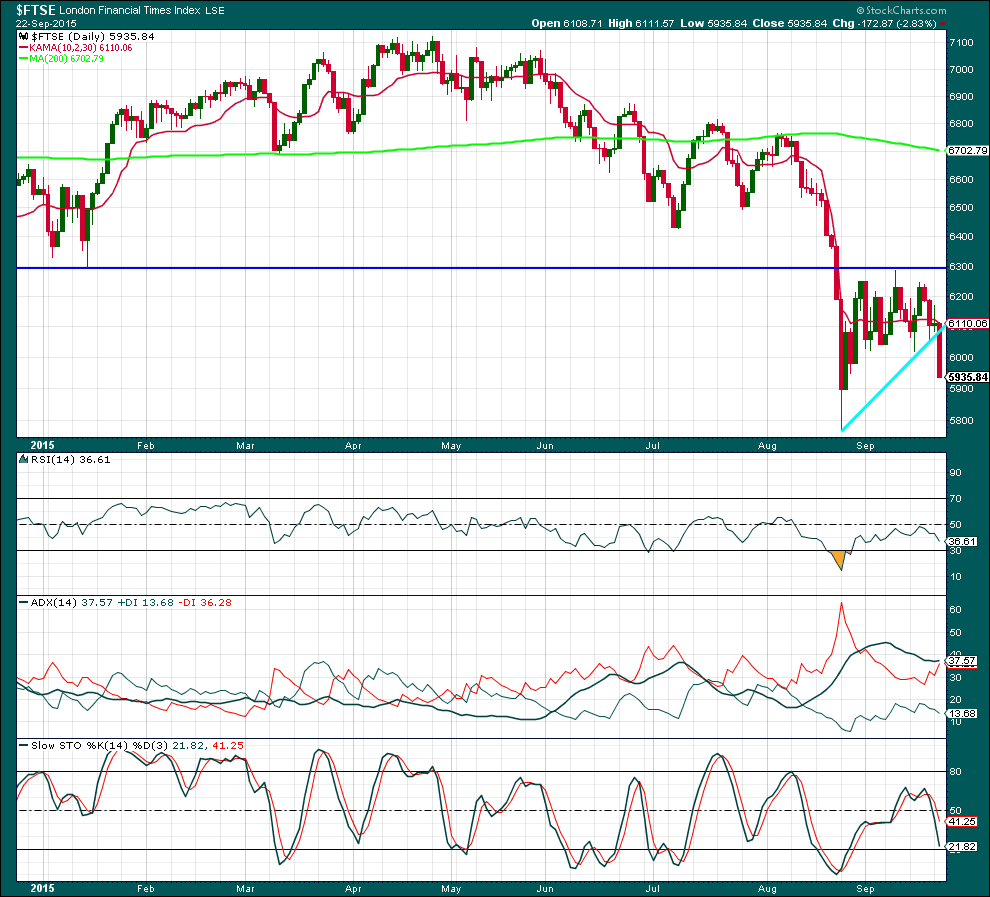
Click chart to enlarge. Chart courtesy of StockCharts.com.
There is no volume data on either the FXCM feed or StockCharts. Volume analysis is done from Yahoo Finance data: As price fell to the recent low volume rose supporting the fall in price. As price has moved sideways for 16 sessions volume has declined. 18th September saw price move lower on strongly increased volume. The volume profile is bearish.
The black ADX line is turning slightly up, indicating that the downwards trend may have resumed for FTSE. The red -DX line is above the green +DX, the trend is down.
Price found resistance at a prior point of support. Price has today broken below the sloping support line and volume today increased above the small upwards day of 21st September. It looks like a downwards breakout is underway.
This analysis is published about 09:39 p.m. EST.
European market futures were down huge after the close yesterday so some serious players were in the game. The central bankers stepped in massively pushing futures in some cases from down over 4% to up over 1%. In the US the intervention started prior to the market close. I think the short sellers must have gotten wind of the Chinese PMI data which has now fallen to 2009 lows. It will be interesting to see how long the bounce lasts and how high it goes. Hard to believe any one going long these markets. The Chinese data should have tanked markets globally. I think we are going to see another huge intra-day reversal.
Very uneventful day indeed. Who knows, maybe US markets will keep moving sideways until end of October options expiration 3 weeks from now… I was very discouraged by the lack of a strong market downward movement today specially after the Chinese factory data; and the wave count being where its at right now for S&P… I’m also concerned that EVERYONE I can think of thinks the market will be going down to at least test the August lows, and we all know what happens when everyone expects the same thing: the opposite… discouraging indeed.
Today’s action not good for the third wave down case. I rolled positions into October as it is looking like a slow sideways meandering grind is in the works. This is what happens when there is massive intervention in the markets. The waves will play out ultimately but unfortunately not in a clean and predictable way to allow good trades. We could be seeing another ridiculously protracted second wave developing. The ending diagonal exhibited this same kind of uncharacteristic prolonged delay in developing downside momentum. It is critical to take profits IMMEDIATELY in this market. At some point, downside momentum is going to overwhelm the manipulation but we may be still months away…
Thanks Lara,
I appreciate your more frequent coverage of the FTSE and Oil now that you have cut down on the videos.
Nick
Lara why is the daily chart so out of date ? Can it be replaced?
I’m sorry, my mistake. I had not updated my code. That’s done now.