
There is only one Elliott Wave count for FTSE.
Summary: I have only a bear wave count for FTSE. The bull wave count was invalided and so far I have not been able to find other bull alternatives which fit.
Click charts to enlarge.
BEAR WAVE COUNT
Click chart to enlarge.
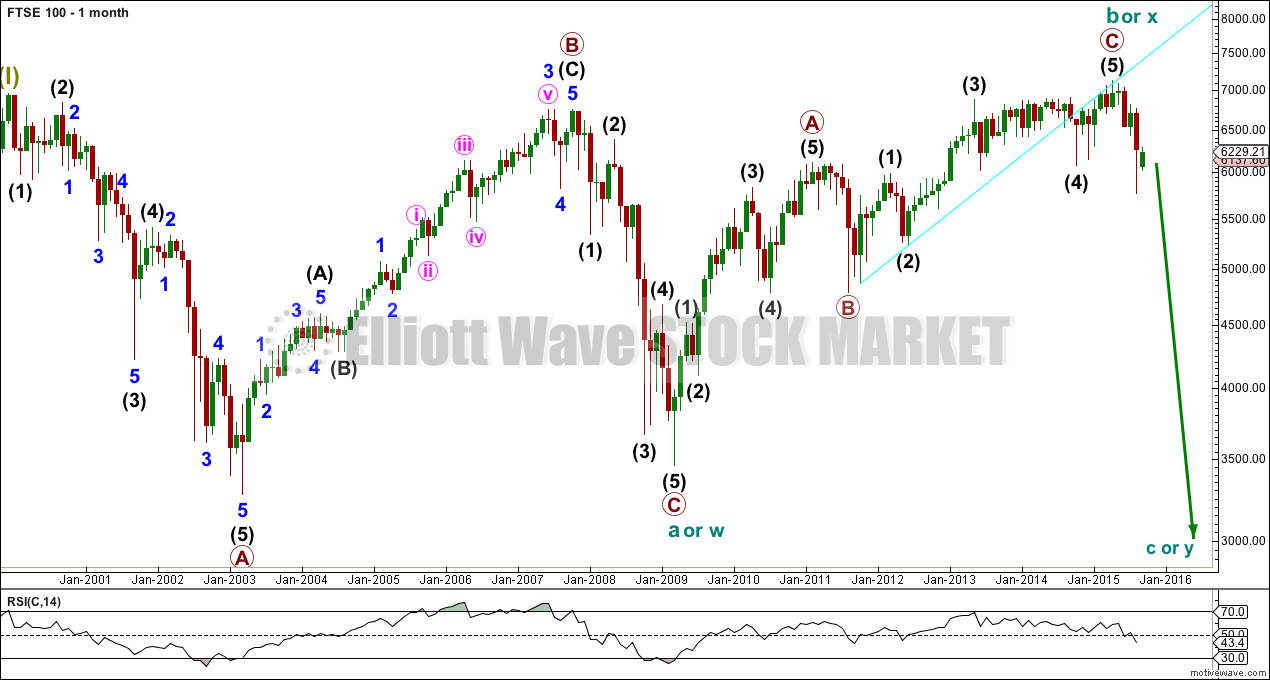
Upwards movement of the last six years is over and subdivides as a three wave structure. It is very difficult to see this as a completed five. It could be forced, but there would be problems of disproportion and at least one large truncation.
There are four possibilities I can see, all very bearish, for this bear wave count:
1. A large regular flat. Cycle wave b is a 105% correction of cycle wave a. A regular flat would expect cycle wave c to end a little below cycle wave a at 3,460.
2. A combination with cycle wave (y) a zigzag to end about the same level as cycle wave w at 3,460, because combinations move price sideways. A zigzag may be a quick structure.
3. A combination with cycle wave (y) a triangle. This would see huge overlapping waves in an ever decreasing range for several years.
4. A double flat with cycle wave (y) to be a second flat correction, a repeat of cycle wave (w). Two market crashes for primary waves a and c within it, to eventually end about 3,470 and last about 8-9 years.
Primary wave C is a complete five wave structure which ended with a terminal ending contracting diagonal.
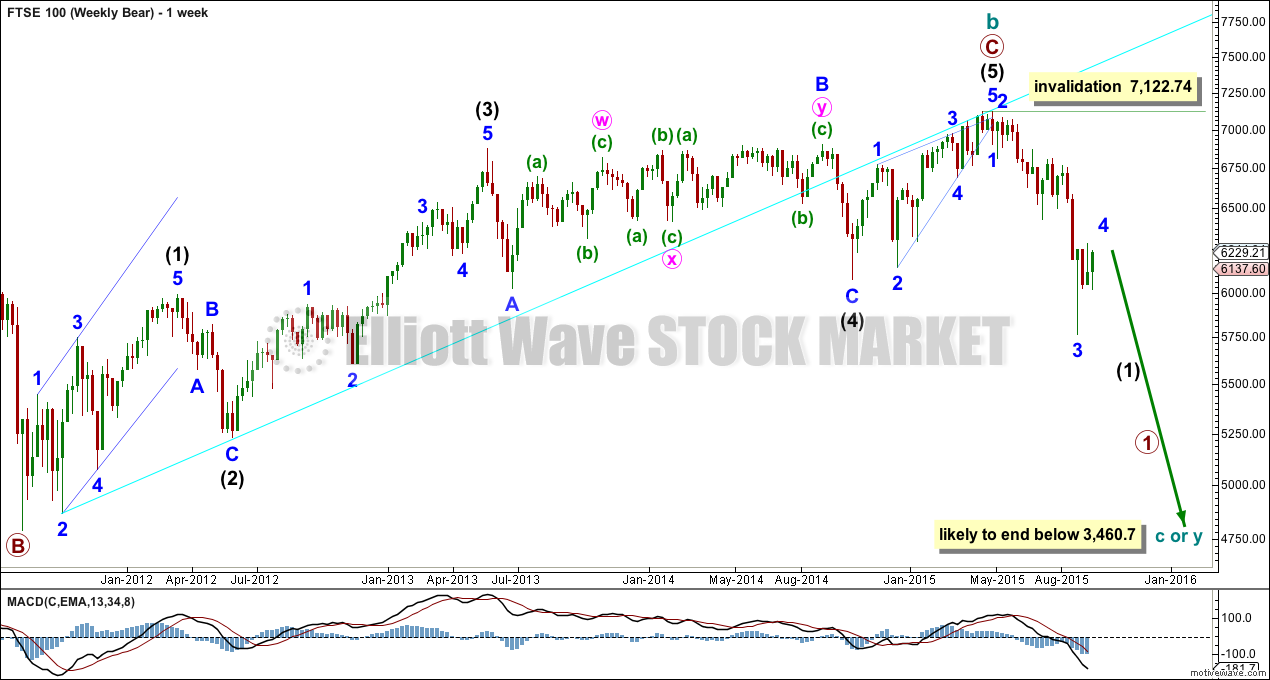
There is no Fibonacci ratio between primary waves A and C.
Within primary wave C, there is no Fibonacci ratio between intermediate waves (3) and (1), intermediate wave (5) is 33.39 points longer than 0.618 the length of intermediate wave (3), intermediate wave (2) is a quick deep 0.63 zigzag, and intermediate wave (4) exhibits alternation as a shallow 0.49 regular flat.
Intermediate wave (2) will arrive to convince all that the bull market has resumed. Intermediate wave (2) may not move beyond the start of intermediate wave (1) above 7,122.74.
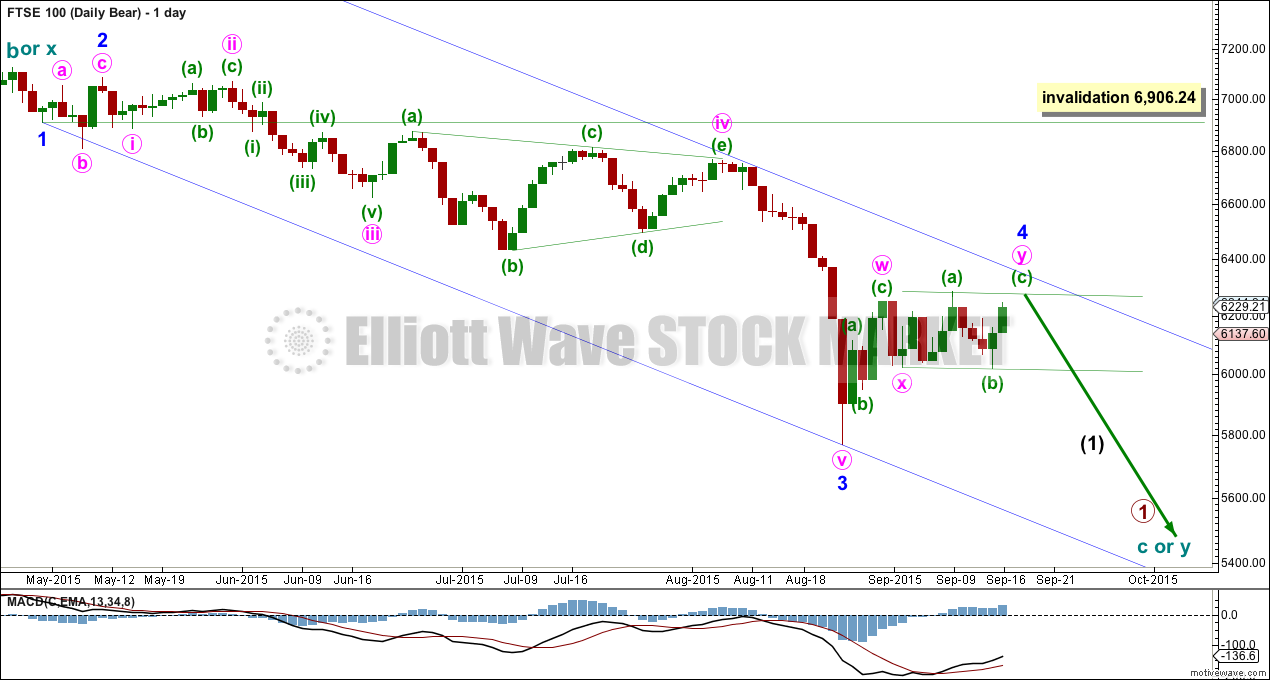
It looks like a fourth wave correction is almost complete as a combination. Minor wave 2 was a very deep 0.82 expanded flat. Minor wave 4 exhibits alternation as a shallow combination.
The first structure is a zigzag within minor wave 4. The second structure may be an incomplete regular flat, with minuette wave (b) 1.01 the length of minuette wave (a). Minuette wave (c) should move at least slightly above the end of minuette wave (a) at 6,284.17 to avoid a truncation.
Draw a channel about minute wave y. When the channel is clearly breached by downwards movement the downwards trend may have resumed. If this breach comes on a day with an increase in volume, then more confidence may be had in it.
Minor wave 4 may not move into minor wave 1 price territory above 6,906.24.
At this stage, I do not have a bull wave count. The last one was repeatedly invalidated. This does not mean a bull wave count does not exist, just that so far I cannot see a bullish solution to these waves.
BULL WAVE COUNT
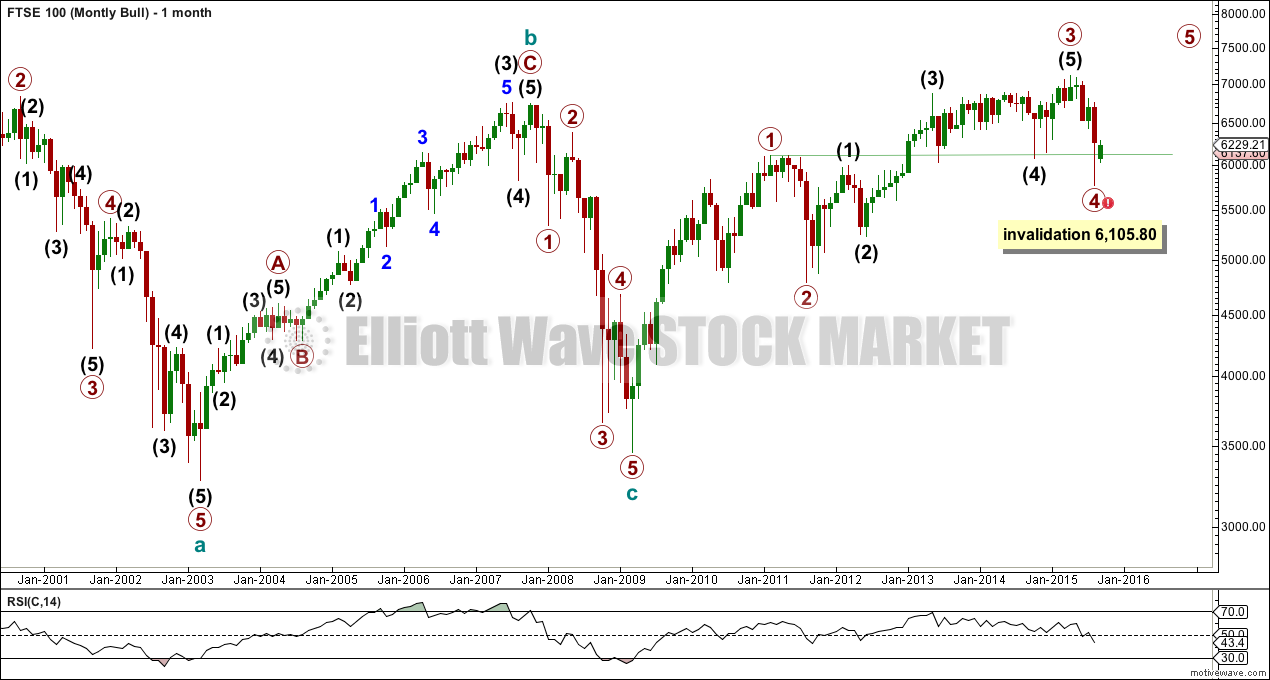
This was my bull wave count, now invalidated.
Price has moved back below 6,105.8. This downwards movement may not be a fourth wave correction within a continuing bull market because it is now back in what would be first wave price territory.
I cannot see primary wave 4 over at the prior low labelled intermediate wave (4) because that too overlaps back into primary wave 1 price territory. I would not want to see intermediate wave (3) over earlier because I think its end is correctly labelled.
Likewise I would not want to see primary wave 1 over anywhere else, that would look forced. Primary wave 1 is a perfect five wave impulse followed by a clear three down as it is labelled.
I publish this invalidated wave count to illustrate the problems I can see at this stage for a bullish alternate. If I find a solution which works, then I will publish it.
TECHNICAL ANALYSIS
DAILY CHART
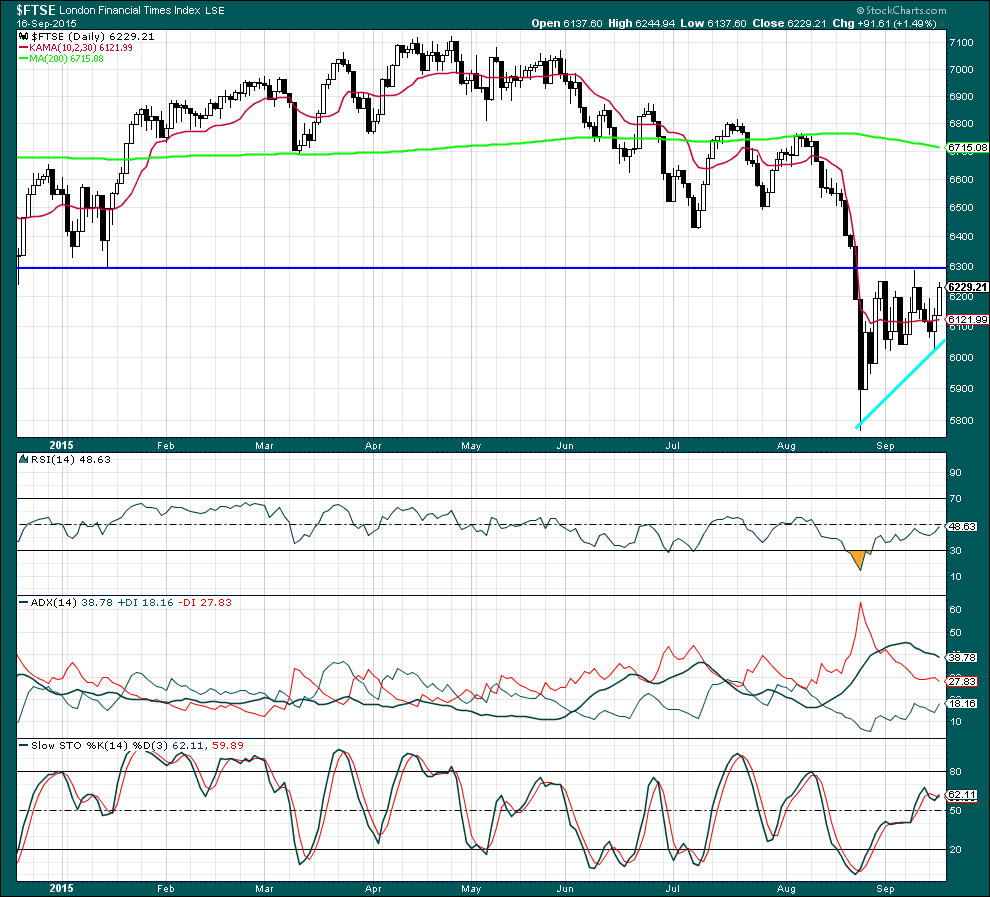
Click chart to enlarge. Chart courtesy of StockCharts.com.
There is no volume data on either the FXCM feed or StockCharts. Volume analysis is done from Yahoo Finance data: As price fell to the recent low volume rose supporting the fall in price. As price has moved sideways for the last 17 sessions volume has declined. The volume profile is bearish.
ADX indicates there is no clear trend; the market is consolidating.
Price is finding resistance at a prior point of support. Support is provided by the upwards sloping aqua blue trend line. If price breaks above resistance on an upwards day with increased volume, then an upwards breakout should be expected. If price breaks below support of the sloping aqua blue trend line on a day with an increase in volume then a downwards breakout should be expected.
This analysis is published about 03:53 a.m. EST.
From the FTSE analysis, it looks like there’s going to be a global stock market correction. I figured the China slowdown was already priced into the market. I wonder what the catalyst is going to be for this big correction…
The Elliott wave perspective expects that it is a switch in social mood from bull to bear, from optimism to pessimism, that is the catalyst for a market crash.
And that events which occur that are very bearish will occur after the market has switched.
That market movement is the expression of social mood.
It’s an important distinction, you have to turn current ideology of how we think about markets and big events on it’s head. See it in the opposite way.
So the Elliott wave approach would be not “what catalyst will make the market fall” but “what negative social events will we see now that the market has turned”.
The fall in the markets is pessimistic, and when society is pessimistic then negative outcomes are more likely, we may see the rise of nationalism, separatism, divisiveness, “us and others” thinking, punitive actions and at the bottom of a bear market war.
Thank you Lara. Your response was very insightful for me…
So far as a catalyst is concerned, and excellent candidate would be the colossal dollar-denominated debt bubble that is about to implode. It has already started with countries like Greece and Puerto Rico and cities like Detriot and soon Chicago. Ultimately bond defaults are going to affect even so-called money market funds that are supposed to be very safe. Many of them hold a substantial amount of municipal bonds and the ripple effect of the defaults is going to be felt far and wide
It could also be seen not so much as a catalyst as a root cause.
Every bubble is I think at it’s heart a debt bubble. From the Tulip mania and crash, to the “Credit Crunch” of 2007.
What is particularly interesting this time is the average prime rate (interest) in the USA has remained low, essentially flat, since March 2009. When the economy is growing banks can adjust the rate upwards. This has not happened during the bull market in stocks over these last 6 years.
And that is a huge warning I think. Something is very much not right with that. It should be a lagging indicator. If new credit has not been created while rates remain low then the economy is not expanding robustly.