
The triangle was invalidated with upwards movement leaving only one hourly wave count.
I have a new idea at the hourly chart level for you today.
Summary: The Dead Cat Bounce continues and is still most likely a fourth wave correction, which is more likely to end sooner than later. A new low now below the aqua blue trend line (it’s drawn in the same way on all charts) on an increase in volume would be first indication of a downwards breakout.
To see an outline of the bigger picture on monthly and weekly charts click here.
To see a video explanation of the wave count at weekly and daily chart levels click here.
Changes to last analysis are bold.
BULL ELLIOTT WAVE COUNT
DAILY CHART
Click chart to enlarge.
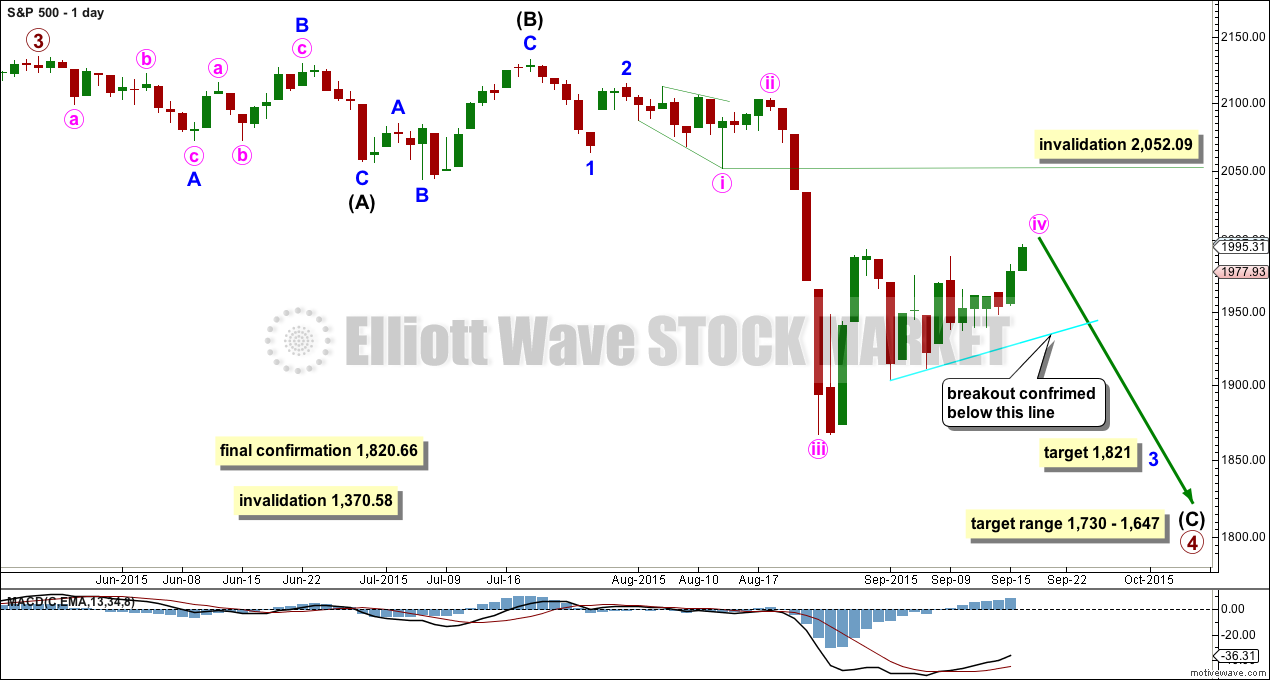
Primary wave 4 may be longer lasting than primary wave 2 as these types of sideways corrective structures tend to be more time consuming than zigzags. Primary wave 4 may complete in a total Fibonacci 21 weeks. Primary wave 4 is in its 17th week, but it may not exhibit a Fibonacci duration because the S&P does not reliably do this. Time estimates may only be taken as a very rough guide.
Within primary wave 4, it may be that intermediate waves (A) and (B) are both complete as three wave structures indicating a flat may be unfolding. Intermediate wave (C) down must be a five wave structure; it looks like it is unfolding as an impulse. For now I will leave this degree as is, but depending on where intermediate wave (C) ends I may move it back down one degree. It is also possible that only minor wave A may be unfolding as a flat correction.
At the daily chart level, this wave count sees primary wave 4 as a possible regular flat correction: intermediate wave (B) is a 98% correction of intermediate wave (A). However, regular flats normally have C waves which are close to equality with their A waves, and they normally fit nicely within parallel channels. Here intermediate wave (C) is much longer than (A) and will still move lower as its structure is incomplete. When the five wave impulse down for intermediate wave (C) is complete, then I will revisit the structure of primary wave 4 which may not be a flat. The structure at the daily chart level so far fits for the very bearish wave count better than this wave count.
If this impulse does not bring price down to the target range or the lower edge of the big channel on the weekly chart, then it may only be intermediate wave (A) of a bigger flat for primary wave 4. If it does bring price lower to the target range, then it may be primary wave 4 in its entirety.
Full and final confirmation of a bear market (mid term) would come with:
1. A clear five down on the daily chart.
2. A new low below 1,820.66.
As each condition is met further confidence may be had in the bigger picture for this wave count.
Primary wave 4 may not move into primary wave 1 price territory below 1,370.58. Invalidation of this bull wave count (still bullish at cycle degree) would be confirmation of the bear wave count.
I have two ideas at the hourly chart level today.
At this stage, I am discarding the idea that the current consolidation could be a second wave correction. It would be only just over halfway through which would see at its end the duration much greater than minute wave ii one degree higher. That idea has such a low probability it should be discarded.
I am drawing the bright aqua blue trend line on all charts in exactly the same way. It is this line which I want to use to confirm the end of this correction and the resumption of the downwards trend. When there is a break below this line, and if it comes with higher volume, then I would have some confidence that the trend has resumed.
FIRST HOURLY ELLIOTT WAVE COUNT
Click chart to enlarge.
There was a triangle in recent sideways movement. The question is: what degree and what wave should it be labelled? All possibilities should be considered, even those which look unlikely.
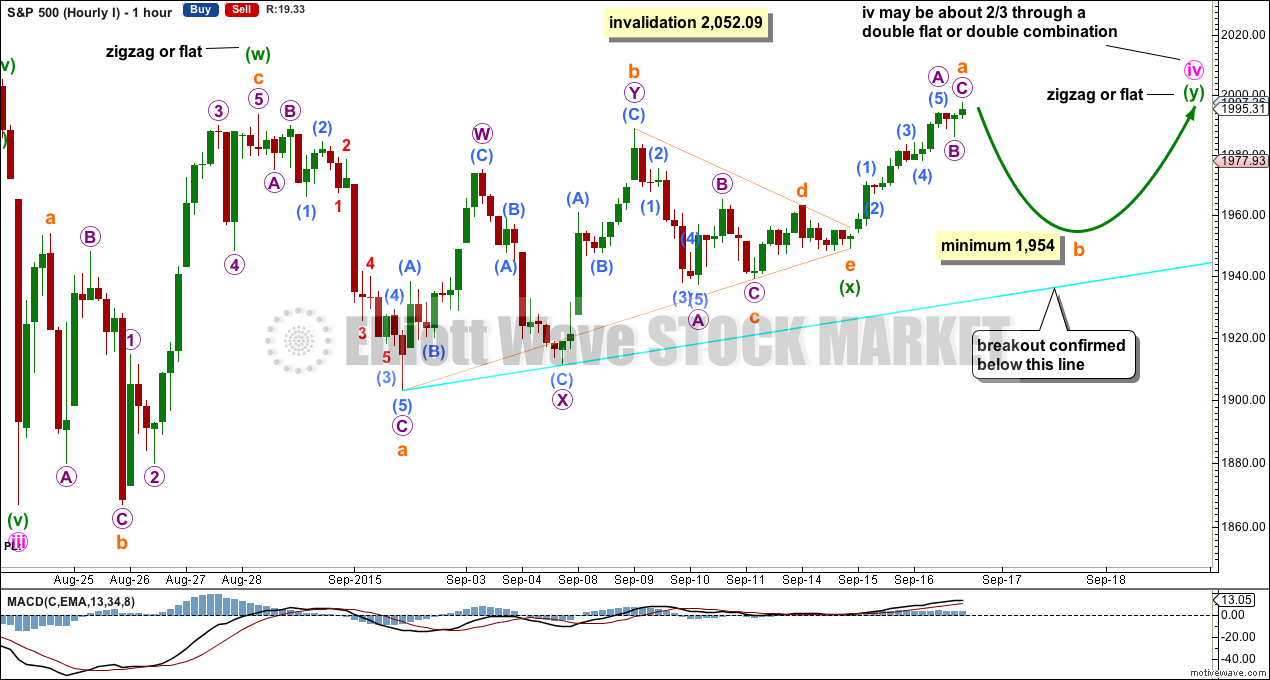
Minute wave ii was a deep 0.83 double zigzag. Given the guideline of alternation minute wave iv may be expected to be more shallow and most likely a flat, combination or triangle. For this reason this is now the preferred wave count.
Here minute wave iv may be seen as a double flat or combination.
The first structure in the double may be seen either as a flat or zigzag, but it looks more like a zigzag. This means the second structure in the double is most likely to be a flat correction for a double combination.
Within a possible flat for minuette wave (y), subminuette wave a must subdivide as a three and subminuette wave b must retrace a minimum 90% of subminuette wave a. If subminuette wave a is over at the high for Wednesday, then subminuette wave b must move to 1,954 or below.
Subminuette wave b may make a new low below the start of subminuette wave a at 1,949.13 as in an expanded flat, and so for this reason there is no lower price point which would confirm that the whole correction for minute wave iv is finally over.
This first wave count expects to see overlapping sideways movement in an ever increasing range for a few days, into next week, before the correction is over.
Minute wave iv may not move into minute wave i price territory above 2,052.09.
SECOND HOURLY ELLIOTT WAVE COUNT
Click chart to enlarge.
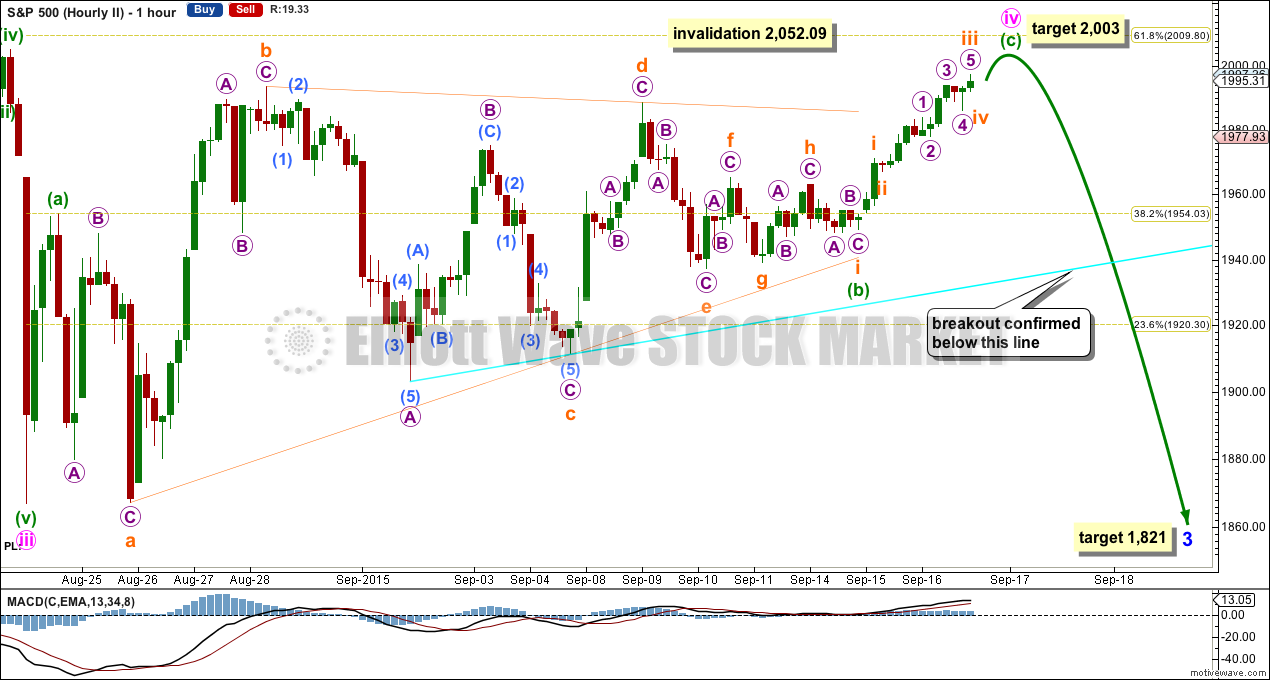
What if minute wave iv is not exhibiting good alternation with minute wave ii? Alternation is a guideline, not a rule, and is almost always seen to one degree or another and should be expected. However, it is not clear or perfect so all possibilities should be considered.
Minute wave iv may be unfolding as a single zigzag. There would be inadequate alternation with the double zigzag of minute wave ii which reduces the probability of this wave count.
Minute wave iv may be relatively deep, but not as deep as the 0.83 of minute wave ii. Again, there would be some alternation, but it would be inadequate.
If minute wave iv is a zigzag, then the triangle may have been minuette wave (b). It may have been a nine wave triangle. The subdivisions all fit perfectly and are all well contained within the triangle trend lines. This part of the wave count has the best overall look which is why I am considering it.
At 2,003 minuette wave (c) would reach 0.618 the length of minuette wave (a). This would see minute wave iv end just short of the 0.618 Fibonacci ratio of minute wave iii at 2,010.
At 1,821 minor wave 3 would reach 4.236 the length of minor wave 1.
BEAR ELLIOTT WAVE COUNT
DAILY CHART
Click chart to enlarge.
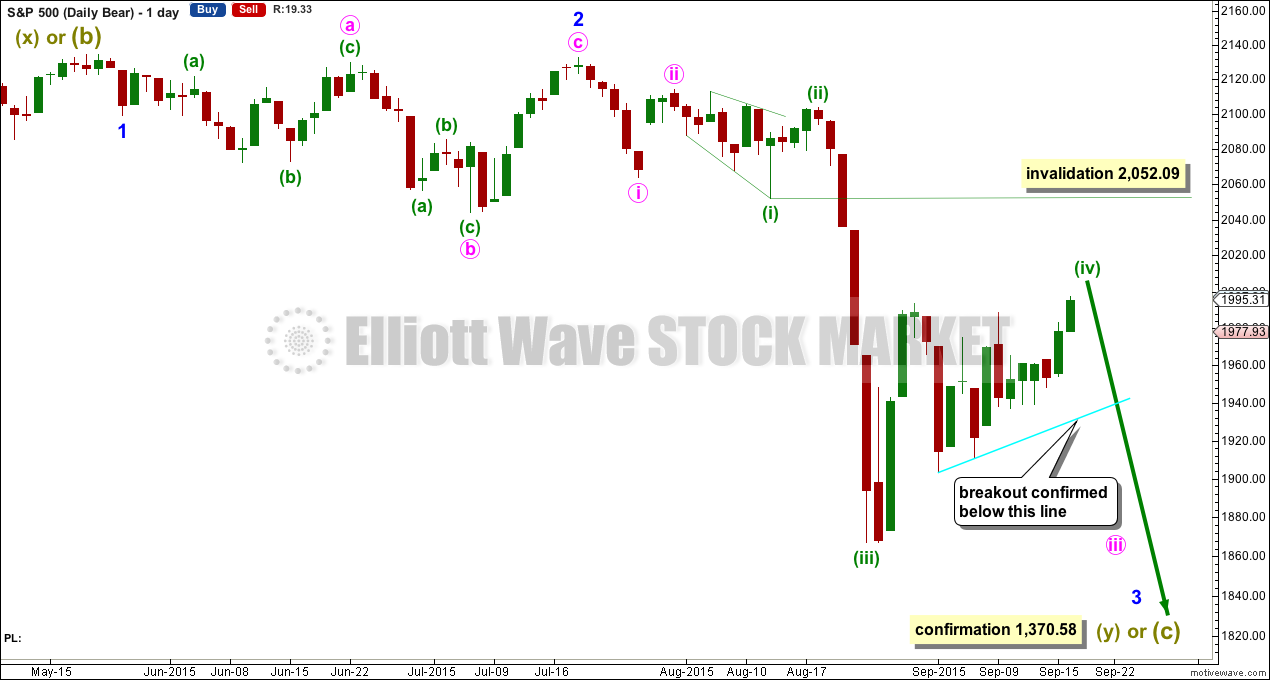
A big impulse down must begin, for this bear wave count, so a series of overlapping first and second waves should now be complete. The idea for the bull wave count does not work for this bear wave count.
A new low below 1,370.58 would invalidate the bull wave count confirming a huge market crash. Before that price point is passed though, structure should be a strong indication that this bear wave count would be correct. It is supported by regular technical analysis at the monthly chart level.
TECHNICAL ANALYSIS
DAILY CHART
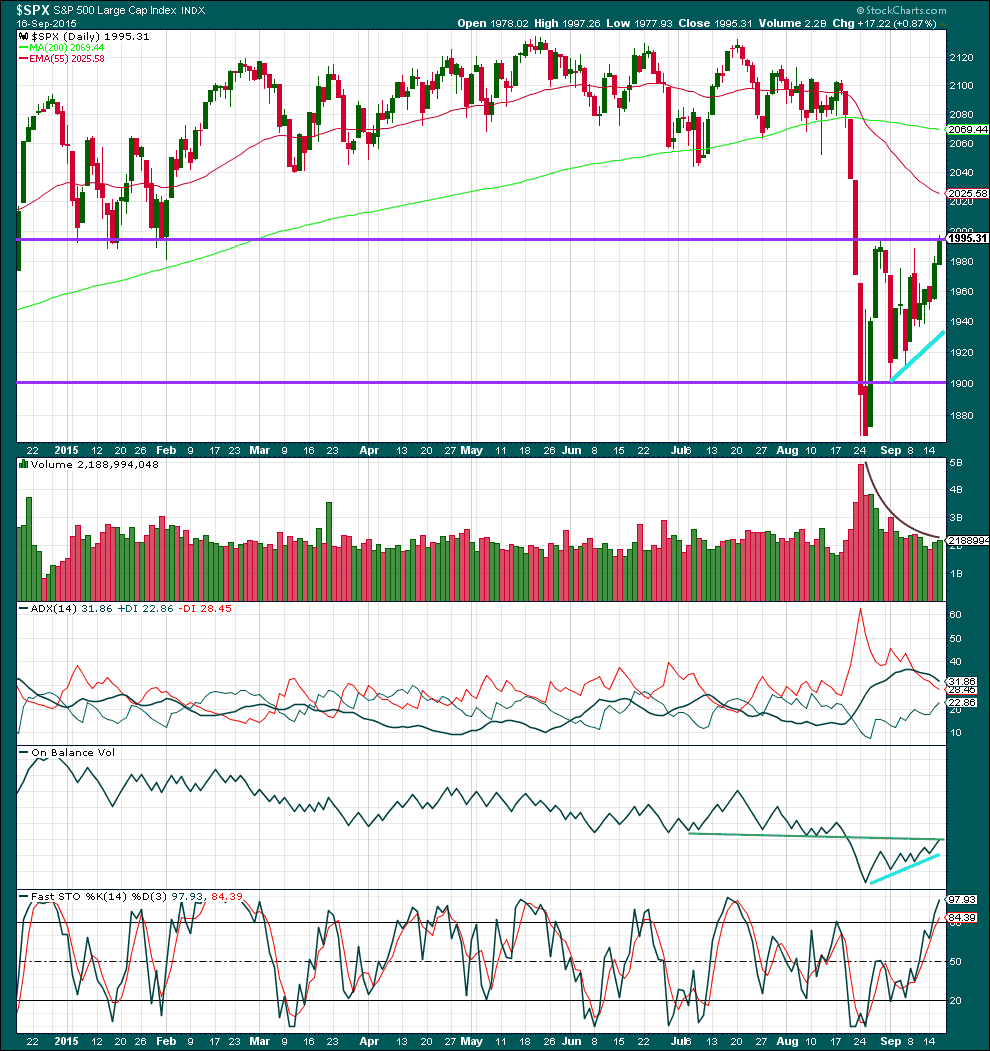
Click chart to enlarge. Chart courtesy of StockCharts.com.
Daily: A stronger upwards day on slightly increased volume to a slight new high is not enough for an upwards breakout to be indicated. Overall, since price moved into this sideways range, volume continues to decline indicating a consolidation not a new trend.
ADX is flat indicating the market is not currently trending. ADX does tend to be a lagging indicator.
I have removed the purple line on On Balance Volume because it was breached. The green line is more technically significant because it is more shallow, longer held and tested more often. OBV should find resistance at that line, and today it has come up to touch it. A break below the shorter held bright aqua blue line on OBV would be further bearishness. OBV is being squashed between the green line and the upwards bright blue line. The breakout should come very soon.
Price is slightly overshooting the upper horizontal line providing resistance. I have zoomed out to show more past price movement to show where this line previously provided support. I expect this line (about it) to provide strong resistance now.
Today I am adding Stochastics. It shows overbought which indicates that if the market is range bound (and ADX says it is) a downwards swing should be expected to begin here or very soon.
If I wanted to see anything bullish in this whole picture, I could say that within this recent sideways movement the strongest day’s volume is the first day of this consolidation which had highest volume. But that really would be stretching credulity, because as price rose for the first three days of the correction volume fell. It’s not really bullish at all.
A note on Dow Theory: for the bear wave count I would wait for Dow Theory to confirm a huge market crash. So far the industrials and the transportation indices have made new major swing lows, but the S&P500 and Nasdaq have not.
S&P500: 1,820.66
Nasdaq: 4,116.60
DJT: 7,700.49 – this price point was breached.
DJIA: 15,855.12 – this price point was breached.
This analysis is published about 10:03 p.m. EST.
Hi Lara
could it be possible that we are in a leading diagonal for a fifth wave up?
Nick
Technically it’s possible. Volume absolutely does not support it. And then you’ve got the problem of the downwards movement having to subdivide as a complete corrective structure. And it doesn’t. At least, I can’t see a solution for that.
Lara:
From First hourly wave count above, is it possible that whole structure had ended at where you lable as subminiette wave a( i.e. Minuette wave( y) is a single zigzag) ? If yes , is the structure considered as combination itself? Thanks.
I’m sorry for the delay in my reply Rachel. The market has answered your question, more upwards movement indicates the correction wasn’t over there.
Thanks Lara. It looks like either way we are expecting a drop tomorrow, either down to 1950-1960 area, or much lower from there in the other hourly count. These are the same alternatives I see in the VXX as well, where the VXX might move up from here (21.60 after-hours) or it might have a 4-5 left to play out to the downside.
Do you have a target for Minute wave iv in the first hourly count? 61.8% retrace maybe?
About the same level as minuette (w) at 1,994.
Combinations should move price sideways, so the second structure normally ends close to the same level as the first to achieve a sideways look.