
The correction continued.
The first Elliott wave count is well supported by regular technical analysis, and still looks right.
Summary: The correction continued on Monday. It may be done now or it may take another one to two days. I expect the downwards trend to resume this week. A clear breach of the lower triangle trend line on the hourly chart (which is the same as the aqua blue trend line on the daily chart) would provide first trend channel confirmation that a downwards breakout has begun. A new low reasonably below 1,911.21 would provide price confirmation. The target for the next wave down is 1,821.
To see an outline of the bigger picture on monthly and weekly charts click here.
Changes to last analysis are bold.
BULL ELLIOTT WAVE COUNT
DAILY CHART
Click chart to enlarge.
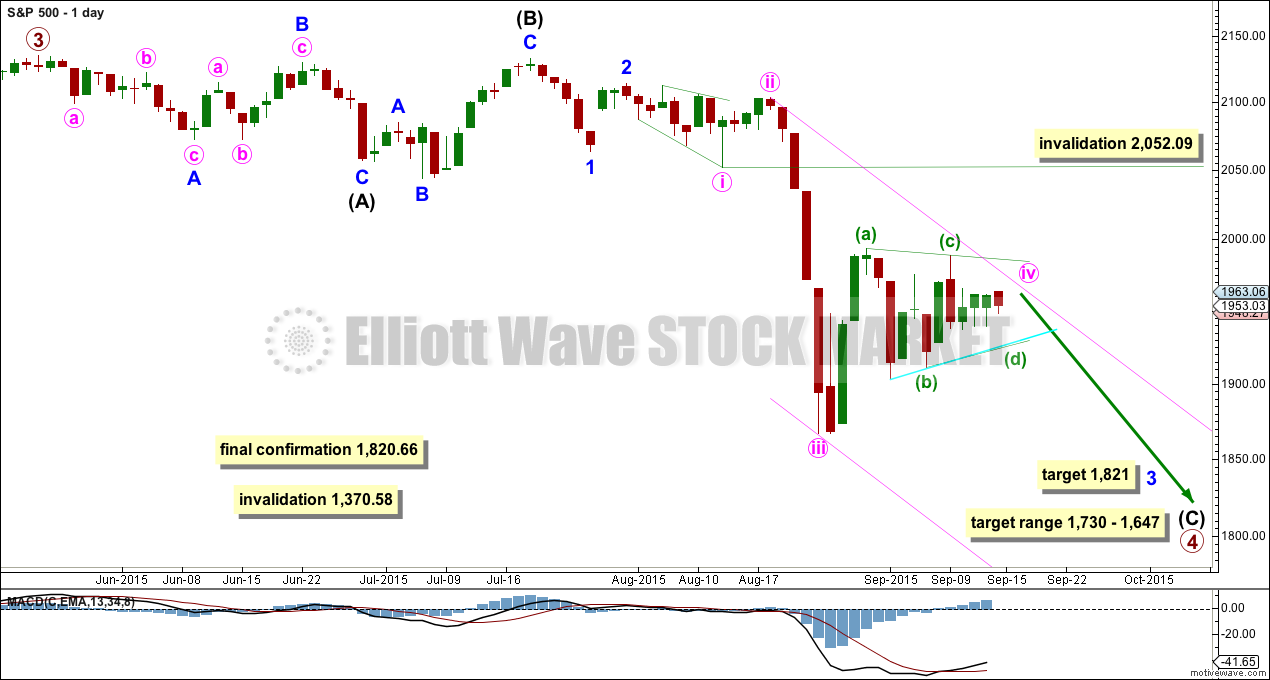
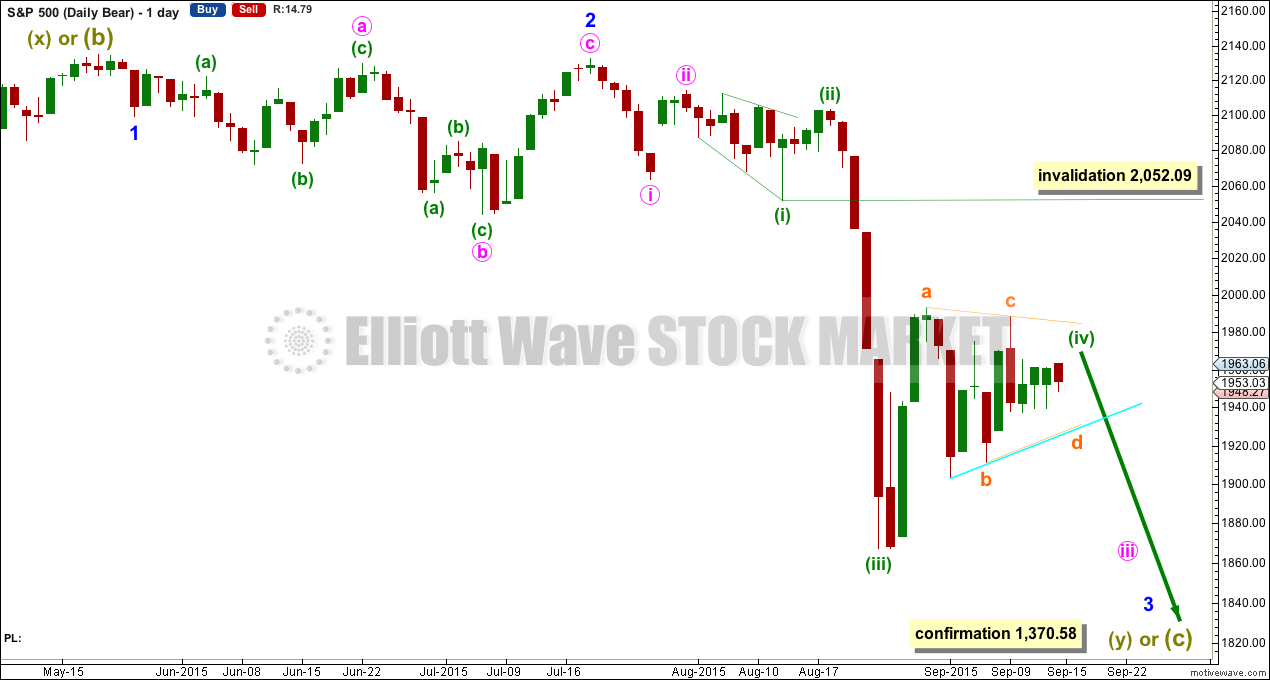
Primary wave 4 may be longer lasting than primary wave 2 as these types of sideways corrective structures tend to be more time consuming than zigzags. Primary wave 4 may complete in a total Fibonacci 21 weeks. Primary wave 4 has started its 17th week, but it may not exhibit a Fibonacci duration because the S&P does not reliably do this. Time estimates may only be taken as a very rough guide.
Within primary wave 4, it may be that intermediate waves (A) and (B) are both complete as three wave structures indicating a flat may be unfolding. Intermediate wave (C) down must be a five wave structure; it looks like it is unfolding as an impulse. For now I will leave this degree as is, but depending on where intermediate wave (C) ends I may move it back down one degree. It is also possible that only minor wave A may be unfolding as a flat correction.
At the daily chart level, this wave count sees primary wave 4 as a possible regular flat correction: intermediate wave (B) is a 98% correction of intermediate wave (A). However, regular flats normally have C waves which are close to equality with their A waves, and they normally fit nicely within parallel channels. Here intermediate wave (C) is much longer than (A) and will still move lower as its structure is incomplete. When the five wave impulse down for intermediate wave (C) is complete, then I will revisit the structure of primary wave 4 which may not be a flat. The structure at the daily chart level so far fits for the very bearish wave count better than this wave count.
If this impulse does not bring price down to the target range or the lower edge of the big channel on the weekly chart, then it may only be intermediate wave (A) of a bigger flat for primary wave 4. If it does bring price lower to the target range, then it may be primary wave 4 in its entirety.
Full and final confirmation of a bear market (mid term) would come with:
1. A clear five down on the daily chart.
2. A new low below 1,820.66.
As each condition is met further confidence may be had in the bigger picture for this wave count.
Primary wave 4 may not move into primary wave 1 price territory below 1,370.58. Invalidation of this bull wave count (still bullish at cycle degree) would be confirmation of the bear wave count.
I have three ideas at the hourly chart level today. They are presented in order of probability. The third and last idea has a very low probability, and is presented to consider all possibilities just in case the first two are wrong.
At this stage, I am discarding the idea that the current consolidation could be a second wave correction. It would be only just over halfway through which would see at its end the duration much greater than minute wave ii one degree higher. That idea has such a low probability it should be discarded. I am confident this consolidation is a fourth wave, and so far it looks very much like a triangle.
FIRST HOURLY ELLIOTT WAVE COUNT
Click chart to enlarge.
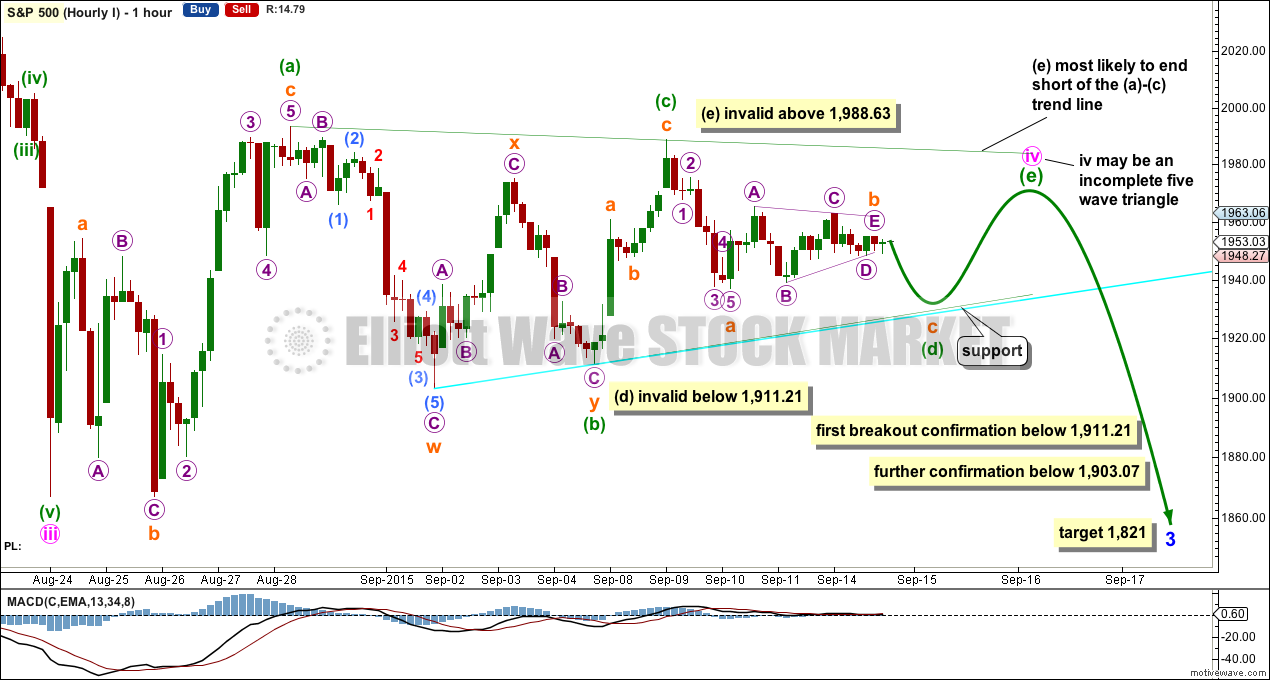
This first hourly wave count follows on directly from last analysis’s first hourly wave count, except here the triangle is again incomplete. Minuette wave (d) may be unfolding sideways as a zigzag, and may not move beyond the end of minuette wave (b) below 1,911.21 for a contracting triangle. Minuette wave (d) may move slightly below minuette wave (b), for a barrier triangle, as long as the (b)-(d) trend line is essentially flat.
Minuette wave (e) is most likely to fall short of the (a)-(c) trend line, and must unfold as a zigzag.
When triangles are done the movement out of them is often swift and sharp. So far price is just drifting sideways and MACD is now hovering right on zero, which indicates a triangle is still completing.
When the triangle looks to be complete, when all the sub waves have unfolded, then a breach of the lower triangle trend line would provide trend line indication that a breakout may be underway because triangles normally adhere well to their trend lines.
A subsequent break reasonably below 1,911.21 may not be a continuation of the triangle. At that stage, the triangle must be over and a new low reasonably below 1,911.21 would indicate a downwards breakout.
Further price confirmation would come with a new low below 1,903.07 as that would invalidate the third hourly wave count.
At 1,821 minor wave 3 would reach 4.236 the length of minor wave 1.
SECOND HOURLY ELLIOTT WAVE COUNT
Click chart to enlarge.
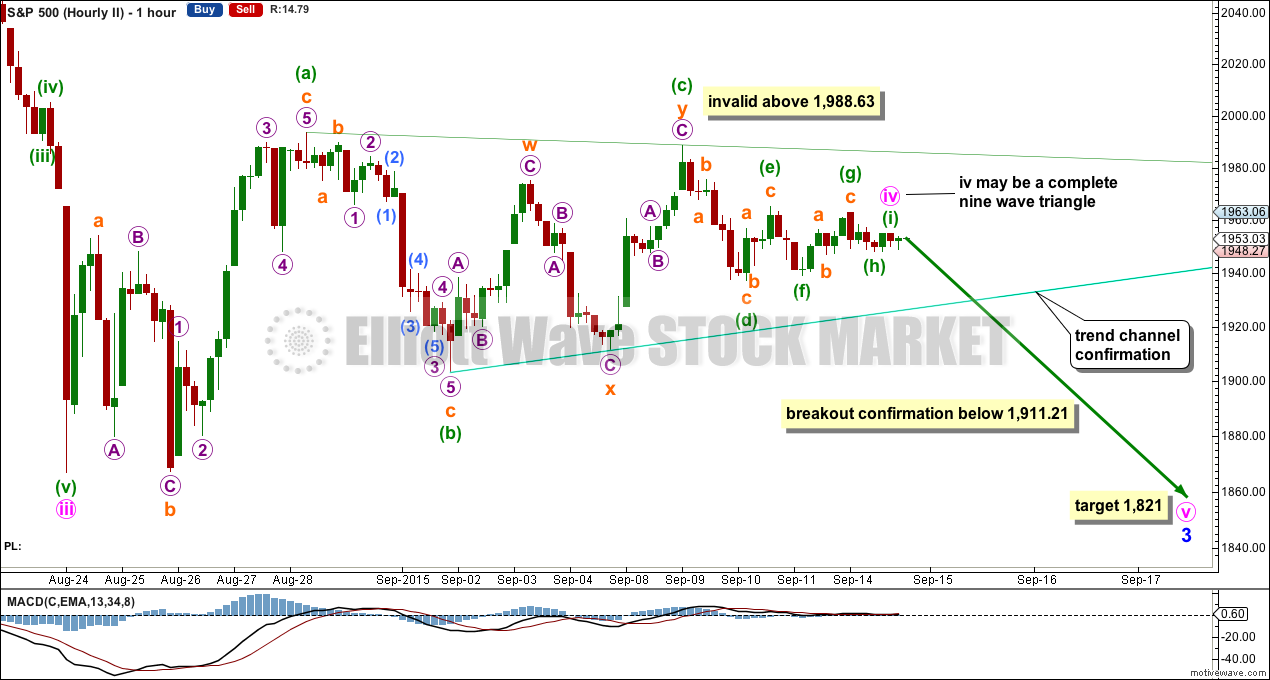
This idea is new.
I have seen a nine wave triangle on Gold, which contained one more complicated double zigzag within one of its sub waves and looked remarkably like this structure here on the S&P.
If minute wave iv is a nine wave triangle, then it may now be complete.
Use the lower trend line and the price point of 1,911.21 in the same way. First indication that the triangle is complete would come with a breach of the lower trend line. Next indication would come with a new low reasonably below 1,911.21.
The target at 1,821 is the same.
THIRD HOURLY ELLIOTT WAVE COUNT
Click chart to enlarge.
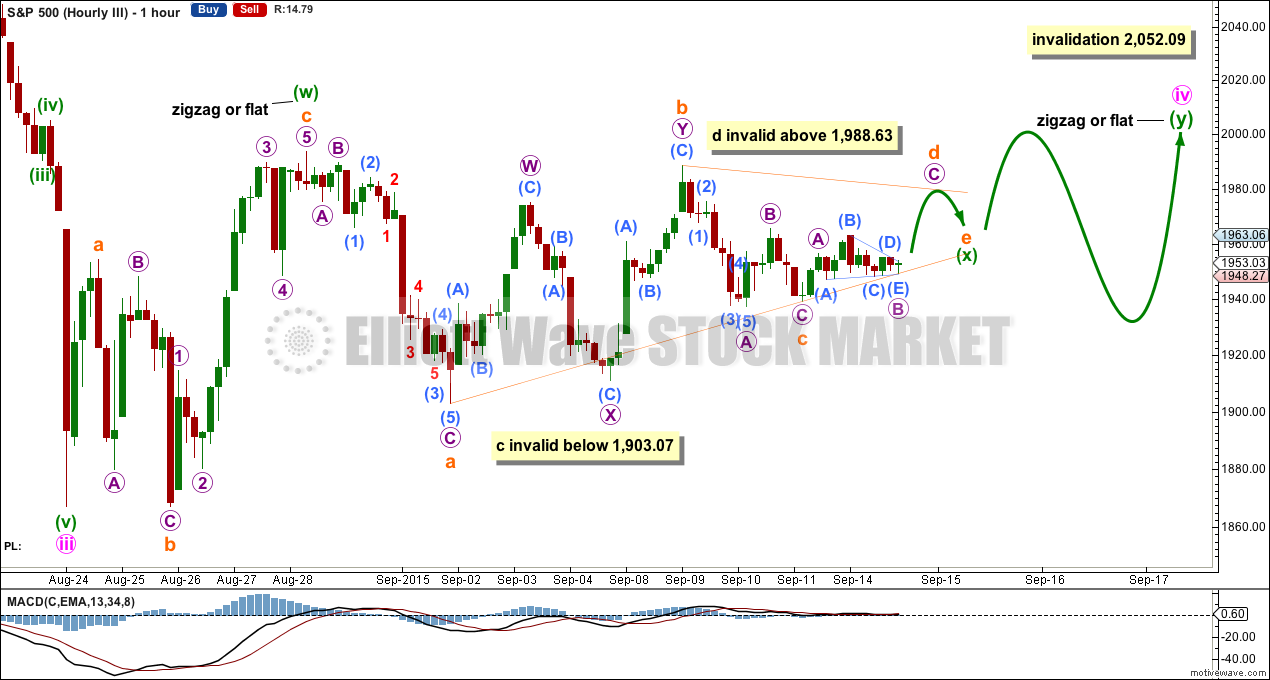
It has been my experience over the years that too many times when I think a triangle is unfolding it is invalidated right at the last minute and the correction turns out to be a combination. Alternates should always be considered when it looks like a triangle is unfolding so that we are prepared for all possibilities.
At this stage, if a combination is unfolding, then it may be a zigzag or flat – X wave (as a triangle) – to complete for the second structure.
The first structure looks more like a zigzag than a flat, which means the second structure is most likely to be a flat correction for a double combination.
The triangle for minuette wave (x) needs to move sideways some more to complete subminuette waves d and e.
It is possible also that subminuette wave c is not over and is unfolding as a more time consuming zigzag. It may not move beyond the end of subminuette wave a below 1,903.07.
Subminuette wave d may not move reasonably above the end of submineutte wave b at 1,988.63.
When the triangle is complete a false upwards breakout may happen for the start of minuette wave (y). Minuette wave (y) may move in overlapping sideways movement in an ever increasing range.
This idea has a very low probability for two reasons:
1. X waves are commonly zigzags. It is unusual for an X wave to be a triangle.
2. This would see the duration of the correction much longer than minute wave ii. Minute wave ii lasted four days. While combinations and triangles are more time consuming structures, so far this correction has lasted 14 days. For it to continue for several more days would see it grossly disproportionate to minute wave ii, which would give the wave count an unusual look at the daily chart level.
This last idea is an alternate to consider all possibilities.
BEAR ELLIOTT WAVE COUNT
DAILY CHART
Click chart to enlarge.
A big impulse down must begin, for this bear wave count, so a series of overlapping first and second waves should now be complete. The idea for the bull wave count does not work for this bear wave count.
A new low below 1,370.58 would invalidate the bull wave count confirming a huge market crash. Before that price point is passed though, structure should be a strong indication that this bear wave count would be correct. It is supported by regular technical analysis at the monthly chart level.
TECHNICAL ANALYSIS
DAILY CHART
Click chart to enlarge. Chart courtesy of StockCharts.com.
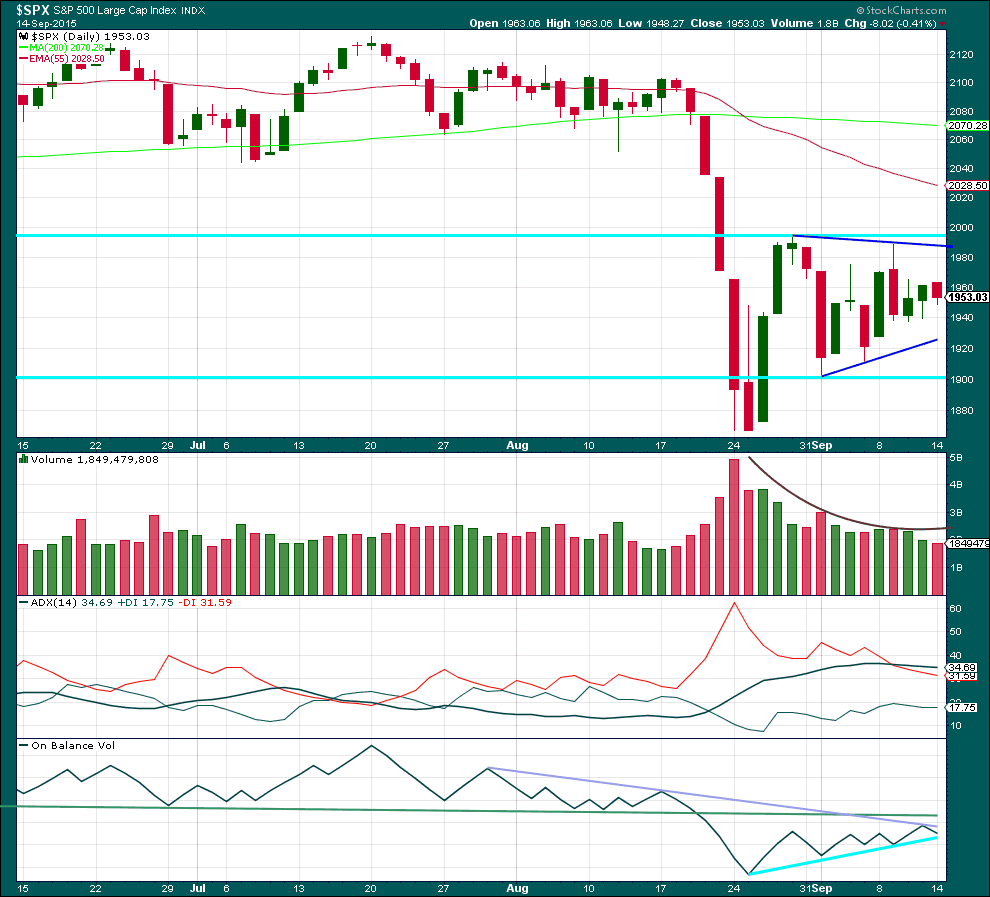
Daily: Another small body on lighter volume again looks corrective. The consolidation continues to mature. The breakout will come; I am confident it is most likely to be down.
ADX is flat indicating the market is not currently trending. ADX does tend to be a lagging indicator.
I have redrawn the purple line on On Balance Volume because the last line was breached. The green line is more technically significant because it is more shallow, longer held and tested more often. OBV should find resistance at that line, if it comes up to touch it. A break below the shorter held bright aqua blue line on OBV would be further bearishness. If OBV turns down from here, then that would strengthen the resistance of the purple line as it is now drawn. OBV is being squashed between the purple downwards sloping line and the upwards bright blue line. The breakout should come very soon.
The sloping purple lines showing some support and resistance first need to be breached for a price breakout. An upwards breach is not expected, but is a slim possibility (only in the sense that anything is possible). A breach of the lower line is expected. When price breaks above or below the horizontal aqua blue lines, then that would provide strong confirmation of a breakout. The breakout should come on a day with increased volume, this is especially so for any upwards breakout. But to the downside the market can fall of its own weight.
If I wanted to see anything bullish in this whole picture, I could say that within this recent sideways movement the strongest day’s volume is the first day which had highest volume. But that really would be stretching credulity, because as price rose for the first three days of the correction volume fell. It’s not really bullish at all.
A note on Dow Theory: for the bear wave count I would wait for Dow Theory to confirm a huge market crash. So far the industrials and the transportation indices have made new major swing lows, but the S&P500 and Nasdaq have not.
S&P500: 1,820.66
Nasdaq: 4,116.60
DJT: 7,700.49 – this price point was breached.
DJIA: 15,855.12 – this price point was breached.
This analysis is published about 11:18 p.m. EST.
It looks like the third scenarios on the hourly chart is playing out.
Yes, visually looks like hourly lll scenario, but….EW gurus may count tiny waves and come up with a different answer. Overall this sideways probably going to end Thursday on Fed decision.
The triangle is still valid, e has not move above c at 1,988.63.
I’ll have two hourly charts today.
The nine wave triangle is wrong, but the other two ideas remain valid.
This thrust from the triangle is quite typical and should be the final wave of the correction.
I have often wondered how central bank intervention affects the Elliott waves. So far the motive waves down have completed in five days and the corrective waves have lasted several weeks and this time distortion may be one result. This may be the pattern for the long bear market ahead as central banks fight tooth and nail to keep the market inflated. At the completion of five down I expect a herculean effort to attempt to retake the old highs.