
The Dead Cat Bounce continues and remains below the invalidation point.
I have two hourly charts for you today.
Summary: A Dead Cat Bounce is most likely still unfolding and may end tomorrow. If the Dead Cat Bounce is a fourth wave, then it may end about 1,996, but if it’s another deep second wave, then the target is 2,008 – 2,010. The final invalidation point for it is at 2,103.47. When the small channel on the hourly chart is breached by clear downwards (not sideways) movement, then it may be over. A new low below 1,954.09 would provide some price confirmation that it is over.
To view the last weekly chart click here.
Changes to last analysis are bold.
ELLIOTT WAVE COUNT
Click chart to enlarge.
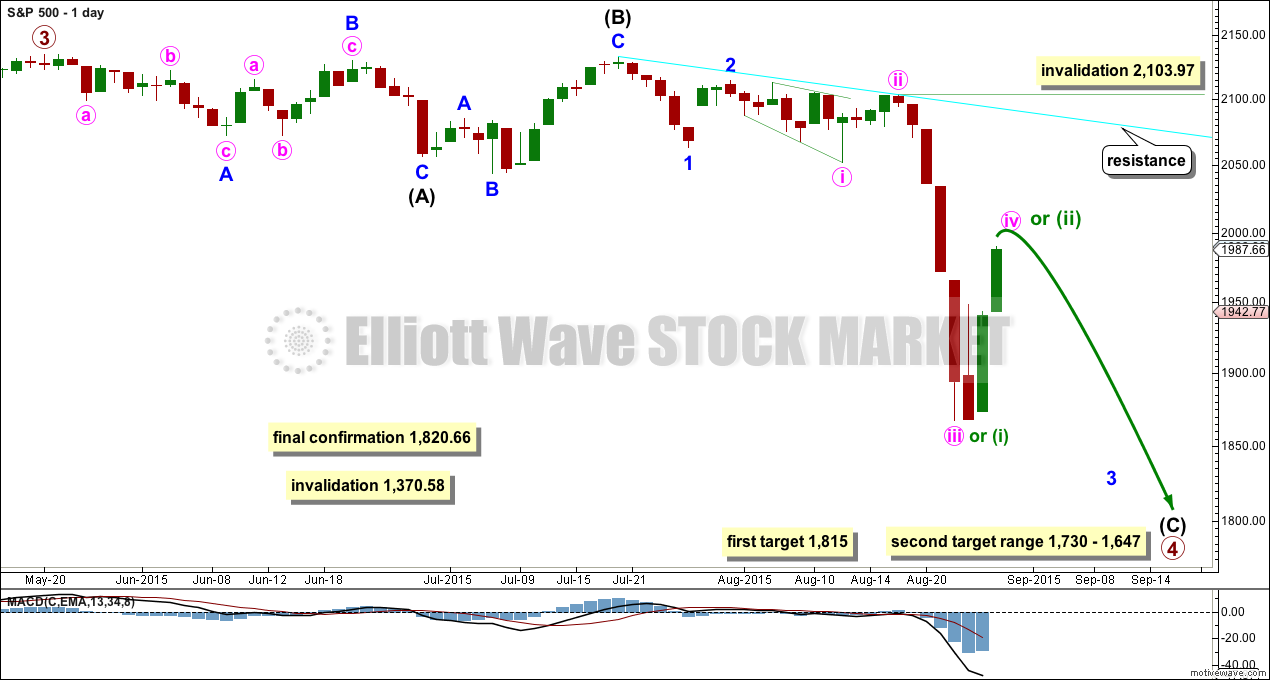
The S&P has seen a primary degree (or for the bear count below a Super Cycle degree) trend change.
Primary wave 2 was a relatively shallow 0.41 zigzag lasting 12 weeks. Primary wave 4 may be more shallow, most likely to be a flat, combination or triangle, and may be longer lasting than primary wave 2 as these types of sideways corrective structures tend to be more time consuming than zigzags. Primary wave 4 may complete in a total Fibonacci 21 weeks. So far primary wave 4 is in its 14th week, but it may not exhibit a Fibonacci duration because the S&P does not reliably do this. Time estimates may only be taken as a very rough guide.
Primary wave 4 may reach down into the fourth wave of one lesser degree price range from 1,730 to 1,647, but it may not be that deep. It may end only about the 0.236 Fibonacci ratio of primary wave 3 at 1,815.
Within primary wave 4, it may be that intermediate waves (A) and (B) are both complete as three wave structures indicating a flat may be unfolding. Intermediate wave (C) down must be a five wave structure; it looks like it is unfolding as an impulse. For now I will leave this degree as is, but depending on where intermediate wave (C) ends I may move it back down one degree. It is also possible that only minor wave A may be unfolding as a flat correction.
If this impulse does not bring price down to the target range or the lower edge of the big channel on the weekly chart, then it may only be intermediate wave (A) of a bigger flat for primary wave 4. If it does bring price lower to the target range, then it may be primary wave 4 in its entirety.
Sideways movement on the hourly chart looks like minute wave iv has arrived. Because minute wave ii shows up clearly on the daily chart, I would expect minute wave iv to also take a few days and show up. This would give the impulse for minor wave 3 the “right look”. Minute wave iv may not move into minute wave i price territory above 2,052.09.
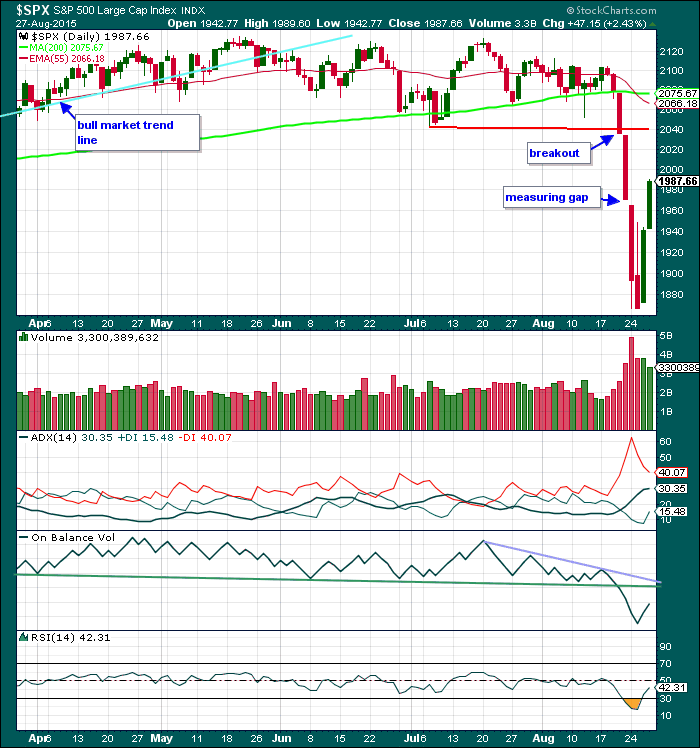
This wave count now has some confirmation at the daily chart level with a close more than 3% of market value below the long held bull market trend line.
Full and final confirmation would come with:
1. A clear five down on the daily chart.
2. A new low below 1,820.66.
As each condition is met further confidence may be had in the bigger picture for this wave count.
Primary wave 4 may not move into primary wave 1 price territory below 1,370.58. Invalidation of this bull wave count (still bullish at cycle degree) would be confirmation of the bear wave count.
MAIN HOURLY ELLIOTT WAVE COUNT
Click chart to enlarge.
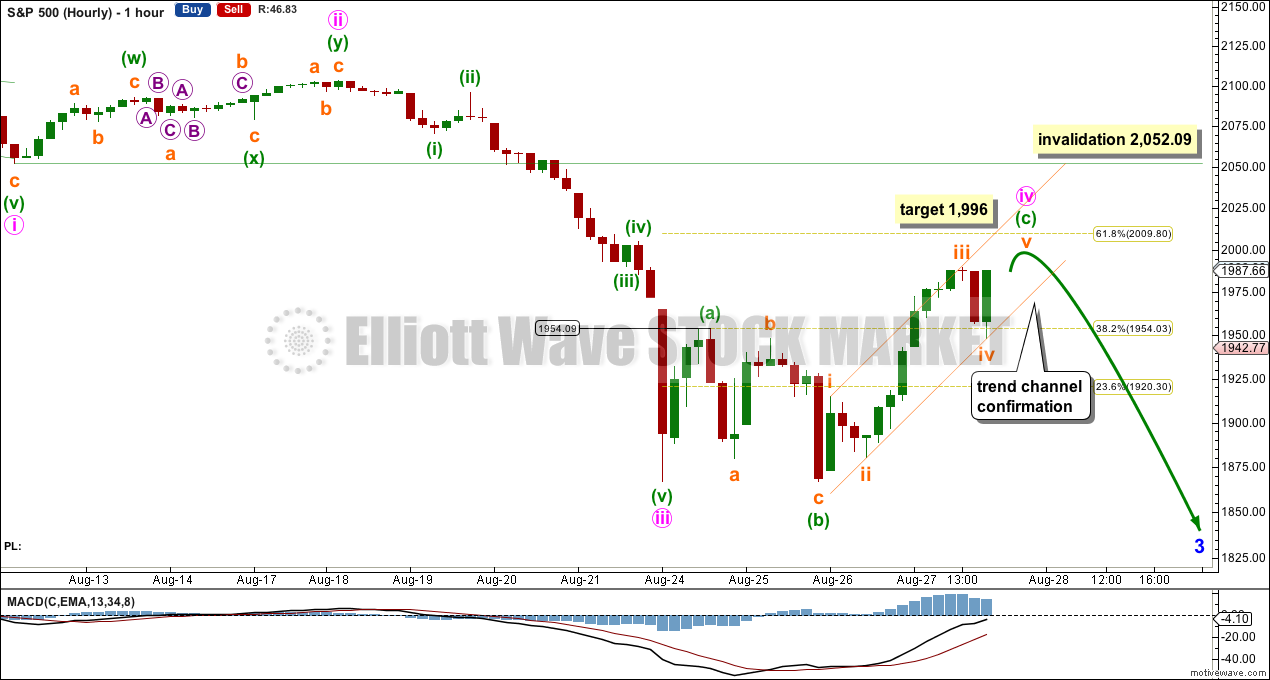
There are two possibilities for this correction.
The first possibility here is that the correction may be a fourth wave.
However, I am concerned that there is a lack of alternation in depth between this fourth wave and its counterpart second wave. Minute wave ii was a deep 0.83 double zigzag. Minute wave iv is now approaching the 0.618 Fibonacci ratio of minute wave iii, and exhibits alternation in structure as a flat correction.
Minute wave iv for this wave count may be seen as a regular flat correction. Minuette wave (a) can be seen as a three on the five minute chart (it also fits as a five which is how the second hourly chart sees it). If this is a regular flat, then the C wave within it is much longer than normal. Regular flats normally fit nicely within their trend channels, but this one does not.
At 1,996 subminuette wave v would reach equality in length with subminuette wave i.
Draw a small channel about minuette wave (c) within minute wave iv as shown. When this channel is clearly breached by downwards movement, not sideways, that may provide earliest confirmation that minute wave iv is over and the next impulse down is underway.
Minute wave iv may not move into minute wave i price territory above 2,052.09.
Please note: although I have labelled this first wave count “main” and the one below “alternate”, that’s an accident of one coming before the other. In this case I am unsure which is more likely, and if asked to pick a winner I may pick the alternate below.
ALTERNATE HOURLY ELLIOTT WAVE COUNT
Click chart to enlarge.
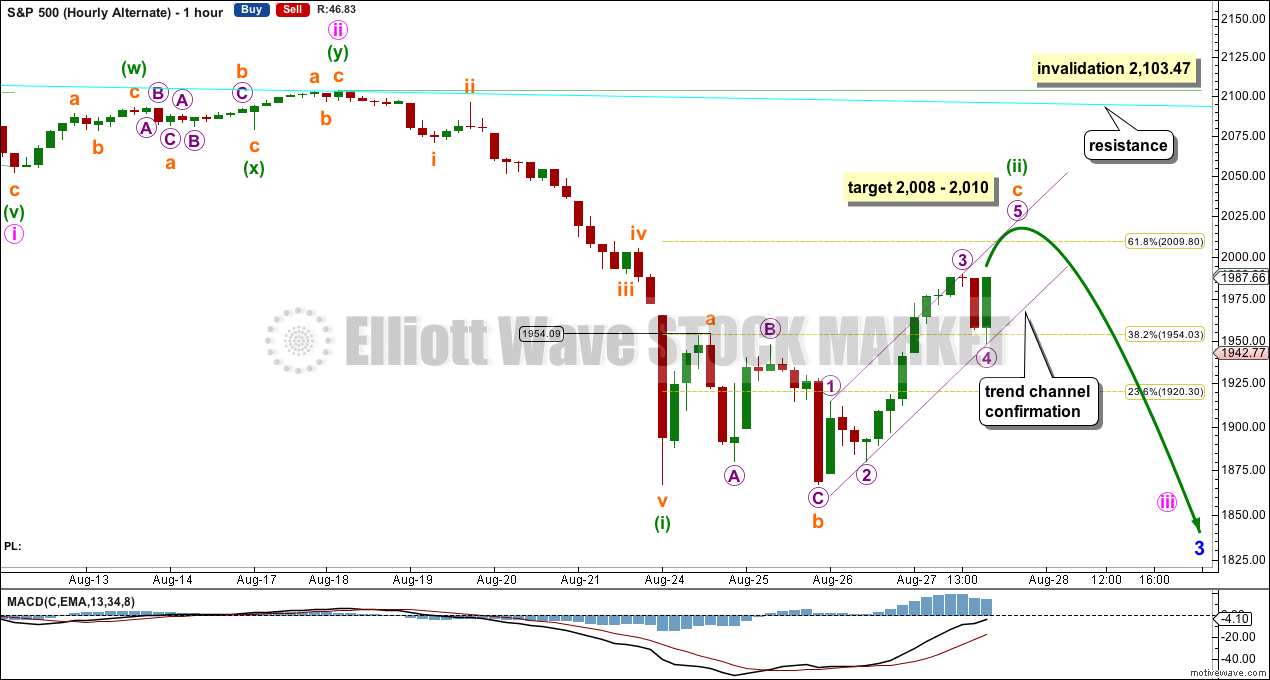
It is also possible that this deep correction is another second wave. That would explain the depth of it, and the odd length of subminuette wave c in comparison to subminuette wave a. If this structure is a zigzag rather than a regular flat, then the C wave may be longer.
At 2,008 subminuette wave c would reach 1.618 the length of subminuette wave a. At 2,010 minuette wave (ii) would end at the 0.618 Fibonacci ratio of minuette wave (i). This gives a 2 point target zone for this correction to end tomorrow.
To the upside use the bright aqua blue resistance line copied over here from the daily chart, if price moves that high.
Minuette wave (ii) may not move beyond the start of minuette wave (i) above 2,103.47.
To the downside a new low below 1,954.09 may not be a fourth wave correction within a new impulse unfolding upwards, because at that stage a fourth wave would be in first wave price territory. A new low below 1,954.09 provides some price confirmation that the correction is likely over and the next wave down is likely underway.
BEAR ELLIOTT WAVE COUNT
Click chart to enlarge.
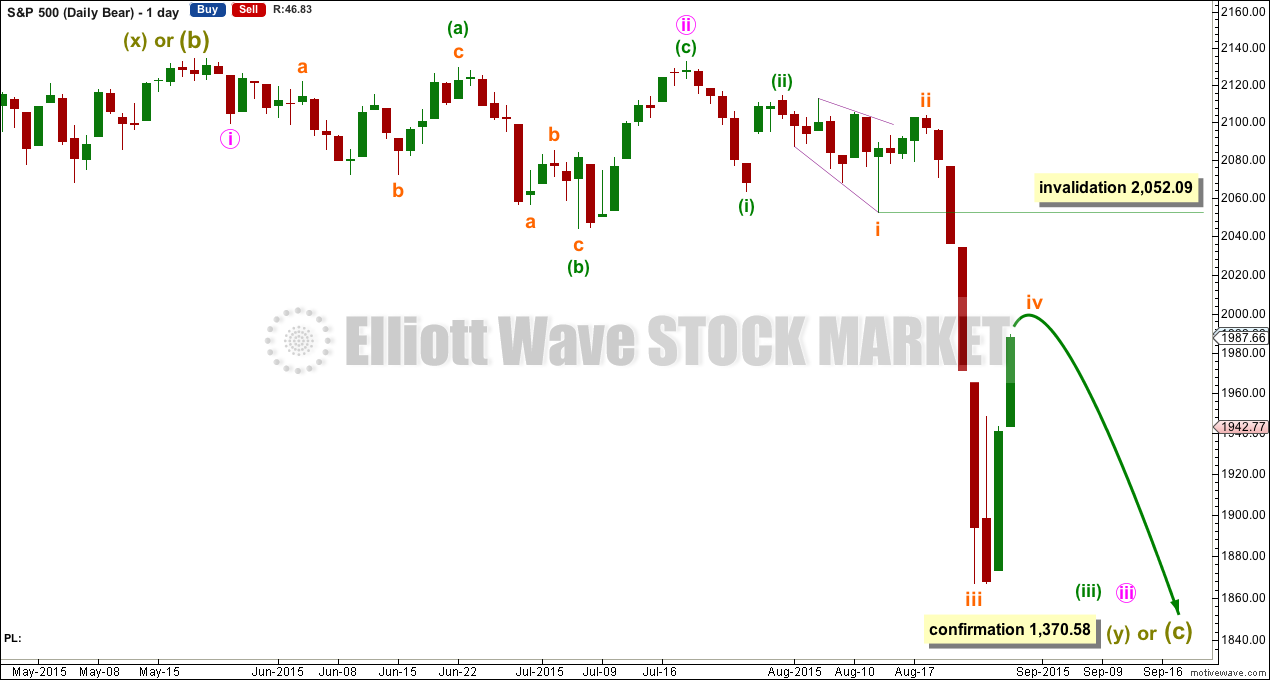
The subdivisions within cycle waves a-b-c are seen in absolutely exactly the same way as primary waves 1-2-3 for the main wave count.
In line with recent Grand Super Cycle wave analysis, I have moved the degree of labelling for the bear wave count all up one degree.
This bear wave count expects a Super Cycle wave (c) to unfold downwards for a few years, and if it is a C wave it may be devastating. It may end well below 666.79.
However, if this wave down is a Super Cycle wave (y), then it may be a time consuming repeat of the last big flat correction with two market crashes within it, equivalent to the DotCom crash and the recent Global Financial Crisis, and it may take another 8-9 years to unfold sideways.
For this bear wave count a big impulse down must begin, so a series of overlapping first and second waves should now be complete. The new idea for the first wave count does not work for this bear wave count.
A new low below 1,370.58 would invalidate the first wave count confirming a huge market crash. Before that price point is passed though, structure should be a strong indication that this bear wave count would be correct. It is supported by regular technical analysis at the monthly chart level.
TECHNICAL ANALYSIS
Click chart to enlarge. Chart courtesy of StockCharts.com.
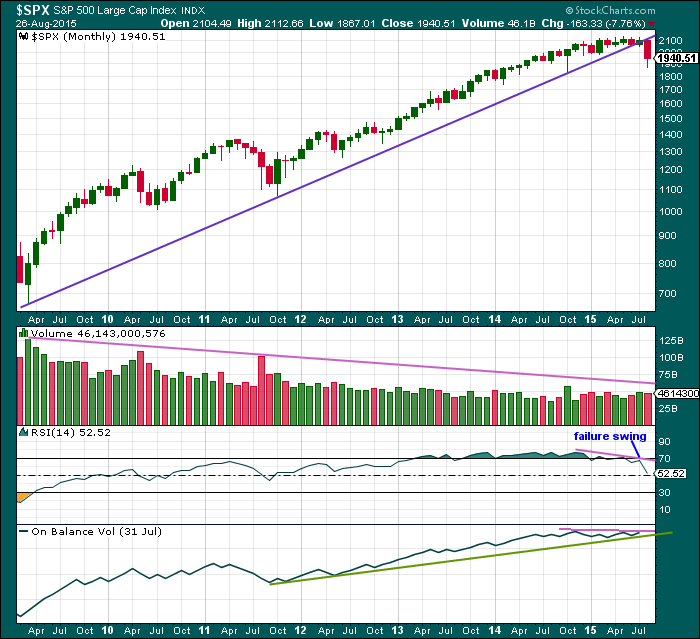
Monthly Chart: A long held trend line from the end of the big low at 666.79 in March 2009, to the next big swing low at 1,074.77 in October 2011, has been breached and now provides resistance.
Volume has been falling during this bull market spanning six years and five months. This rise in price is not supported by volume, so is suspicious at the monthly chart level.
Back to November 2014, there is now double negative divergence between price and RSI at the end of this movement. This pattern was last seen just prior to the DotCom crash and the GFC. In both of those instances there was also a failure swing by RSI, which appears here too.
On Balance Volume shows slight negative divergence with price.
At the monthly chart level, this regular technical analysis favours the bear wave count
The last two bear markets for the S&P, that of the Dotcom crash from September 2000, to October 2002, and the Global Financial Crisis from October 2007, to March 2009, were reliably indicated as complete by RSI on the weekly and monthly chart. I will use this indicator this time to see when this bear market could be complete.
As each of those last two bear markets ended, RSI showed oversold on the monthly chart level plus had one divergence with the final month: as price moved lower RSI turned up. That was the end.
So far RSI is nowhere near oversold. There is plenty of room for price to fall.
Click chart to enlarge. Chart courtesy of StockCharts.com.
Daily Chart: Today’s strong upwards move in price comes with decreasing volume. The rise in price is not supported by volume and should be suspicious.
ADX is still very slightly pointing upwards and the -DX line is still above the +DX line. There is still a trend and it is still downwards.
On Balance Volume remains below its green trend line. That line should provide resistance and may be the most useful indicator to show when this Dead Cat Bounce ends. If OBV comes up to touch that trend line, then it may end there.
A note on Dow Theory: for the bear wave count I would wait for Dow Theory to confirm a huge market crash. So far the industrials and the transportation indices have made new major swing lows, but the S&P500 and Nasdaq have not.
S&P500: 1,820.66
Nasdaq: 4,116.60
DJT: 7,700.49 – this price point was breached.
DJIA: 15,855.12 – this price point was breached.
This analysis is published about 10:27 p.m. EST.
Looks like intermediate 1 is done for oil. Lara are you planning to do an analysis on oil this week on you gold website?
Yes.
The pattern seems to be an ongoing series of first and second waves to misdirect market participants. The wait for the downdraft gets to be interminable and lulls everyone to sleep it appears. Could the same thing be happening with this last move up?
I think so.
Volume is again lower for another green daily candlestick.
Volume consistently supports a downwards trend at least short term.
I think next week may be explosive again!
I see in the “news” (local New Zealand news anyway) repeated refusal to entertain the idea of a potential bear market. At the monthly chart level this looks pretty clear and stark to me: volume, RSI divergence and trend lines all point to a bear market beginning here which should be bigger than any corrections in the last 6.5 years. But market analyst opinion I’m seeing in the mainstream NZ media insists it’s just another small correction and the message is “don’t panic”.
Last time we saw a big bear market a lot of people saw their retirement savings and investments wiped out, investment companies were found to be dodgy and lost clients money. Trying to ride out a bear market, staying invested in it, does not usually end well. If I’m right here a lot of people may lose a lot of money.