
Sideways movement, with short term upwards movement to 1,954, was expected.
Summary: A Dead Cat Bounce is most likely unfolding, which should continue for another one to few days and remain below 2,052.09. The downwards trend should resume when the bounce is done.
To view the last weekly chart click here.
Changes to last analysis are bold.
ELLIOTT WAVE COUNT
Click chart to enlarge.
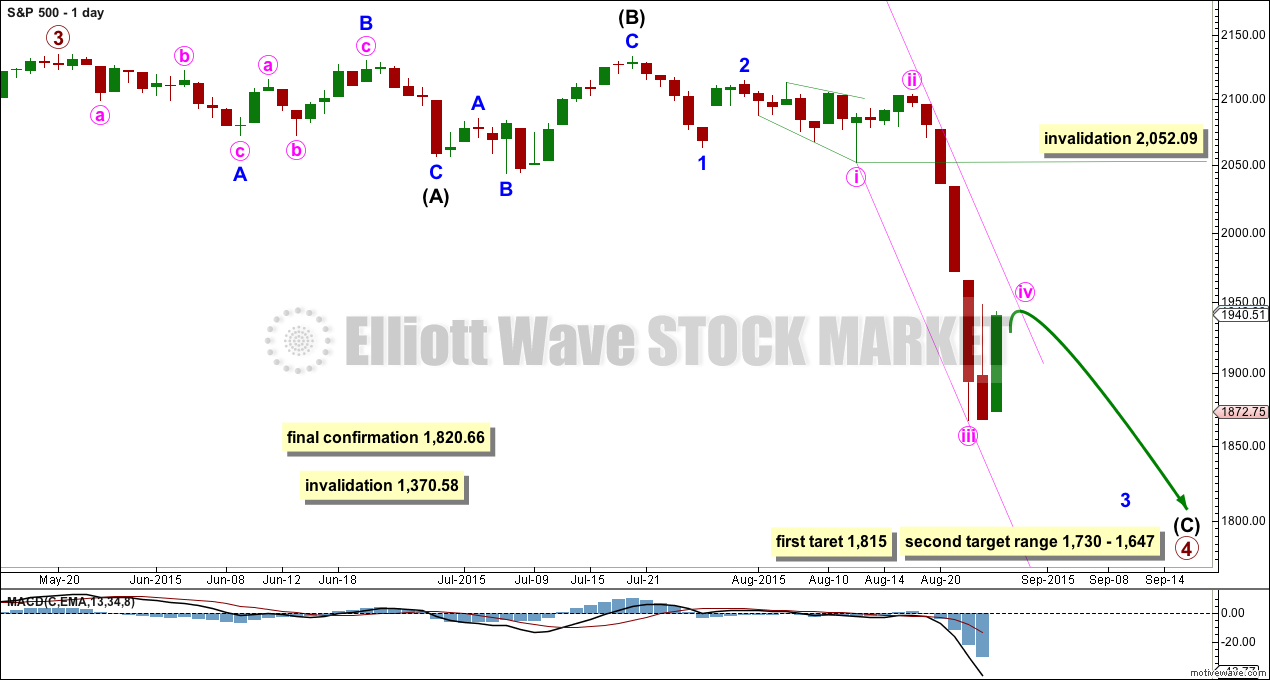
The S&P has seen a primary degree (or for the bear count below a Super Cycle degree) trend change.
Primary wave 2 was a relatively shallow 0.41 zigzag lasting 12 weeks. Primary wave 4 may be more shallow, most likely to be a flat, combination or triangle, and may be longer lasting than primary wave 2 as these types of sideways corrective structures tend to be more time consuming than zigzags. Primary wave 4 may complete in a total Fibonacci 21 weeks. So far primary wave 4 is in its 14th week, but it may not exhibit a Fibonacci duration because the S&P does not reliably do this. Time estimates may only be taken as a very rough guide.
Primary wave 4 may reach down into the fourth wave of one lesser degree price range from 1,730 to 1,647, but it may not be that deep. It may end only about the 0.236 Fibonacci ratio of primary wave 3 at 1,815.
Within primary wave 4, it may be that intermediate waves (A) and (B) are both complete as three wave structures indicating a flat may be unfolding. Intermediate wave (C) down must be a five wave structure; it looks like it is unfolding as an impulse. For now I will leave this degree as is, but depending on where intermediate wave (C) ends I may move it back down one degree. It is also possible that only minor wave A may be unfolding as a flat correction.
If this impulse does not bring price down to the target range or the lower edge of the big channel on the weekly chart, then it may only be intermediate wave (A) of a bigger flat for primary wave 4. If it does bring price lower to the target range, then it may be primary wave 4 in its entirety.
Sideways movement on the hourly chart looks like minute wave iv has arrived. Because minute wave ii shows up clearly on the daily chart, I would expect minute wave iv to also take a few days and show up. This would give the impulse for minor wave 3 the “right look”. Minute wave iv may not move into minute wave i price territory above 2,052.09.
This wave count now has some confirmation at the daily chart level with a close more than 3% of market value below the long held bull market trend line.
Full and final confirmation would come with:
1. A clear five down on the daily chart.
2. A new low below 1,820.66.
As each condition is met further confidence may be had in the bigger picture for this wave count.
Primary wave 4 may not move into primary wave 1 price territory below 1,370.58. Invalidation of this bull wave count (still bullish at cycle degree) would be confirmation of the bear wave count.
Click chart to enlarge.
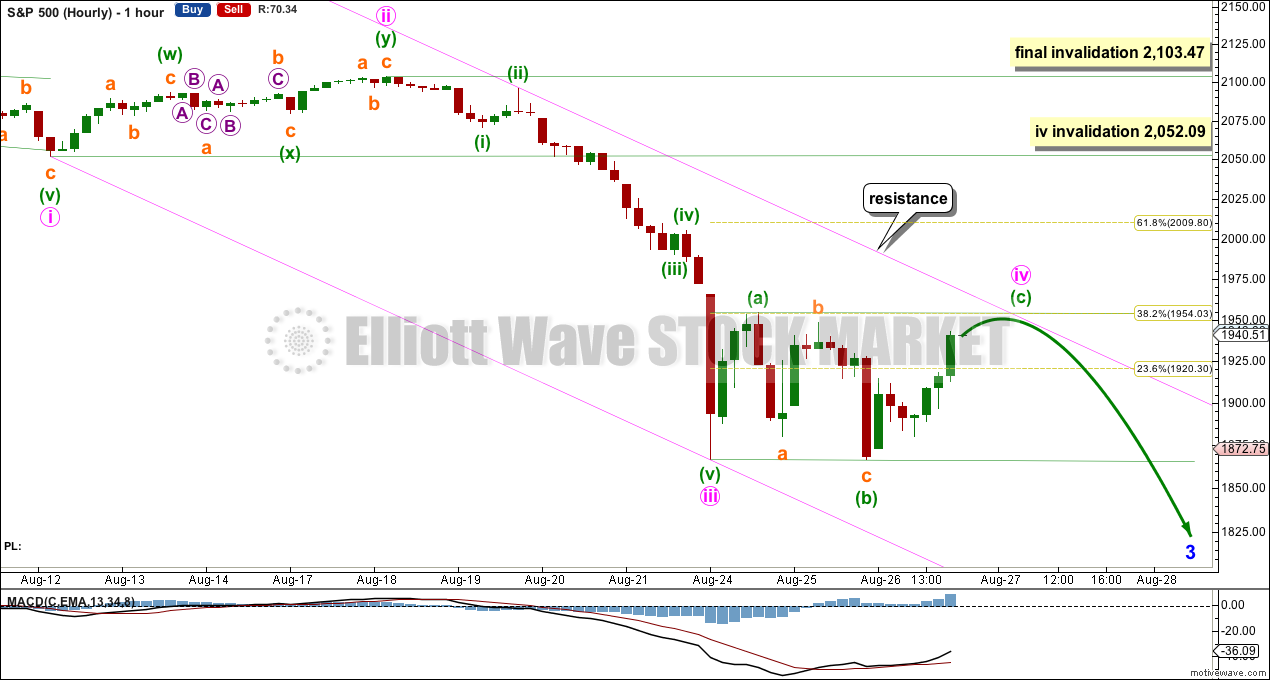
Minute wave iv is likely to exhibit alternation with minute wave ii. Minute wave ii was a deep 0.83 double zigzag. Minute wave iv may be expected to be a more shallow flat, combination or triangle. It may end at or close to the 0.382 Fibonacci ratio of minute wave iii at 1,954.
I am so far labelling minute wave iv as a regular flat correction, but most importantly it does not have to unfold like this. It may equally be a sideways contracting triangle, a double flat or double combination. Overall, all I can say with some confidence today is it is most likely complete. This is most likely a smaller correction within a downwards trend, a bear market rally.
Minute wave iv may find resistance at the upper edge of the channel. If price touches that trend line, then minute wave iv may end there. But fourth waves are not always contained nicely within their channels, which is why Elliott had a second technique to redraw the channel when the fourth wave overshoots the channel. The upper pink trend line may not be used as a definitive guide to when this fourth wave correction is over.
Structure will tell us when this fourth wave is over. So far a completed corrective structure cannot yet be seen. When it may be complete then this fourth wave may be over.
Minute wave iv may not move into minute wave i price territory above 2,052.09.
If we are surprised by a strong movement to the upside, then it may be that minute wave iii was not over. Upwards movement, if it is very deep, would more likely be another second wave correction. I would move the degree of labelling within minute wave iii all down one degree, so a following second wave correction may not move beyond the start of its first wave above 2,103.47.
BEAR ELLIOTT WAVE COUNT
Click chart to enlarge.
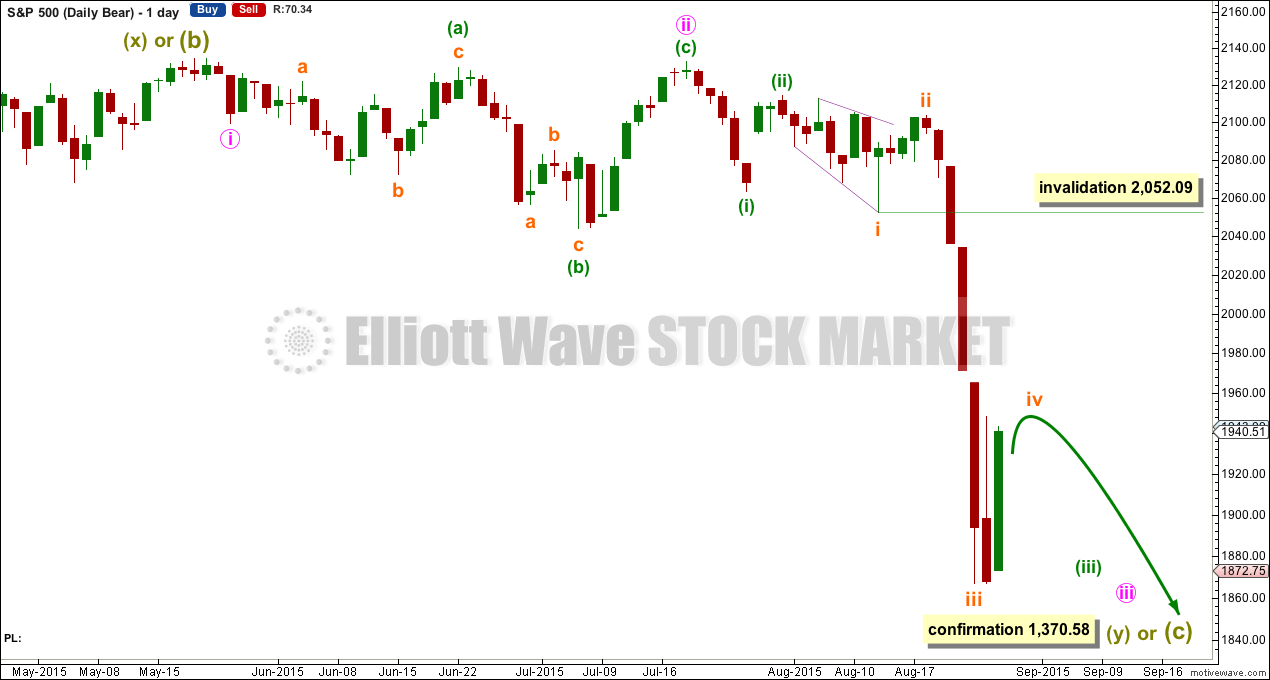
The subdivisions within cycle waves a-b-c are seen in absolutely exactly the same way as primary waves 1-2-3 for the main wave count.
In line with recent Grand Super Cycle wave analysis, I have moved the degree of labelling for the bear wave count all up one degree.
This bear wave count expects a Super Cycle wave (c) to unfold downwards for a few years, and if it is a C wave it may be devastating. It may end well below 666.79.
However, if this wave down is a Super Cycle wave (y), then it may be a time consuming repeat of the last big flat correction with two market crashes within it, equivalent to the DotCom crash and the recent Global Financial Crisis, and it may take another 8-9 years to unfold sideways.
For this bear wave count a big impulse down must begin, so a series of overlapping first and second waves should now be complete. The new idea for the first wave count does not work for this bear wave count.
A new low below 1,370.58 would invalidate the first wave count confirming a huge market crash. Before that price point is passed though, structure should be a strong indication that this bear wave count would be correct. It is supported by regular technical analysis at the monthly chart level.
TECHNICAL ANALYSIS
Click chart to enlarge. Chart courtesy of StockCharts.com.
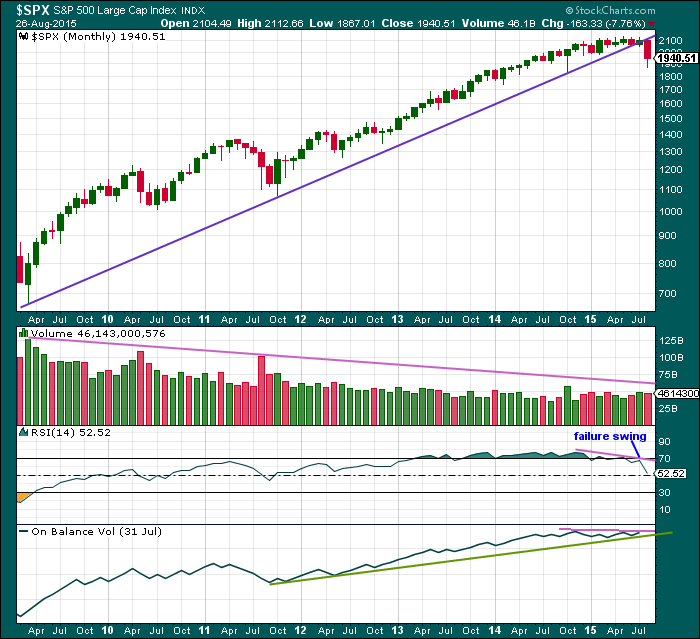
Monthly Chart: A long held trend line from the end of the big low at 666.79 in March 2009, to the next big swing low at 1,074.77 in October 2011, has been breached and now provides resistance.
Volume has been falling during this bull market spanning six years and five months. This rise in price is not supported by volume, so is suspicious at the monthly chart level.
Back to November 2014, there is now double negative divergence between price and RSI at the end of this movement. This pattern was last seen just prior to the DotCom crash and the GFC. In both of those instances there was also a failure swing by RSI, which appears here too.
On Balance Volume shows slight negative divergence with price.
At the monthly chart level, this regular technical analysis favours the bear wave count
The last two bear markets for the S&P, that of the Dotcom crash from September 2000, to October 2002, and the Global Financial Crisis from October 2007, to March 2009, were reliably indicated as complete by RSI on the weekly and monthly chart. I will use this indicator this time to see when this bear market could be complete.
As each of those last two bear markets ended, RSI showed oversold on the monthly chart level plus had one divergence with the final month: as price moved lower RSI turned up. That was the end.
So far RSI is nowhere near oversold. There is plenty of room for price to fall.
Click chart to enlarge. Chart courtesy of StockCharts.com.
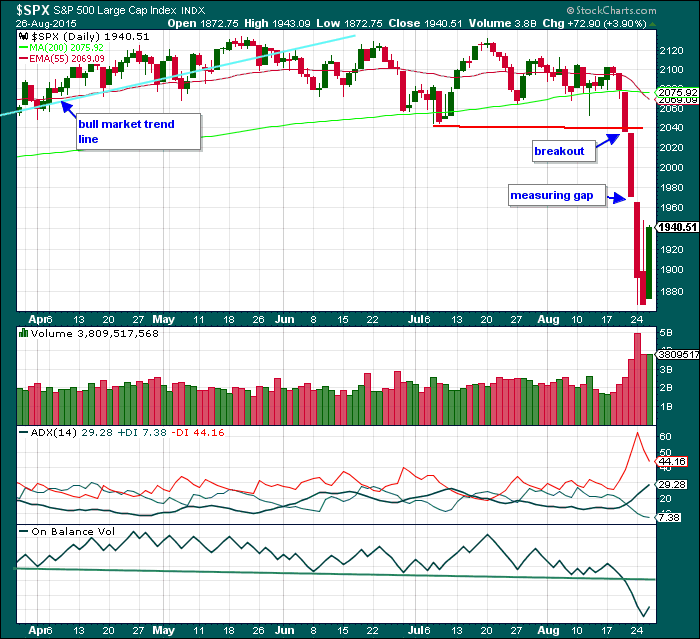
Daily Chart: Today a green candlestick comes on very slightly increased volume, but volume remains lower than the prior strong downwards day of 25th August.
ADX is still pointing upwards and the -DX line is still above the +DX line; there is still a trend and it is still downwards.
On Balance Volume remains below its green trend line. That line should provide resistance and may be the most useful indicator to show when this Dead Cat Bounce ends. If OBV comes up to touch that trend line, then it may end there.
A note on Dow Theory: for the bear wave count I would wait for Dow Theory to confirm a huge market crash. So far the industrials and the transportation indices have made new major swing lows, but the S&P500 and Nasdaq have not.
S&P500: 1,820.66
Nasdaq: 4,116.60
DJT: 7,700.49 – this price point was breached.
DJIA: 15,855.12 – this price point was breached.
This analysis is published about 09:43 p.m. EST.
Lara, nice work. The S&P behaviour these past days is nearly as crystal-clear as reading a chapter on any EW book; waves and counts are clear, EW channel works acceptably,…
So, I have a direct question: what are the odds that a final minute five doesn´t show up as expected in order to complete wave A/wave 3?
Today, so far, S&P has surpassed the 38.2% fib retrace and is approaching the 50% fib retrace with 1.90% increase…….BUT….VIX is barely moving, which to me could mean that VIX is NOT confirming the expectation of a continuing upward movement – maybe because minute five down is almost ready to unfold.
What do you think?
Thanks
I’m guessing you mean “what if the final subminuette v doesn’t show up”?
Because you’re seeing an incomplete five up on the hourly chart as I am. Which would be minuette (c) to complete the flat of minute iv.
What are the chances? Possible. It could be over already, it would be slightly truncated. I’ll be using a small channel on the hourly chart to tell when this Dead Cat Bounce is over. And I’ll have an alternate hourly chart for you all today.
New member here! The analysis is fascinating, very detailed, a lot to get my head around. I’d be keen to understand how others use the info for trading purposes if I can? I’ve subscribed to other EW analysis services before and have struggled as hindsight seems to confirm every move, although trades need to be in place before the move really. Any help would be massively appreciated. Thanks
When you see a trend stay with it.
Full disclosure: I do trade but I won’t trade the S&P500, it’s way too volatile for my liking, particularly during a bear market. This thing can move so fast, and the bounces can wipe you out even if you’re trying to stay with the trend. I’d short if if I had the nerve, but I like a life with less stress than that. I analyse it because I’ve had so many people request it, and now they’re relying on me to keep doing it. I’m happy to because I love EW.
When I trade (NZDUSD, Oil and sometimes Gold, EURUSD mostly) I always wait for confirmation of a trend change. I wait for a trend line breach then a throwback and enter there. But this fast moving bear market probably won’t give time for such a careful patient entry.
Good luck! I’ll do my best to pick resistance lines and how / what to look for regarding confirmation. If any other more experienced traders here who are used to trading this market would like to provide advice please do so.
Lara you are an absolute genius! I was puzzling over the wave action and did not consider that we may be looking at just one of three down. I have an inkling that we may indeed be seeing a second wave up. It would explain a lot, including the behaviour of the VIX. The FED jawboning about rates today was what I thought would come at the outset of a second wave race higher but the second in a third down makes things most intriguing! If this is what is happening, the third of a third wave down is going to be outright pandemonium, and very much in keeping with the kind of market action typical of September and October, which is when I was expecting the real action to get started. Most interesting indeed!
VIX gap to contango narrows. Any comments Vernecarty?
UVXY definitely diverging from VIX which suggests increasing fear for the medium to long term outlook compared to short term. UVXY 33 calls I bought at 0.77 now trading at 29.00 but new entry points have been difficult and I got slammed on the puts I bought. Neither UVXY nor VIX declined the way they do after completion of a third wave down so there is something strange going on. My calls expire today so I have to bail but I am hoping for a new interim low if wave two underway.
Before this is all over UVXY is going to trade in the hundreds….
Thanks Vernecarty for the vote of confidence. I wouldn’t go so far as to say I’m a genius. My IQ falls just short of Mensa level, so technically I’m not a genius 🙂
It does look like a second wave correction today. It’s now looking too deep for a fourth wave, that wouldn’t give enough alternation with the second wave depth.