
More downwards movement was expected.
Price did not make a new low although Tuesday’s candlestick is red.
Summary: Sideways movement on lower volume indicates a correction has arrived that is most likely minute wave iv, the Dead Cat Bounce we were waiting for. Minute wave iv may continue sideways for a few days yet. A target for it to end is at 1,954. When it is done the downwards trend should resume.
To view the last weekly chart click here.
Changes to last analysis are bold.
ELLIOTT WAVE COUNT
Click chart to enlarge.
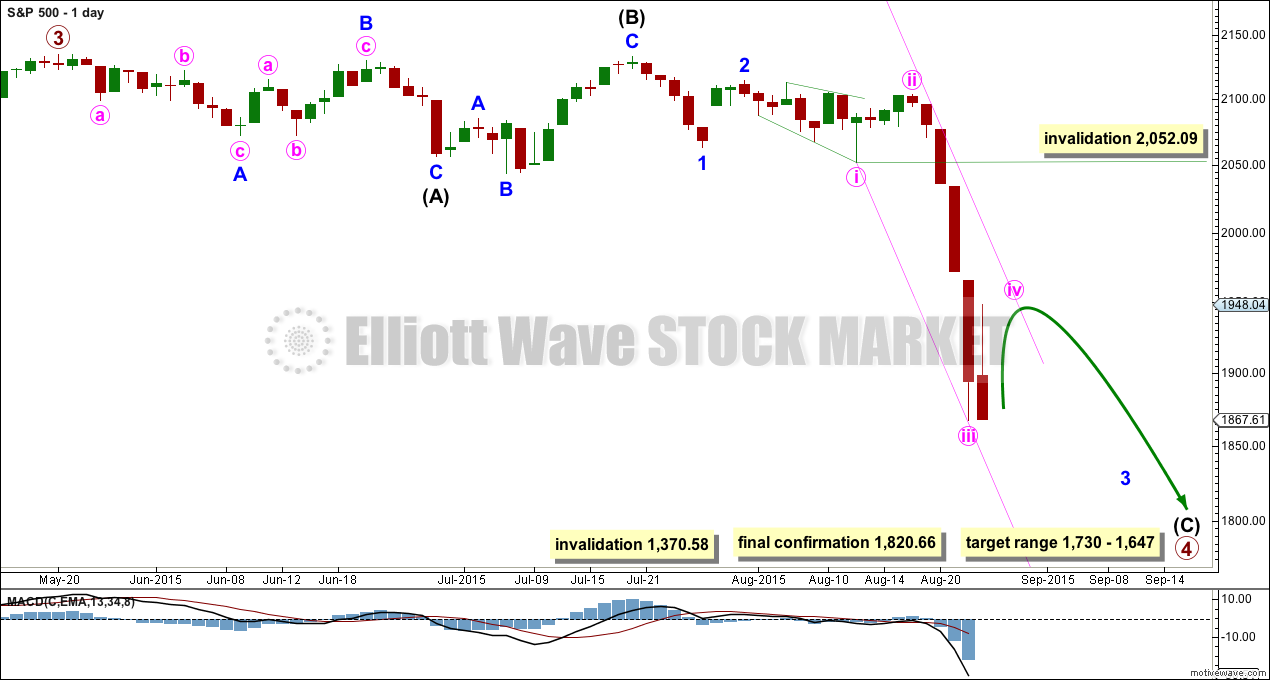
The S&P has seen a primary degree (or for the bear count below a Super Cycle degree) trend change.
Primary wave 2 was a relatively shallow 0.41 zigzag lasting 12 weeks. Primary wave 4 may be more shallow, most likely to be a flat, combination or triangle, and may be longer lasting than primary wave 2 as these types of sideways corrective structures tend to be more time consuming than zigzags. Primary wave 4 may complete in a total Fibonacci 21 weeks. So far primary wave 4 is in its 14th week, but it may not exhibit a Fibonacci duration because the S&P does not reliably do this. Time estimates may only be taken as a very rough guide.
Primary wave 4 may reach down into the fourth wave of one lesser degree price range from 1,730 to 1,647, but it may not be that deep. It may end only about the 0.236 Fibonacci ratio of primary wave 3 at 1,815.
Within primary wave 4, it may be that intermediate waves (A) and (B) are both complete as three wave structures indicating a flat may be unfolding. Intermediate wave (C) down must be a five wave structure; it looks like it is unfolding as an impulse. For now I will leave this degree as is, but depending on where intermediate wave (C) ends I may move it back down one degree. It is also possible that only minor wave A may be unfolding as a flat correction.
If this impulse does not bring price down to the target range or the lower edge of the big channel on the weekly chart, then it may only be intermediate wave (A) of a bigger flat for primary wave 4. If it does bring price lower to the target range, then it may be primary wave 4 in its entirety.
Sideways movement on the hourly chart looks like minute wave iv has arrived earlier than expected. Because minute wave ii shows up clearly on the daily chart, I would expect minute wave iv to also take a few days and show up. This would give the impulse for minor wave 3 the “right look”. Minute wave iv may not move into minute wave i price territory above 2,052.09.
This wave count now has some confirmation at the daily chart level with a close more than 3% of market value below the long held bull market trend line.
Full and final confirmation would come with:
1. A clear five down on the daily chart.
2. A new low below 1,820.66.
As each condition is met further confidence may be had in the bigger picture for this wave count.
Primary wave 4 may not move into primary wave 1 price territory below 1,370.58. Invalidation of this bull wave count (still bullish at cycle degree) would be confirmation of the bear wave count.
Click chart to enlarge.
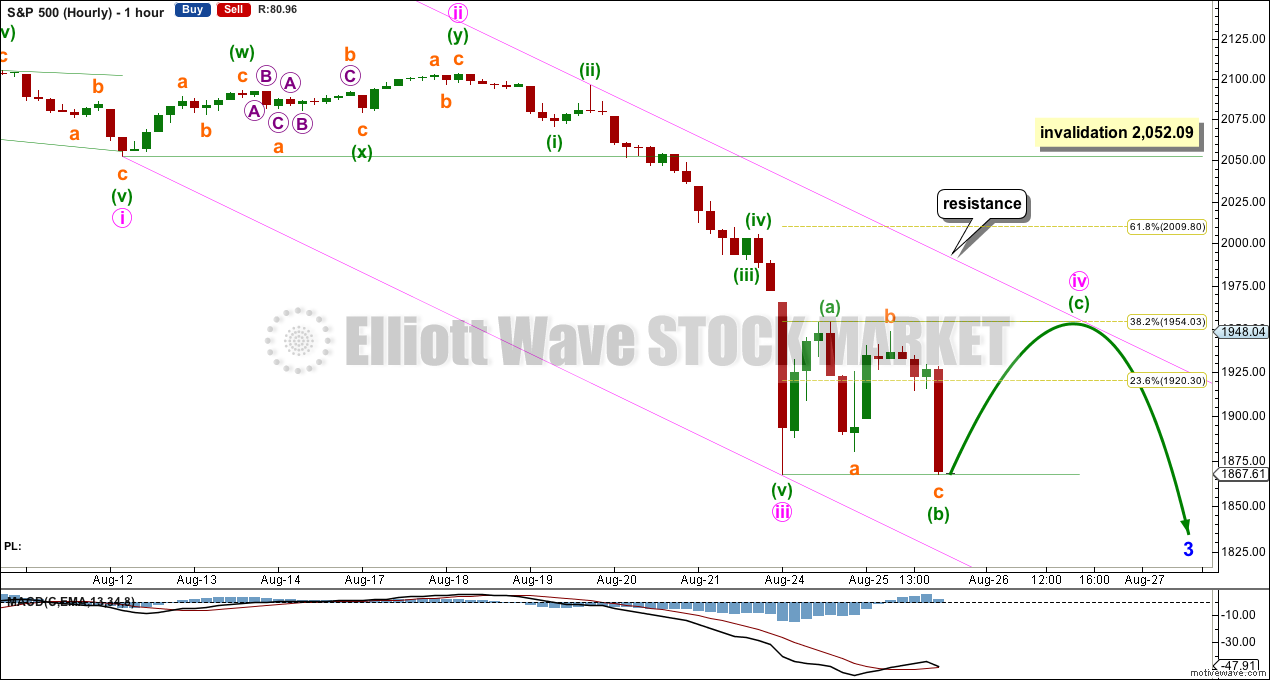
The sideways movement and breach of the channel on yesterday’s hourly chart looks like minute wave iv has arrived already.
There is no Fibonacci ratio between minute waves i and iii. This means that when minute wave v arrives it is very likely to exhibit a Fibonacci ratio to either of i or iii.
I have adjusted the wave count within minute wave iii. Ratios within minute wave iii are: there is no Fibonacci ratio between minuette waves (iii) and (i), and minuette wave (v) is just 1.44 longer than 4.236 the length of minuette wave (i).
Minuette wave ii was a deep 0.83 double zigzag. Given the guideline of alternation, minute wave iv may be expected to be a shallow flat, combination or triangle, and may end about the 0.382 Fibonacci ratio of minute wave iii at 1,954. Flats, combinations and particularly triangles tend to be longer lasting structures than zigzags. Minute wave ii lasted four days, so minute wave iv may be a little longer, maybe a Fibonacci five or eight days in total. So far it has only unfolded for one.
There is not enough upwards movement at the end of Tuesday’s session to confirm that minuette wave (b) must be over. It could continue lower as in an expanded flat, and may make a new low below the start of minute wave iv at 1,867.
BEAR ELLIOTT WAVE COUNT
Click chart to enlarge.
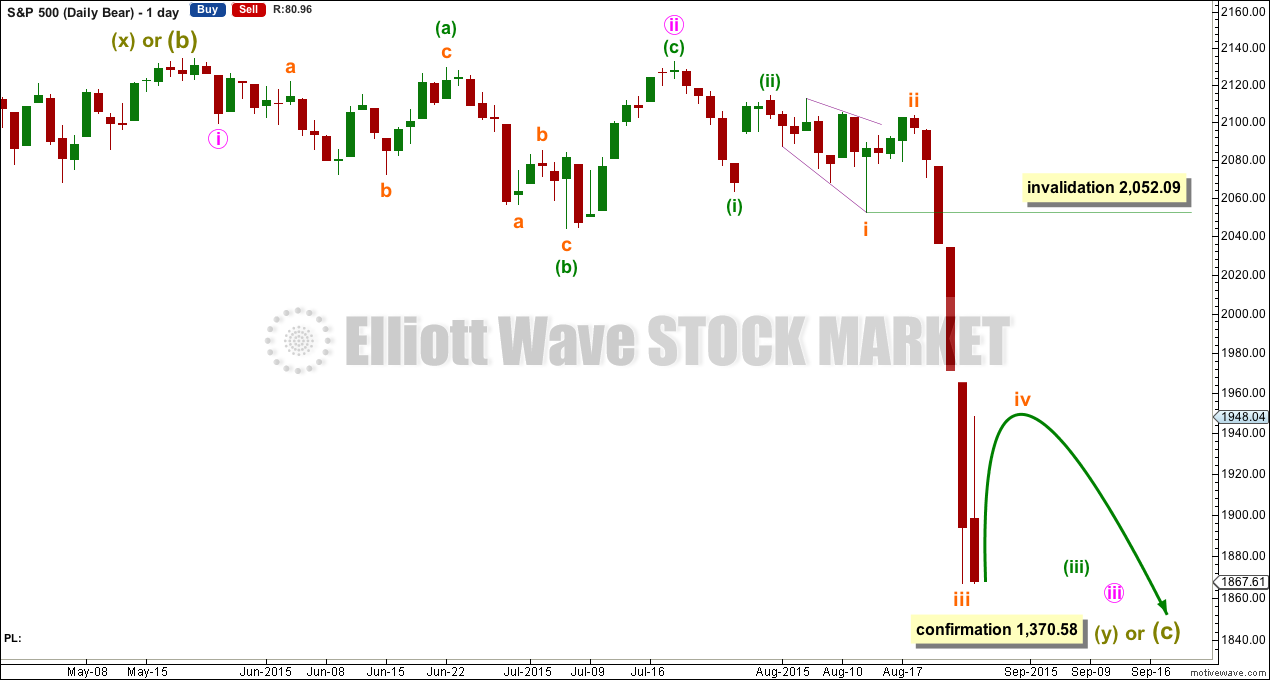
The subdivisions within cycle waves a-b-c are seen in absolutely exactly the same way as primary waves 1-2-3 for the main wave count.
In line with recent Grand Super Cycle wave analysis, I have moved the degree of labelling for the bear wave count all up one degree.
This bear wave count expects a Super Cycle wave (c) to unfold downwards for a few years, and if it is a C wave it may be devastating. It may end well below 666.79.
However, if this wave down is a Super Cycle wave (y), then it may be a time consuming repeat of the last big flat correction with two market crashes within it, equivalent to the DotCom crash and the recent Global Financial Crisis, and it may take another 8-9 years to unfold sideways.
For this bear wave count a big impulse down must begin, so a series of overlapping first and second waves should now be complete. The new idea for the first wave count does not work for this bear wave count.
A new low below 1,370.58 would invalidate the first wave count confirming a huge market crash. Before that price point is passed though, structure should be a strong indication that this bear wave count would be correct. It is supported by regular technical analysis at the monthly chart level.
TECHNICAL ANALYSIS
Click chart to enlarge. Chart courtesy of StockCharts.com.
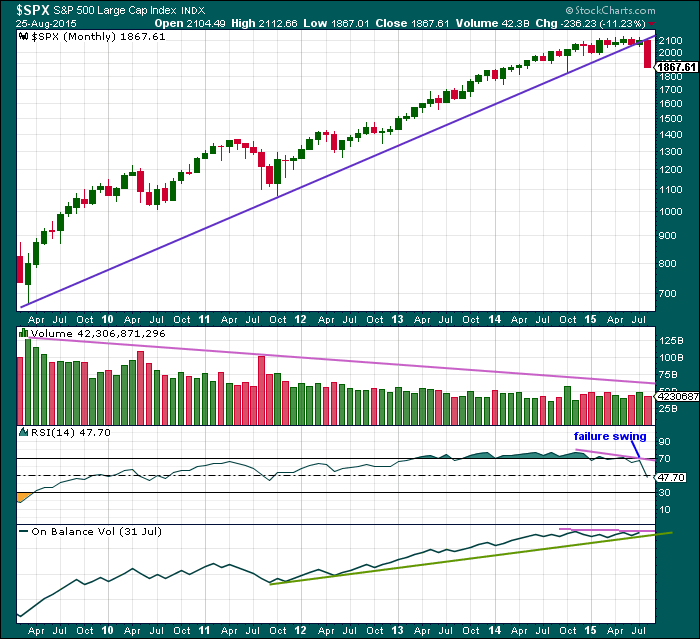
Monthly Chart: A long held trend line from the end of the big low at 666.79 in March 2009, to the next big swing low at 1,074.77 in October 2011, has been breached and now provides resistance.
Volume has been falling during this bull market spanning six years and five months. This rise in price is not supported by volume, so is suspicious at the monthly chart level.
Back to November 2014, there is now double negative divergence between price and RSI at the end of this movement. This pattern was last seen just prior to the DotCom crash and the GFC. In both of those instances there was also a failure swing by RSI, which appears here too.
On Balance Volume shows slight negative divergence with price.
At the monthly chart level, this regular technical analysis favours the bear wave count
The last two bear markets for the S&P, that of the Dotcom crash from September 2000, to October 2002, and the Global Financial Crisis from October 2007, to March 2009, were reliably indicated as complete by RSI on the weekly and monthly chart. I will use this indicator this time to see when this bear market could be complete.
As each of those last two bear markets ended, RSI showed oversold on the monthly chart level plus had one divergence with the final month: as price moved lower RSI turned up. That was the end.
So far RSI is nowhere near oversold. There is plenty of room for price to fall.
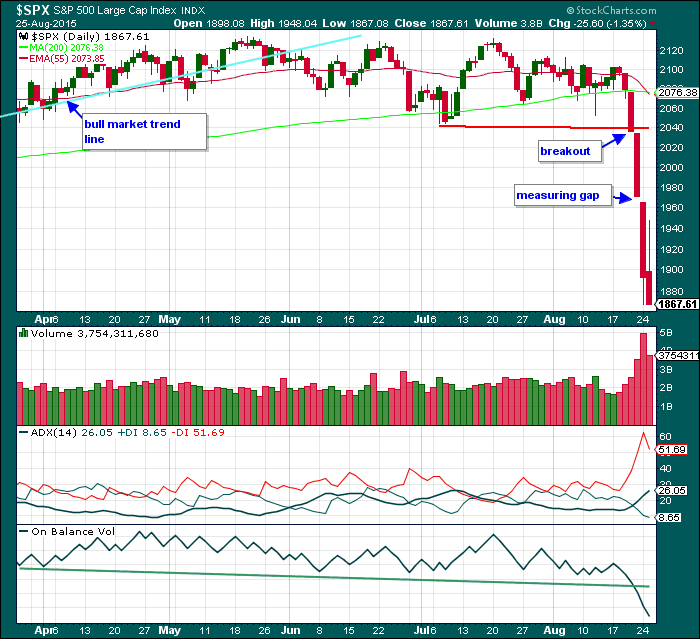
Click chart to enlarge. Chart courtesy of StockCharts.com.
Daily Chart: Today’s red candlestick comes with a decrease in volume, and with mostly sideways movement it does look like a small consolidation has begun.
ADX is still turning upwards, indicating there is a strengthening trend which is down.
If price turns up from here, then On Balance Volume may turn up to find resistance at the trend line which previously provided support.
A note on Dow Theory: for the bear wave count I would wait for Dow Theory to confirm a huge market crash. So far the industrials and the transportation indices have made new major swing lows, but the S&P500 and Nasdaq have not.
S&P500: 1,820.66
Nasdaq: 4,116.60
DJT: 7,700.49 – this price point was breached.
DJIA: 15,855.12 – this price point was breached.
This analysis is published about 10:23 p.m. EST.