
Yesterday the regular technical analysis supported the first Elliott wave count which expected more downwards movement.
Summary: A new low below 2,044.02 would now provide a lot of confidence in the first wave count, the target would be at 1,983. A new all time high above 2,134.72 would provide full confidence in the second wave count which expects new all time highs. Regular technical analysis again supports the first wave count, at least in the short term. More downwards movement may be expected for Monday.
Changes to last analysis are bold.
To see a weekly chart and how to draw trend lines click here.
FIRST ELLIOTT WAVE COUNT
Click chart to enlarge.
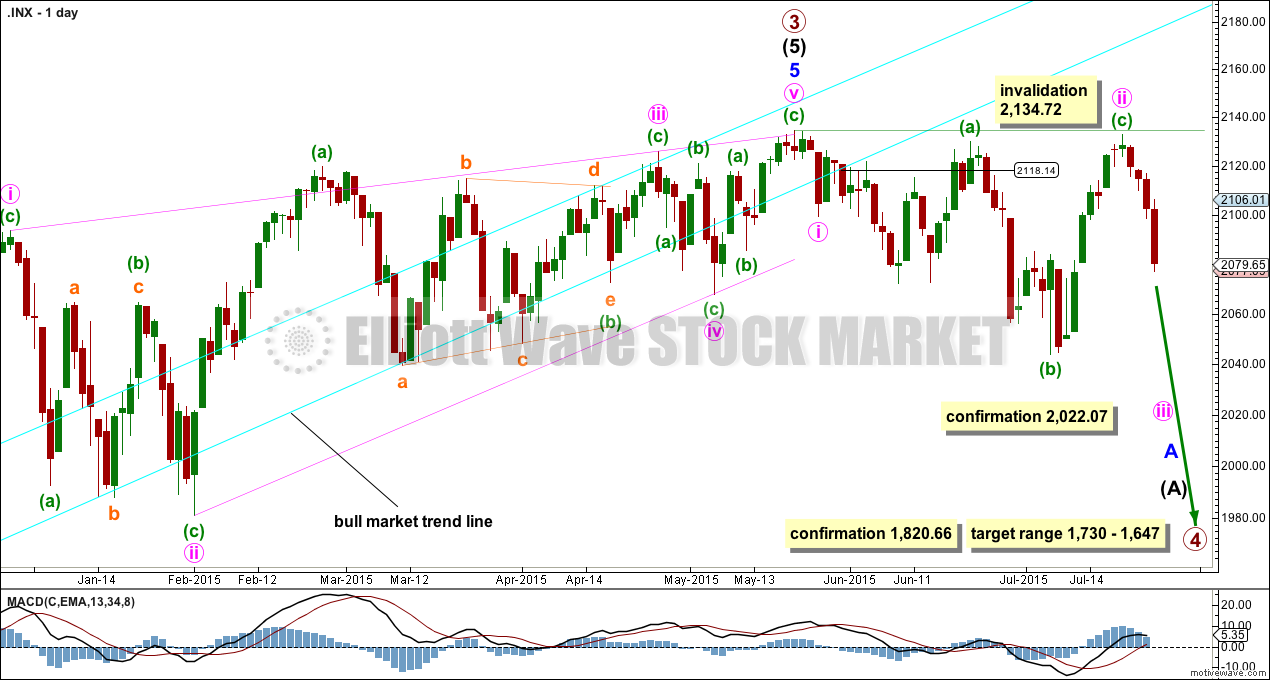
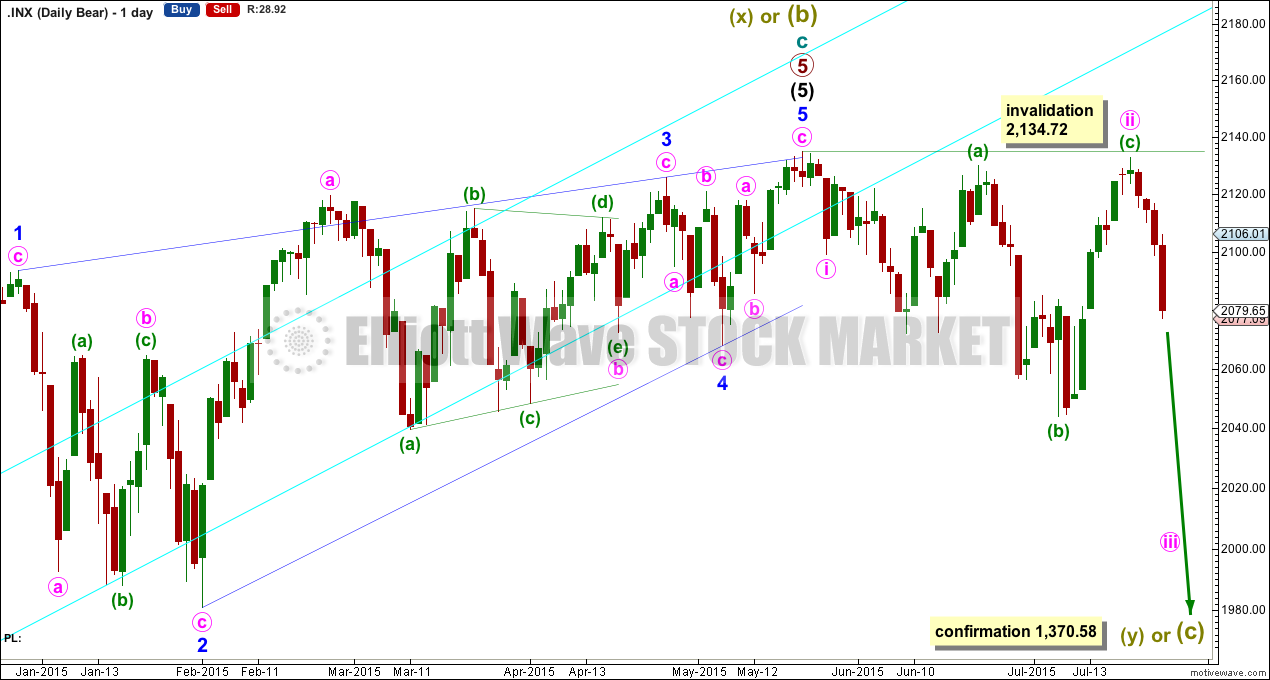
It is possible that the S&P has seen a primary degree (or for the bear count below a Super Cycle degree) trend change.
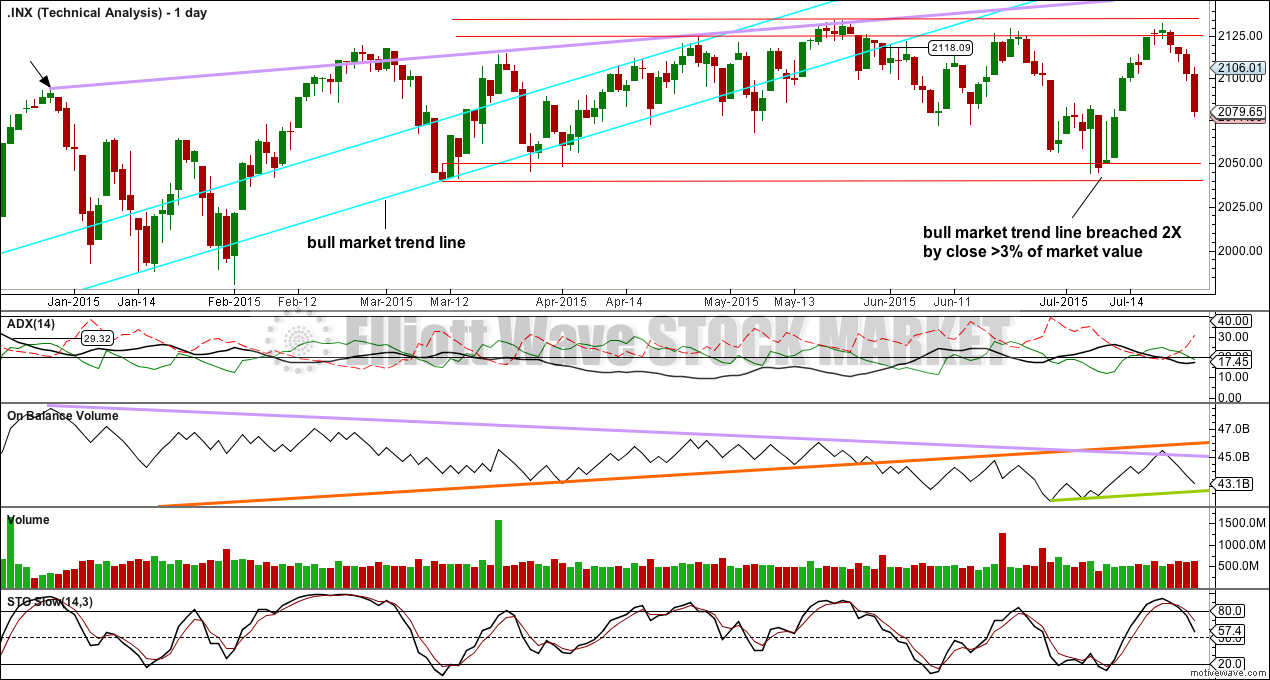
This wave count now has some confirmation at the daily chart level with a close more than 3% of market value below the long held bull market trend line.
Further confirmation would come with:
1. A new low below 2,044.02.
2. A new low below 2,022.07 to invalidate the alternate wave count.
3. A clear five down on the hourly chart.
4. A clear five down on the daily chart.
5. A new low below 1,820.66.
6. A break below the 50 day SMA on the weekly chart.
As each condition is met the probability of a substantial trend change would increase.
At this stage, a trend change is looking somewhat likely so I’ll list points in its favour:
1. The long held bull market trend line, the strongest piece of technical analysis on ALL charts, has been breached now by a close more than 3% of market value.
2. There is quadruple negative divergence between price and MACD on the weekly chart.
3. There is double negative divergence between price and MACD on the daily chart.
4. There is persistent and strong negative divergence between price and RSI on the monthly chart. The last time this happened was October 2007 and we all know what happened after that…
5. A long held bull trend line on On Balance Volume going back to October 2014 has been breached, is no longer providing support, and is now providing resistance.
6. DJT has recently failed to confirm the continuation of a bull market. This does not indicate a bear market, but does indicate caution.
Primary wave 4 would be likely to end within the price territory of the fourth wave of one lesser degree: intermediate wave (4) has its price territory from 1,730 to 1,647.
Primary wave 4 would be likely to exhibit alternation to primary wave 2. Primary wave 2 was a 0.41 zigzag correction lasting 12 weeks, one short of a Fibonacci 13. Primary wave 4 may be more shallow than the 0.382 Fibonacci ratio, and may be a flat, combination or triangle, which are more time consuming structures than zigzags so it should be longer in duration than primary wave 2. Primary wave 4 may last a Fibonacci 21 weeks in total, 1.618 the duration of primary wave 2.
Click chart to enlarge.
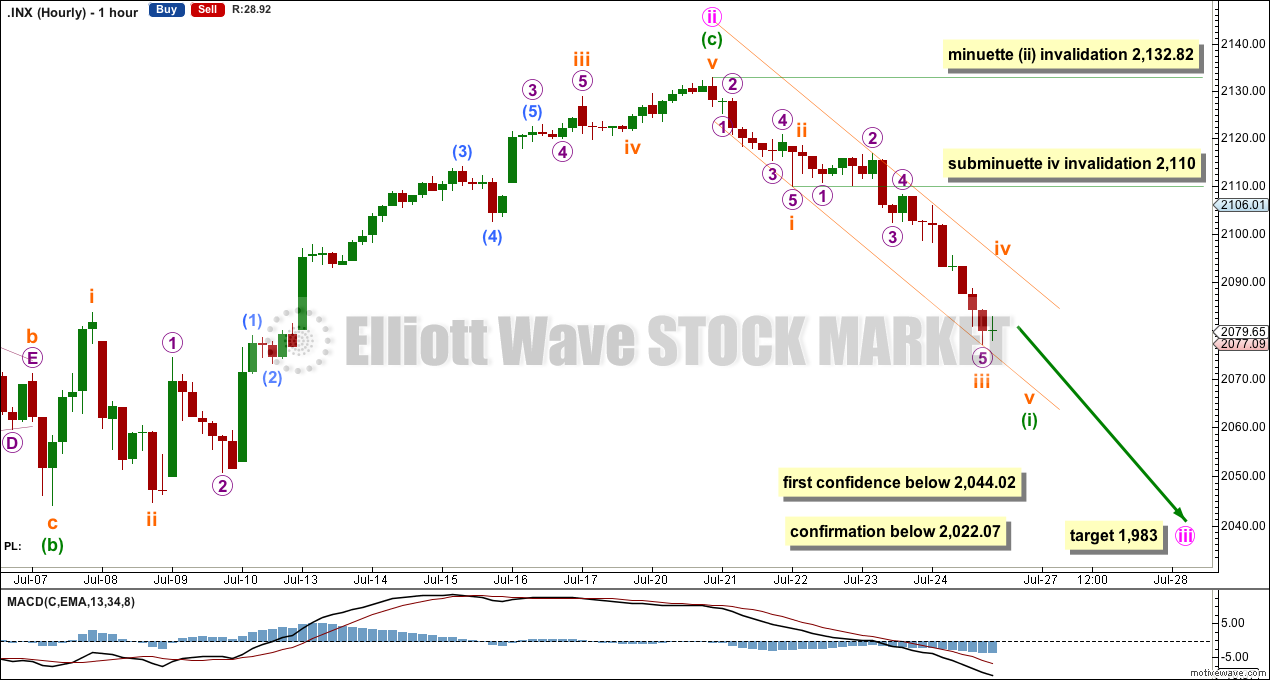
It is normal for the S&P to show the subdivisions of its third waves at minute degree clearly on the daily chart, but at the daily chart level minute wave iii is not yet showing the subdivisions within it. Minute wave iii may only subdivide as an impulse.
I do not think that minuette wave (i) is over yet. It may end next week, lasting one to three days, and minuette wave (ii) should show up clearly on the daily chart.
There is no Fibonacci ratio between subminuette waves i and iii.
Ratios within subminuette wave iii are: there is no Fibonacci ratio between micro waves 1 and 3, and micro wave 5 is 1.69 points short of 4.236 the length of micro wave 1.
Subminuette wave iv may not move into subminuette wave i price territory above 2,110. It should find strong resistance at the upper edge of this best fit channel.
When minuette wave (i) is a complete five wave impulse, then minuette wave (ii) should begin. It may not move beyond the start of minuette wave (i) above 2,132.82.
If minuette wave (i) ends above 2,044.02 and minuette wave (ii) takes its time, then it is conceivable that we may not get clarity next week.
The target for minute wave iii to end remains the same: at 1,983 it would reach 4.236 the length of minute wave i. That is the Fibonacci ratio I am choosing for this target because minute wave i was very short and minute wave ii was very deep.
SECOND ELLIOTT WAVE COUNT
Click chart to enlarge.
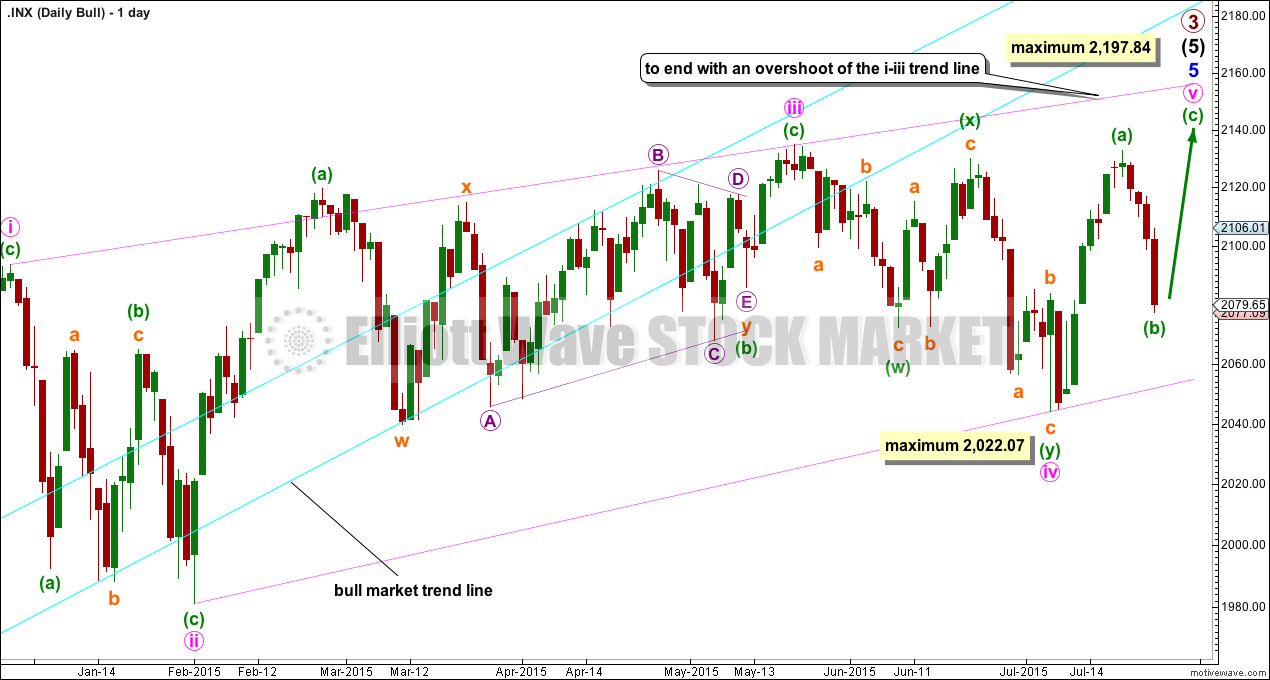
The ending contracting diagonal may still be incomplete. Ending diagonals require all sub waves to subdivide as zigzags, and the fourth wave should overlap first wave price territory. It is Elliott wave convention to always draw the diagonal trend lines to indicate a diagonal structure is expected.
My labelling here of minute wave iv within the diagonal as a double zigzag relies upon the interpretation of “double and triple zigzags take the place of zigzags” (“Elliott Wave Principle” by Frost and Prechter, 10th edition, page 91) to be true for zigzags within diagonals. This wave down may also be labelled as a single zigzag, but that does not have as neat a fit as a double zigzag.
The diagonal trend lines are no longer clearly converging. This reduces the probability of this wave count.
If it moves any lower, then minute wave iv may not be longer than equality in length with minute wave ii at 2,022.07. If it is over here, then minute wave v up also has a limit and may not be longer than equality with minute wave iii at 2,197.84.
The best way to see where and when upwards movement may end is the upper diagonal i-iii trend line. It is very likely to be overshot. Upwards movement may find resistance at the long held bull market trend line.
Click chart to enlarge.
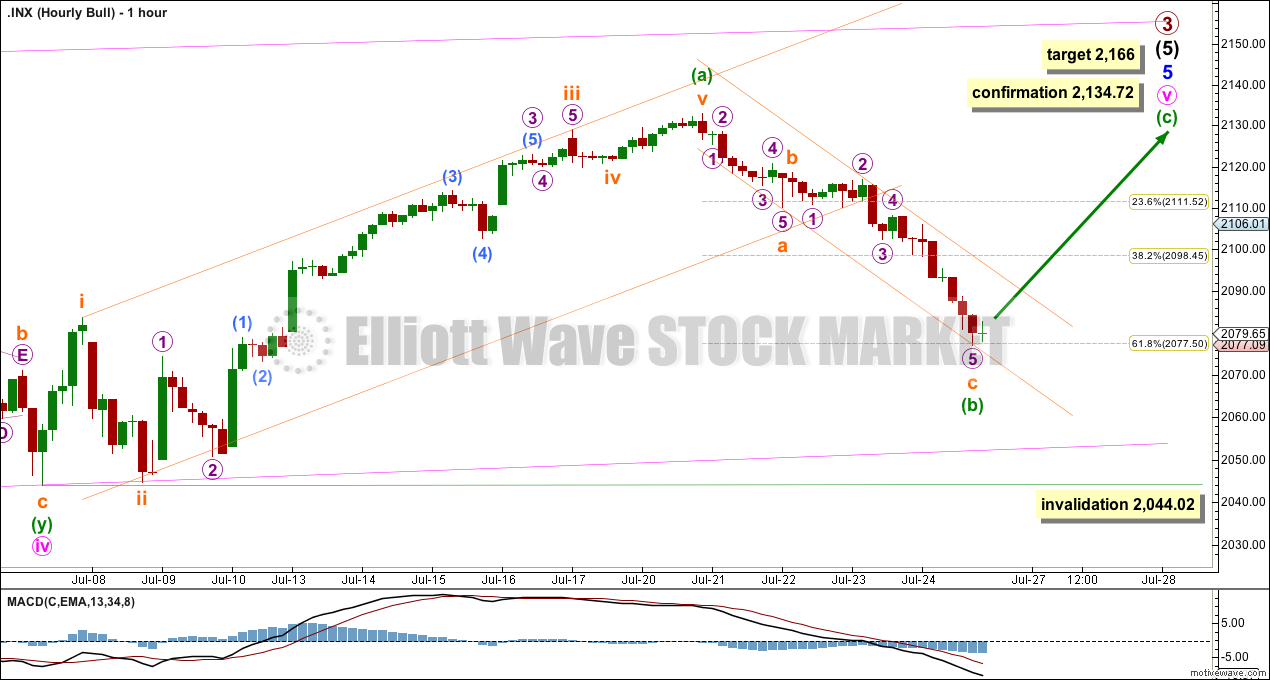
A-B-C of a zigzag and 1-2-3 of an impulse subdivide in exactly the same way. The subdivisions on the hourly chart for this downwards movement is seen in exactly the same way for both wave counts and the best fit channel is the same.
Minuette wave (b) still subdivides best as a completed zigzag, now reaching down to the 0.618 Fibonacci ratio of minuette wave (a). While it is now more likely that this B wave is over, it is still possible that it may continue sideways as a flat, combination or triangle.
The degree of labelling within minuette wave (b) may still be moved down one degree. This zigzag may be subminuette wave a of a flat correction or triangle, or it may be subminuette wave w of a double combination. It is now unlikely to be subminuette wave w of a double zigzag, because the correction is already very deep and a second zigzag is no longer required to make it deeper.
To confirm that minuette wave (b) is over the orange channel needs to be clearly breached by upwards (not sideways) movement, and the upwards movement must subdivide clearly as a five wave structure on the five minute chart.
While there is zero confirmation that minuette wave (b) is over, it must be accepted that it may yet move lower, but not beyond the start of minuette wave (a) below 2,044.02.
If minuette wave (b) is over here, then at 2,166 minuette wave (c) would reach equality in length with minuette wave (a).
BEAR ELLIOTT WAVE COUNT
Click chart to enlarge.
The subdivisions within cycle waves a-b-c are seen in absolutely exactly the same way as primary waves 1-2-3 for the main wave count.
In line with recent Grand Super Cycle wave analysis, I have moved the degree of labelling for the bear wave count all up one degree.
This bear wave count expects a Super Cycle wave (c) to unfold downwards for a few years, and if it is a C wave it may be devastating. It may end well below 666.79.
However, if this wave down is a Super Cycle wave (y), then it may be a time consuming repeat of the last big flat correction with two market crashes within it, equivalent to the DotCom crash and the recent Global Financial Crisis, and it may take another 8-9 years to unfold sideways.
Within the new bear market, no second wave correction may move beyond the start of its first wave above 2,134.72.
The second wave count above works in the same way for this bear wave count.
TECHNICAL ANALYSIS
Click chart to enlarge.
ADX is now below 20 and declining. No clear trend is indicated. A sideways range bound trading system would be better employed at this time than a trend following system.
At any one time a market will be doing only one of two things: either trending or consolidating. Your trading system / approach should be different for each type of market. Profiting in a clearly trending market is easier and involves less risk. Profiting in a consolidating market is harder and involves higher risk; only experienced professionals normally are able to profit in this kind of market. Good money management and careful stops are essential during consolidation to avoid wiping out your account.
One possible range bound trading system is presented here. It is very simple, and simple is usually best. This approach uses horizontal lines (red) of support and resistance in conjunction with Slow Stochastics. The idea is that when price reaches support or resistance at the same time Stochastics reaches oversold or overbought a trend change should be expected. The risk comes with the ability of price to move beyond the outer lines of support and resistance before turning around. This approach should tell us about where and when price may turn, but it cannot tell exactly where and when price will turn.
Eventually, the market will move again from consolidation to trending, and when that happens ADX is often slow to indicate the change. Eventually, the final swing expected from this range bound system will never come and that is when the breakout will happen. But at that point in time this system may expect a trend change which will never come. This is another illustration of why trading a consolidating market is so risky and has the potential for big losses. Stops are vital.
In this kind of range bound market stops may be set just beyond lines of support or resistance, or using Elliott wave invalidation points, or money management stops. This depends on your risk appetite and trading style. In a range bound market with higher risk of losses it is vital stops are always used.
Price reached up into the zone of resistance five days ago and Stochastics also reached overbought. A swing down from there was expected. Price is turning down and Stochastics is also returning from overbought. The downward swing should be expected to continue until price again reaches support and Stochastics again reaches oversold.
This regular technical analysis supports the first Elliott wave count.
The last four days of red candlesticks come with increasing volume indicating that the breakout from this range may be more likely to be down than up, and with rising volume this fall in price is supported. However, the prior high (arrow) of 26th December, 2014, came on declining volume and was followed by five days down on increasing volume. This is exactly the opposite of what is normal and what should be expected, and illustrates that volume behaviour at the moment for the S&P 500 may not be normal making volume analysis less reliable.
On Balance Volume may be a better volume analysis tool at this time. OBV has found resistance at the long held orange trend line, which supports the idea of a downwards swing from here, at least in the short term. An interruption to this downwards swing may come when OBV finds support at its green trend line. That may help pinpoint when minuette wave (i) ends and minuette wave (ii) begins for the first wave count, or where minuette wave (c) begins for the second wave count.
A note on Dow Theory: for the bear wave count I would wait for Dow Theory to confirm a huge market crash. For that to be confirmed the following new lows are needed:
S&P500: 1,820.66
Nasdaq: 4,116.60
DJT: 7,700.49
DJIA: 15,855.12
At this time DJT is closest, but none of these indices have made new major swing lows yet.
This analysis is published about 09:59 p.m. EST.
Looks like time for one more bounce for SPY at 200 SMA. DOW will probably rally back to kiss underside of same. If Shanghai is any indication, we are looking an minuette three down coming up I think…it should forcefully take out SPY 200 SMA.