
I have two Elliott wave counts for you today.
Price will tell us this week which one is correct.
Summary: A new low below 2,074.28 would provide some confidence in the first wave count, the target would be at 1,983. A new all time high above 2,134.72 would provide full confidence in the second wave count, the target is at 2,164.
Changes to last analysis are bold.
To see a weekly chart and how to draw trend lines click here.
FIRST ELLIOTT WAVE COUNT
Click chart to enlarge.
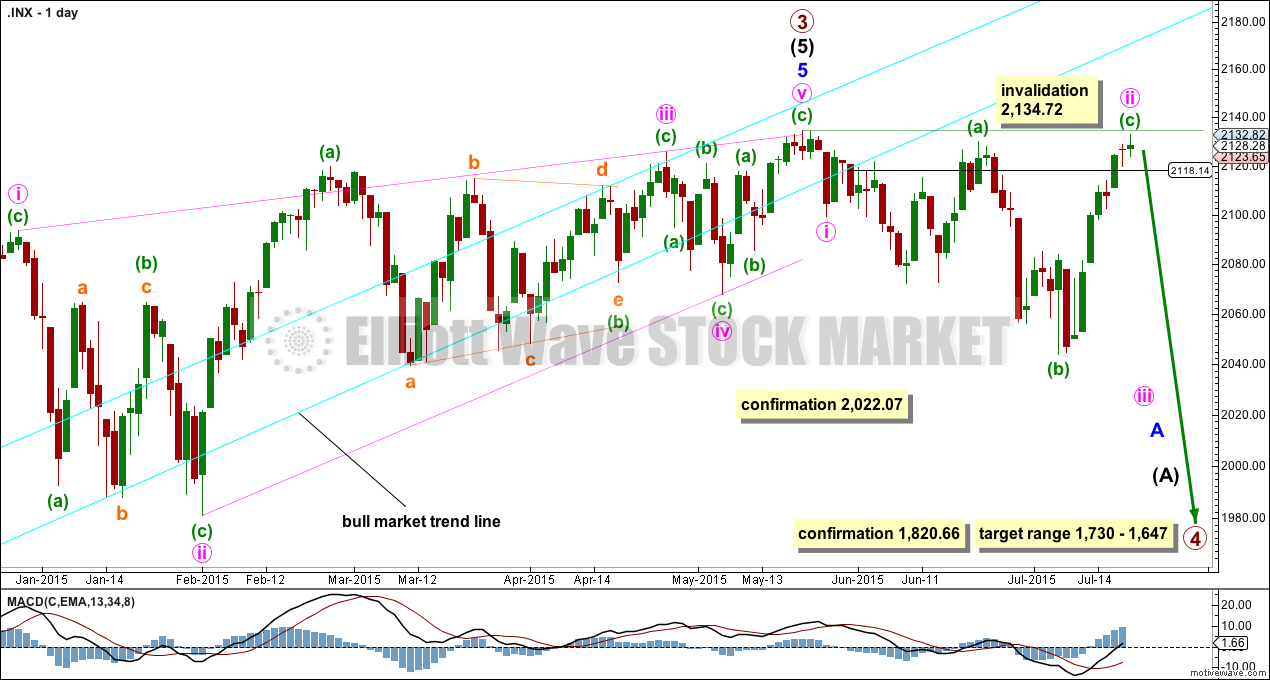
It is possible that the S&P has seen a primary degree (or for the bear count below a Super Cycle degree) trend change.
This wave count now has some confirmation at the daily chart level with a close more than 3% of market value below the long held bull market trend line.
Further confirmation would come with:
1. A new low below 2,074.28.
2. A new low below 2,022.07 to invalidate the alternate wave count.
3. A clear five down on the hourly chart.
4. A clear five down on the daily chart.
5. A new low below 1,820.66.
6. A break below the 50 day SMA on the weekly chart.
As each condition is met the probability of a substantial trend change would increase.
At this stage, a trend change is looking somewhat likely so I’ll list points in its favour:
1. ADX is above 20 and rising, and the -DX line is above the +DX line indicating a new downwards trend.
2. The long held bull market trend line, the strongest piece of technical analysis on ALL charts, has been breached now by a close more than 3% of market value.
3. There is quadruple negative divergence between price and MACD on the weekly chart.
4. There is double negative divergence between price and MACD on the daily chart.
5. There is persistent and strong negative divergence between price and RSI on the monthly chart. The last time this happened was October 2007 and we all know what happened after that…
6. A long held bull trend line on On Balance Volume going back to October 2014 has been breached and is no longer providing support (orange line added to OBV on the TA chart below). It may provide resistance.
7. DJT has recently failed to confirm the continuation of a bull market. This does not indicate a bear market, but does indicate caution.
Primary wave 4 would be likely to end within the price territory of the fourth wave of one lesser degree: intermediate wave (4) has its price territory from 1,730 to 1,647.
Primary wave 4 would be likely to exhibit alternation to primary wave 2. Primary wave 2 was a 0.41 zigzag correction lasting 12 weeks, one short of a Fibonacci 13. Primary wave 4 may be more shallow than the 0.382 Fibonacci ratio, and may be a flat, combination or triangle, which are more time consuming structures than zigzags so it should be longer in duration than primary wave 2. Primary wave 4 may last a Fibonacci 21 weeks in total, 1.618 the duration of primary wave 2.
Click chart to enlarge.
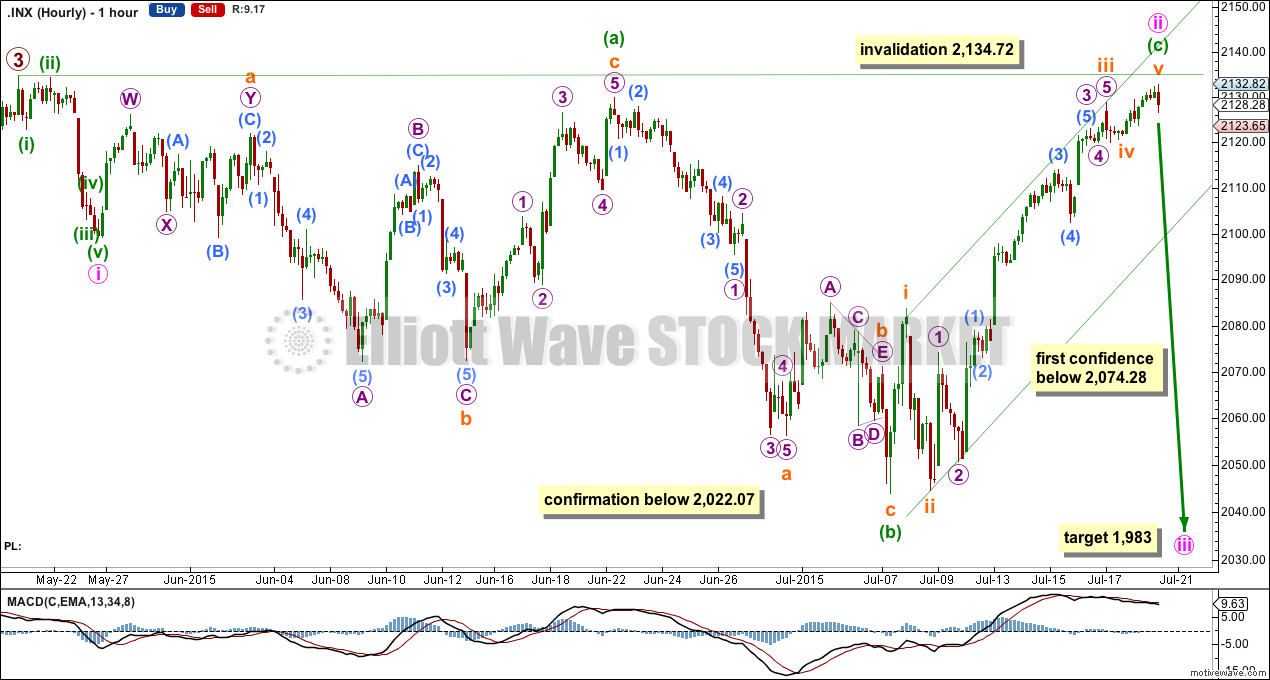
The only option now for this wave count is to see minute wave ii as a very deep expanded flat correction. However, it looks out of proportion to minute wave i.
Minute wave ii must be over here. There is almost no room left for it to move up into, and within it, all subdivisions are complete.
There is no Fibonacci ratio between minuette waves (a) and (c). Within minuette wave (c), there are no Fibonacci ratios between subminuette waves i, iii and v.
This wave count is still viable. Second wave corrections are often very deep, and may be up to 100% of the first wave. Only a new high above 2,134.72 would invalidate this wave count. If it is wrong, then we should know tomorrow.
At 1,983 minute wave iii would reach 4.236 the length of minute wave i.
Minute wave ii may not move beyond the start of minute wave i above 2,134.72.
SECOND ELLIOTT WAVE COUNT

Click chart to enlarge.
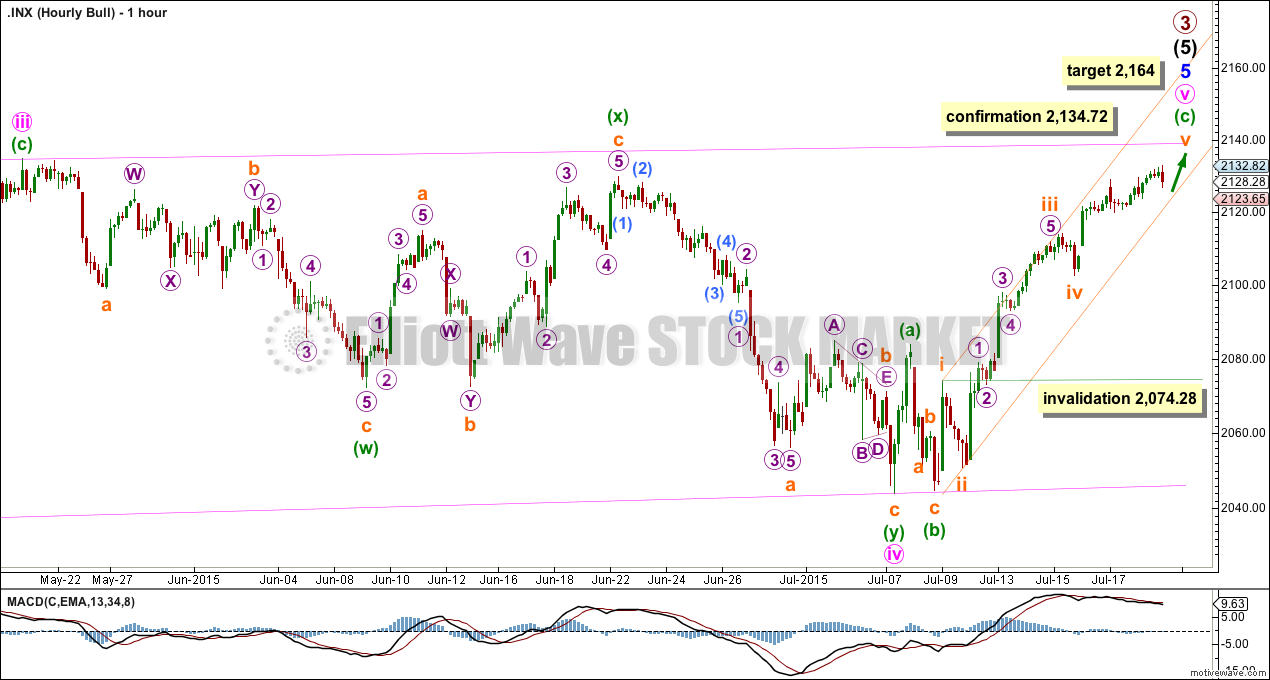
The ending contracting diagonal may still be incomplete. Ending diagonals require all sub waves to subdivide as zigzags, and the fourth wave should overlap first wave price territory. It is Elliott wave convention to always draw the diagonal trend lines to indicate a diagonal structure is expected.
The diagonal trend lines are no longer clearly contracting and minuette wave (c) within minute wave iv now looks like a three where it should be a five. This reduces the probability of this wave count.
If it moves any lower, then minute wave iv may not be longer than equality in length with minute wave ii at 2,022.07. If it is over here, then minute wave v up also has a limit and may not be longer than equality with minute wave iii at 2,197.84.
The best way to see where and when upwards movement may end is the upper diagonal i-iii trend line. It is very likely to be overshot. Upwards movement may find resistance at the long held bull market trend line.
Click chart to enlarge.
To resolve the problem of a five looking like a three minute wave iv of the diagonal may have been a double zigzag. This is an interpretation of Elliott wave rules in Frost and Prechter which allows for a double and triple zigzag to replace a single zigzag within an ending diagonal.
Minute wave v must be a zigzag. Within minute wave v, minuette waves (a) and (b) are complete and minuette wave (c) is incomplete.
At 2,164 subminuette wave v would reach equality in length with subminuette wave iii. This would allow for a reasonable overshoot of the i-iii diagonal trend line.
If my labelling of minuette wave (c) is wrong, then it may be that subminuette wave iii is not over and subminuette wave iv is yet to unfold. There really is only one place to label subminuette wave i. Subminuette wave iv may not move into subminuette wave i price territory below 2,074.28.
BEAR ELLIOTT WAVE COUNT

Click chart to enlarge.
The subdivisions within cycle waves a-b-c are seen in absolutely exactly the same way as primary waves 1-2-3 for the main wave count.
In line with recent Grand Super Cycle wave analysis, I have moved the degree of labelling for the bear wave count all up one degree.
This bear wave count expects a Super Cycle wave (c) to unfold downwards for a few years, and if it is a C wave it may be devastating. It may end well below 666.79.
However, if this wave down is a Super Cycle wave (y), then it may be a time consuming repeat of the last big flat correction with two market crashes within it, equivalent to the DotCom crash and the recent Global Financial Crisis, and it may take another 8-9 years to unfold sideways.
Within the new bear market, no second wave correction may move beyond the start of its first wave above 2,134.72.
The second wave count above works in the same way for this bear wave count.
TECHNICAL ANALYSIS
Click chart to enlarge.
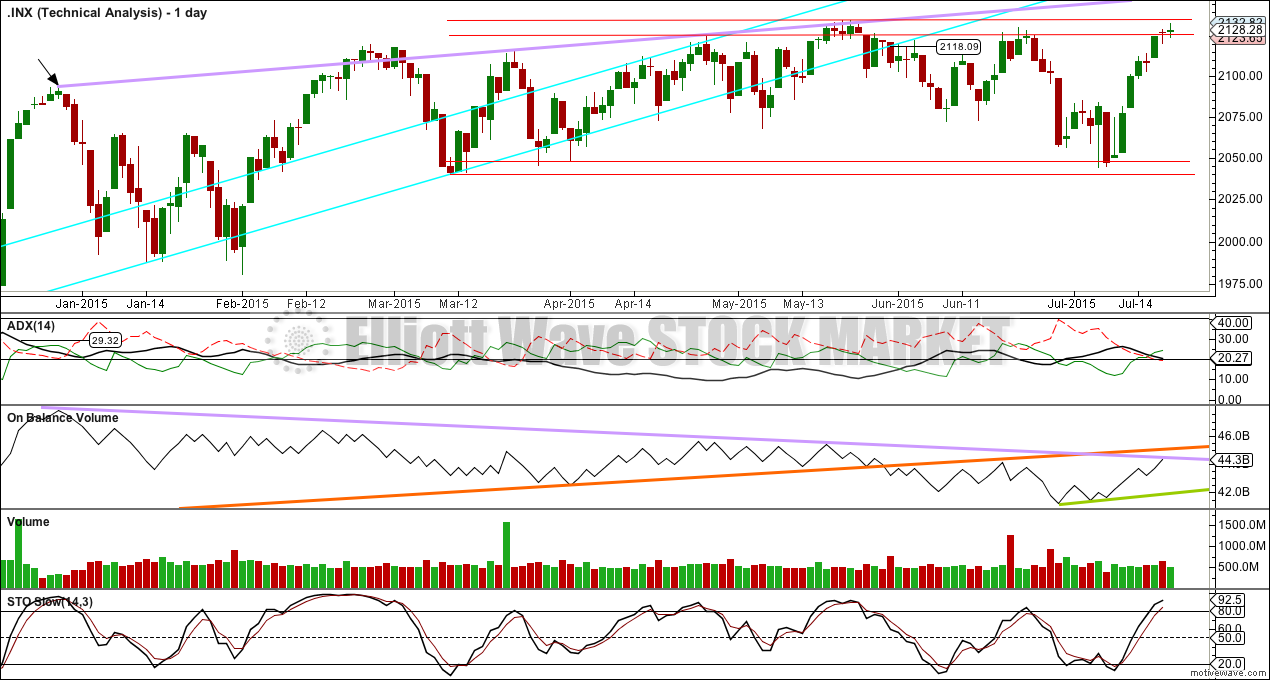
ADX is still declining indicating no clear trend. ADX does tend to be a lagging indicator though.
A range bound trading system would better be used while ADX is indicating the market is range bound. For the S&P 500 slow Stochastics may be used to show overbought and oversold. The idea is simple: expect a trend change when Stochastics moves to an extreme. However, Stochastics is not showing exactly when price turns and can remain extreme while price continues further before a trend change is seen. This approach may benefit from horizontal lines of support and resistance (red lines); expect that when Stochastics reaches an extreme and price is within the upper or lower zone of resistance or support that a trend change may occur.
On Balance Volume has come to touch the lilac trend line. This may show when price finds resistance. If the lilac line is breached the orange longer held line may provide resistance, and that is very close by now.
Overall, since 25th June, volume has been declining. This may indicate a consolidation which is maturing. During this phase it is the down day of 25th June which has strongest volume.
Of the last eight days upwards movement, it is a down day which shows strongest volume. This may be a slight bearish indicator. However, volume has not recently been a reliable indicator for the S&P, as illustrated by the high of 29th December 2014. There volume declined while price made a new all time high, and the following fall in price over five days happened on a rise in volume. This is exactly the opposite of what would be expected normally.
While price has made a new swing high above the last swing high at 22nd June, On Balance Volume has also made a new high. There is no negative divergence to suggest a top here.
The long held aqua blue bull market trend line (going back to November 2011) has been breached by two days close more than 3% of market value. This is still bearish.
Of the indices S&P 500, DJIA, DJT and Nasdaq, it is still only Nasdaq which has made a new all time high.
Overall the regular technical analysis picture is at this stage a little more bearish than bullish. Price will be final determiner though, and if we see a new all time high tomorrow the situation will be obviously more bullish for the short term.
A note on Dow Theory: for the bear wave count I would wait for Dow Theory to confirm a huge market crash. For that to be confirmed the following new lows are needed:
S&P500: 1,820.66
Nasdaq: 4,116.60
DJT: 7,700.49
DJIA: 15,855.12
At this time DJT is closest, but none of these indices have made new major swing lows yet.
This analysis is published about 08:37 p.m. EST.