
Upwards movement was expected, but did not happen.
Price remains above the invalidation point on the hourly chart and has found support at the lower diagonal trend line on the daily chart.
Summary: Upwards movement should continue overall for several days yet. A new high above 2,099.18 would confirm the main wave count. A new low below 2,022.07 is required for initial confirmation of a bear market.
To see a weekly chart and how to draw trend lines go here.
Changes to last analysis are bold.
BULL ELLIOTT WAVE COUNT
Click chart to enlarge.
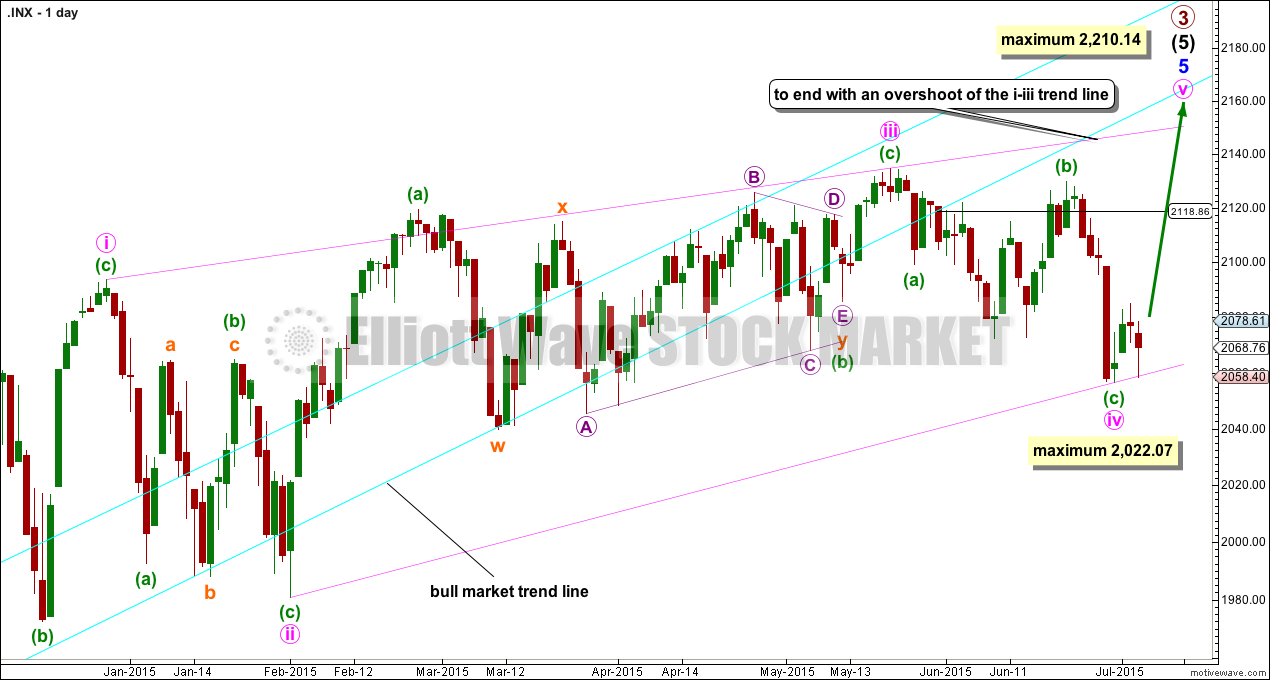
The ending contracting diagonal may still be incomplete.
Minute wave iv is now very likely to be complete. Minute wave v upwards has most likely begun, and may not be longer than equality in length with minute wave iii because the diagonal is contracting and a third wave may not be the shortest. This gives a limit to upwards movement at 2,210.14.
If it moves any lower, then minute wave iv may not be longer than equality in length with minute wave ii at 2,022.07.
Diagonals don’t normally exhibit Fibonacci ratios between their actionary waves, so a ratio between minute wave v and either of i or iii would not be a useful target calculation. The ratio within the zigzag between minuette waves (a) and (c) would be a useful target calculation, but that cannot be done until minuette waves (a) and (b) within minute wave v are complete.
Minute wave i lasted 51 days, minute wave ii 23 days, minute wave iii 75 days and minute wave iv 28 days. Neither minute waves i or iii exhibit a Fibonacci duration and 75 has no Fibonacci ratio to 51. Minute wave v is not likely to exhibit a Fibonacci duration.
The best way to see where and when upwards movement may end is the upper diagonal i-iii trend line. It is very likely to be overshot. Upwards movement may find resistance at the long held bull market trend line.
The bull market trend line still has not been breached by a close of 3% or more of market value since its inception in November 2011, but it is no longer exactly where price is finding support, and the strength of that line appears to be waning. If the trend line was breached at 2,188.86 (thereabouts) then a close of 3% would be needed at 2,055.
I have a preference for this bull wave count because we should always assume the trend remains the same until proven otherwise. While there is no confirmation of a bear market, I will assume the S&P remains in a bull market.
Click chart to enlarge.
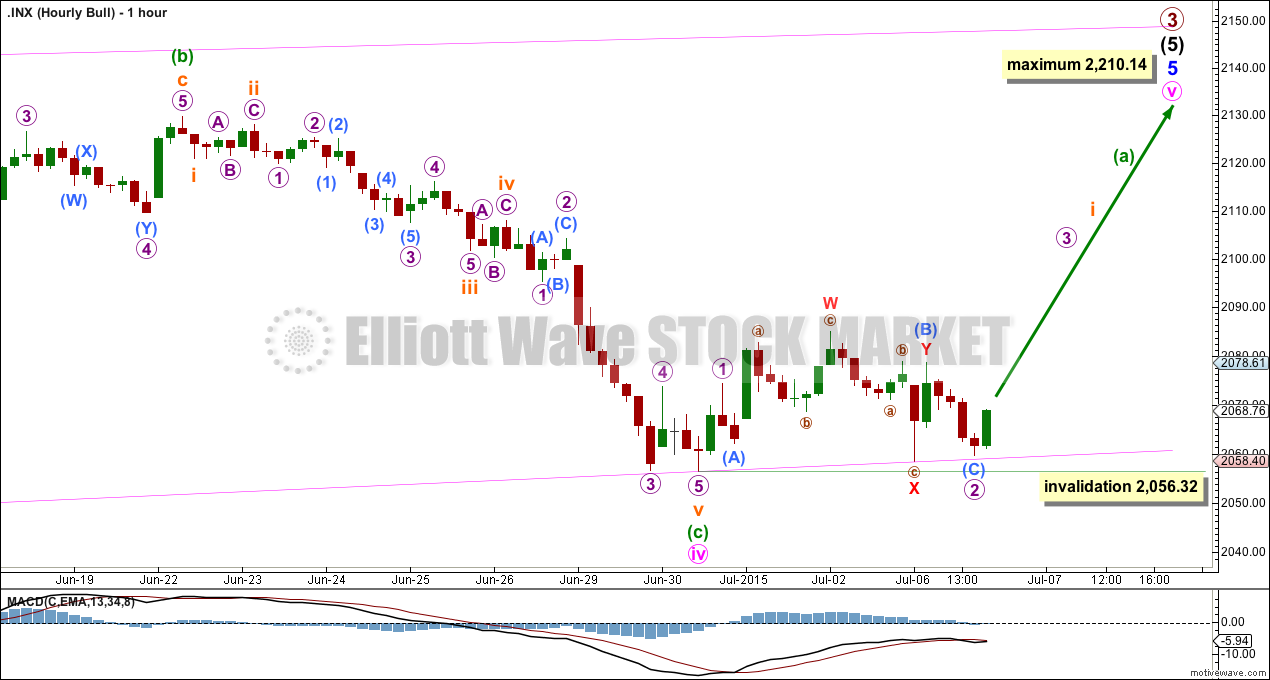
A lot of time invested today analysing the hourly chart.
Downwards movement for Monday is too deep so the upwards movement from 2,056.32 to the last high is not a series of overlapping first and second waves. The structure may fit technically as a double zigzag for a B wave, but it moves sideways so does not meet the guideline that a double zigzag should have a clear slope.
I have concluded that it was either an atypical double zigzag, that my labelling of it is so far all wrong, or that the sideways movement for micro wave 2 is incomplete. I will allow that micro wave 2 could continue further sideways tomorrow, but it may not move beyond the start of micro wave 1 at 2,056.32.
Downwards movement for Monday perfectly found support at the lower ii-iv diagonal trend line. Any further sideways movement should continue to find support about this line.
The next upwards movement should be a third wave and show some increase in upwards momentum.
ALTERNATE BULL ELLIOTT WAVE COUNT
Click chart to enlarge.
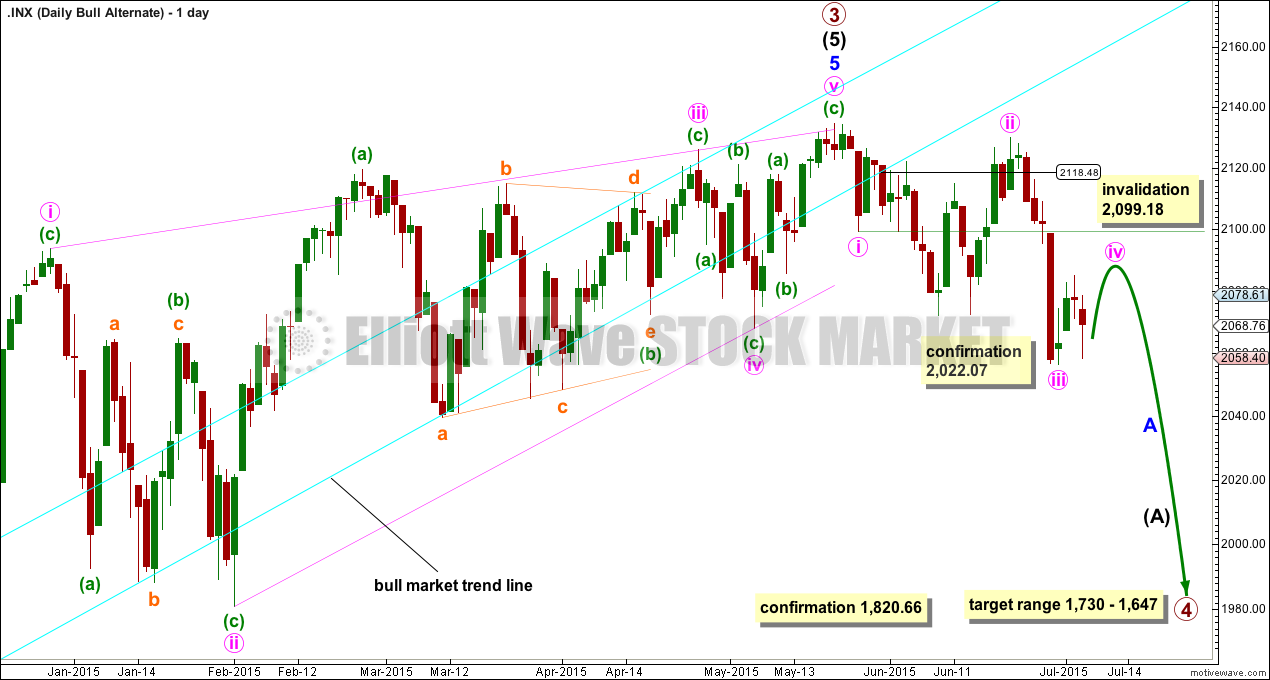
It is possible that the S&P has seen a primary degree (or for the bear count below a Super Cycle degree) trend change.
This wave count absolutely requires confirmation at the daily chart level before any confidence may be had in a primary (or Super Cycle) degree trend change. Confirmation would come with:
1. A new low below 2,022.07 to invalidate the new main wave count.
2. A clear five down on the hourly chart.
3. A close of 3% or more of market value below the lower aqua blue trend line. If the line is now breached at 2,118, then a close at 2,055 or below is required to confirm a bear market.
4. A clear five down on the daily chart.
5. A new low below 1,820.66.
As each condition is met the probability of a substantial trend change would increase.
Primary wave 4 would most likely be a time consuming flat, triangle or combination in order to exhibit structural alternation with the zigzag of primary wave 2. Primary wave 2 lasted 12 weeks. Primary wave 4 is likely to be longer in duration because combinations and triangles particularly are more time consuming than zigzags which tend to be quick corrections. Primary wave 4 may be expected to last more than 12 weeks, and may end with a total Fibonacci 13 or more likely 21 weeks.
For this more bearish wave count to be taken seriously it requires at least a clear five down on the hourly chart.
At this stage, a trend change is looking somewhat likely so I’ll list points in its favour. However, these points indicate a trend change to come and not exactly when it will happen and so they support both the main and this alternate bull wave count:
1. ADX is above 20 and rising, and the -DX line is above the +DX line indicating a new downwards trend.
2. The long held bull market trend line, the strongest piece of technical analysis on ALL charts, has been breached.
3. There is quadruple negative divergence between price and MACD on the weekly chart.
4. There is double negative divergence between price and MACD on the daily chart.
5. There is persistent and strong negative divergence between price and RSI on the monthly chart. The last time this happened was October 2007 and we all know what happened after that…
6. A long held bull trend line on On Balance Volume going back to October 2014 has been breached and is no longer providing support.
7. Nasdaq is making new all time highs. Only DJT now is required to make a new all time high to confirm continuation of a bull market. Failure of DJT to confirm the bull market does not mean a bear market exists and just indicates caution.
BEAR ELLIOTT WAVE COUNT
Click chart to enlarge.
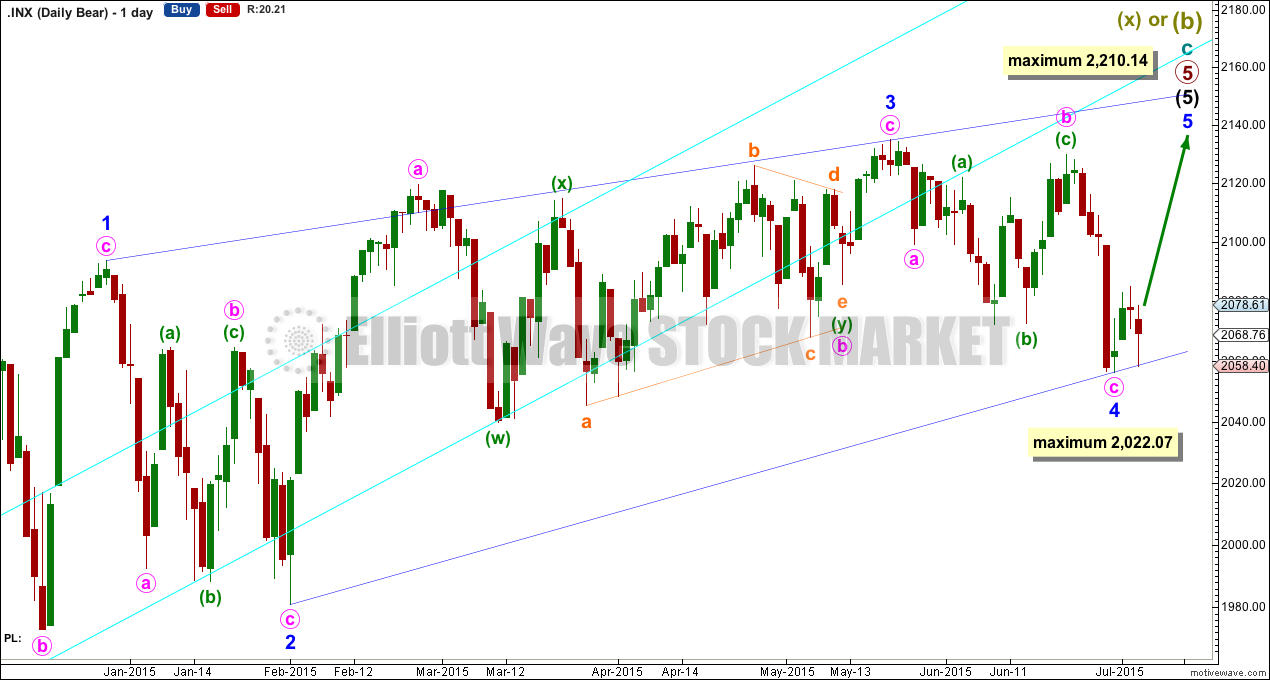
The subdivisions within cycle waves a-b-c are seen in absolutely exactly the same way as primary waves 1-2-3 for the bull wave count.
In line with recent Grand Super Cycle wave analysis, I have moved the degree of labelling for the bear wave count all up one degree. It is possible that the recent high was the end of a Super Cycle wave (b) or (x) and that Grand Super Cycle wave II is unfolding as an expanded flat, double flat or a double combination.
This bear wave count expects a Super Cycle wave (c) to unfold downwards for a few years, and if it is a C wave it may be devastating. It may end well below 666.79.
However, if this wave down is a Super Cycle wave (y), then it may be a time consuming repeat of the last big flat correction with two market crashes within it, equivalent to the DotCom crash and the recent Global Financial Crisis, and it may take another 8-9 years to unfold sideways.
At Super Cycle degree, wave (b) is over the maximum common length of 138% the length of cycle wave a, at 170% the length of cycle wave a. At 2,393 Super Cycle wave (b) would be twice the length of Super Cycle wave (a) and at that point this bear wave count should be discarded.
TECHNICAL ANALYSIS
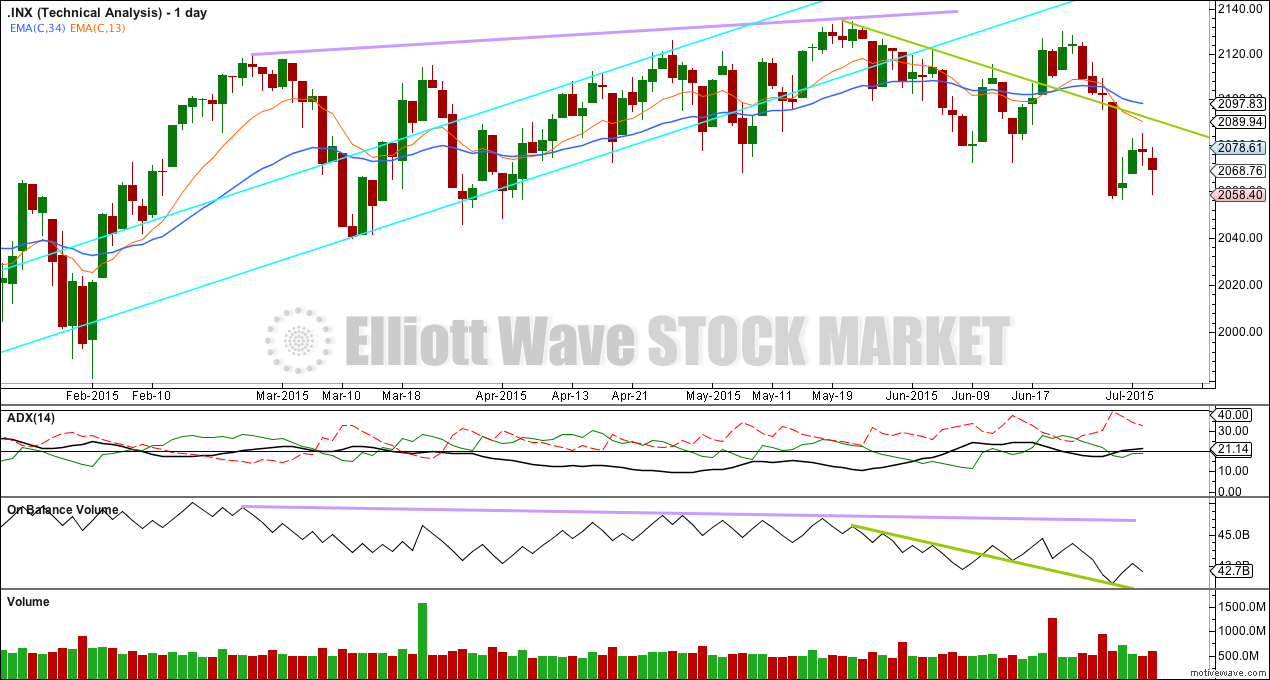
Click chart to enlarge.
ADX continues to indicate a downwards trend. The fall in price for the last two daily red candlesticks is supported by an increase in volume and On Balance Volume moving lower. A shorter 13 day EMA has crossed below a longer 34 day EMA indicating a downwards trend. This regular TA continues to favour the alternate bull Elliott wave count rather than the main Elliott wave count.
Any upwards price movement may find resistance at the green trend line on price. Downwards movement may end when OBV touches its green trend line.
This analysis is published about 08:48 p.m. EST.
Hi Lara,
Can you please explain how in your main hourly, Minute wave (pink) of Minor wave 5 (blue) is dissecting into an a,b,c as indicated by the green Minuette wave (a)? Shouldn’t pink (v) be a five wave?
Ending Diagonal waves must divide as zig-zags (threes). Although it is a motive wave it is not an impulse.
Vernecarty answers above.
I do usually go over this in the video, I’ll add it back to the text article.
Ending diagonals require all sub waves to subdivide as zigzags.