
The narrow channel on the hourly chart was never breached, so some downwards movement was expected to continue.
However, a new low below 2,067.93 has invalidated the main Elliott wave count and confirmed the alternate Elliott wave count.
Summary: A trend change at least at primary degree is now very likely. A close at 2,055 or below would provide trend line confirmation of a change from bull to bear for the S&P, and today’s close at 2,056.64 is extremely close. If this week’s candlestick remains below the bull market trend line, then a bear market will be confirmed. The market is either in a primary degree fourth wave, or maybe the early stages of a huge crash.
To see a weekly chart and how to draw trend lines go here.
Changes to last analysis are italicised.
Bull Wave Count
Click chart to enlarge.
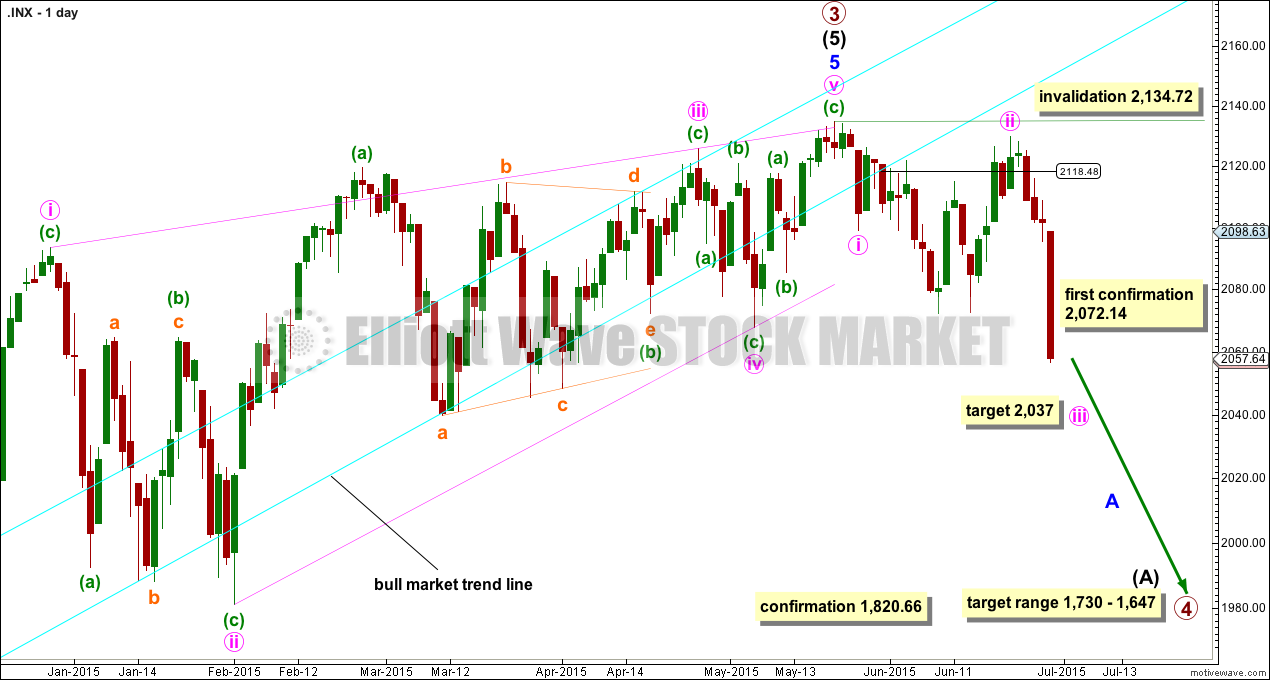
In line with recent Grand Super Cycle analysis, I have decided to leave the degree of labelling for the bull wave count at the daily chart level the same. The bull wave count sees a Super Cycle wave V unfolding upwards, and it may be that cycle wave I is incomplete, and now primary wave IV within it has just begun.
It is possible that the S&P has seen a primary degree (or for the bear count below a Super Cycle degree) trend change.
This wave count absolutely requires confirmation at the daily chart level before any confidence may be had in a primary (or cycle) degree trend change. Confirmation would come with:
1. A new low below 2,072.14 (this first condition is now met).
2. A clear five down on the hourly chart.
3. A close of 3% or more of market value below the lower aqua blue trend line. If the line is now breached at 2,118, then a close at 2,055 or below is required to confirm a bear market. Today’s close at 2,056.64 is extremely close.
4. A clear five down on the daily chart.
5. A new low below 1,820.66.
As each condition is met the probability of a substantial trend change would increase.
Primary wave 4 would most likely be a time consuming flat, triangle or combination in order to exhibit structural alternation with the zigzag of primary wave 2. Primary wave 2 lasted 12 weeks. Primary wave 4 is likely to be longer in duration because combinations and triangles particularly are more time consuming than zigzags which tend to be quick corrections. Primary wave 4 may be expected to last more than 12 weeks, and may end with a total Fibonacci 13 or more likely 21 weeks.
At this stage, a trend change is looking quite likely so I’ll list points in its favour. However, these points indicate a trend change to come and not exactly when it will happen and so they support both the main and this alternate bull wave count:
1. The long held bull market trend line, the strongest piece of technical analysis on ALL charts, has again been recently breached. Today’s close is almost 3% of market value below that line.
2. There is quadruple negative divergence between price and MACD on the weekly chart.
3. There is double negative divergence between price and MACD on the daily chart.
4. There is persistent and strong negative divergence between price and RSI on the monthly chart. The last time this happened was October 2007 and we all know what happened after that…
5. A long held bull trend line on On Balance Volume going back to October 2014 has been breached and is no longer providing support.
6. DJT has failed to recently confirm the continuation of a bull market.
At 2,037 minute wave iii would reach 2.618 the length of minute wave i.
Minute wave ii may not move beyond the start of minute wave i above 2,134.72.
Click chart to enlarge.
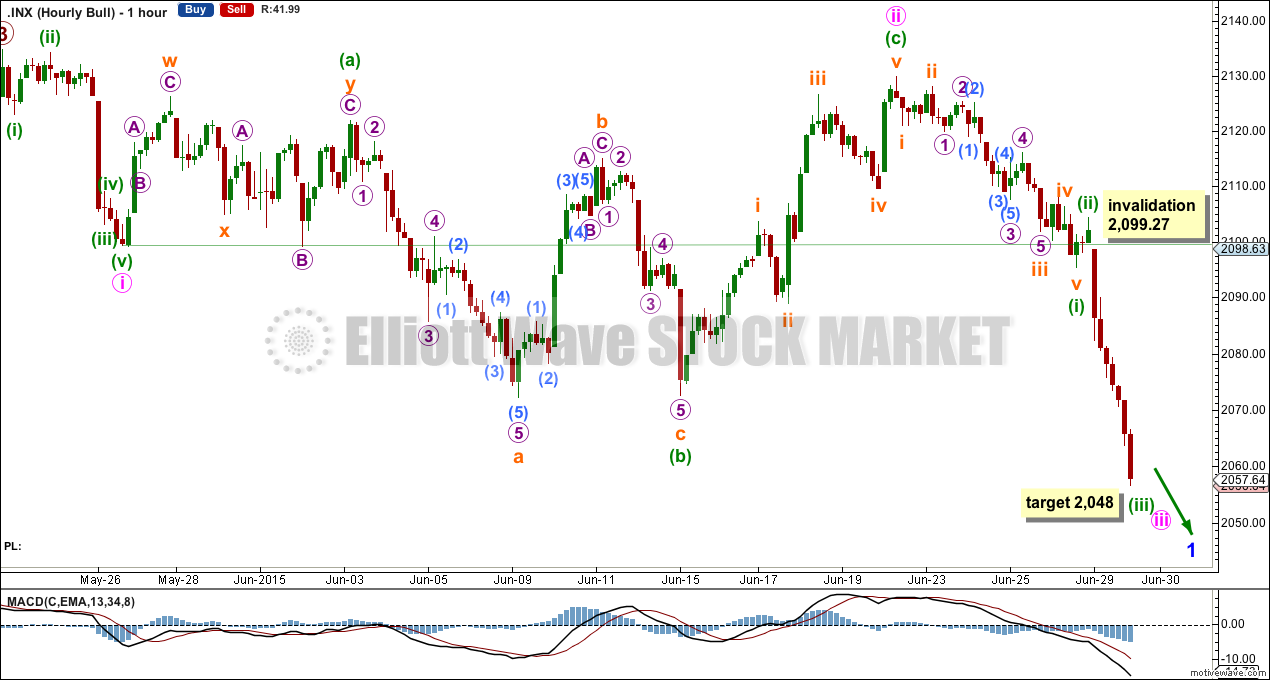
I am discarding the leading diagonal idea in favour of a more likely impulse for the first wave down of the new trend. Minor wave 1 is incomplete.
Minute wave i may have been a quick short impulse. Minute wave ii may have been a very deep and time consuming expanded flat correction. Minuette wave (c) is 1.92 points short of 2.618 the length of minuette wave (a).
Minute wave iii would be incomplete.
Within minute wave iii, minuette waves (i) and (ii) are complete. At 2,048 minuette wave (iii) would reach 1.618 the length of minuette wave (i). Minuette wave (iv) should be over as quickly as minuette wave (ii).
The next interruption to the downwards trend may not arrive until minute wave iii is complete. Until then we may see more red daily candlesticks.
Minute wave iv, when it arrives, may not move into minute wave i price territory above 2,099.27.
Bear Wave Count
Click chart to enlarge.
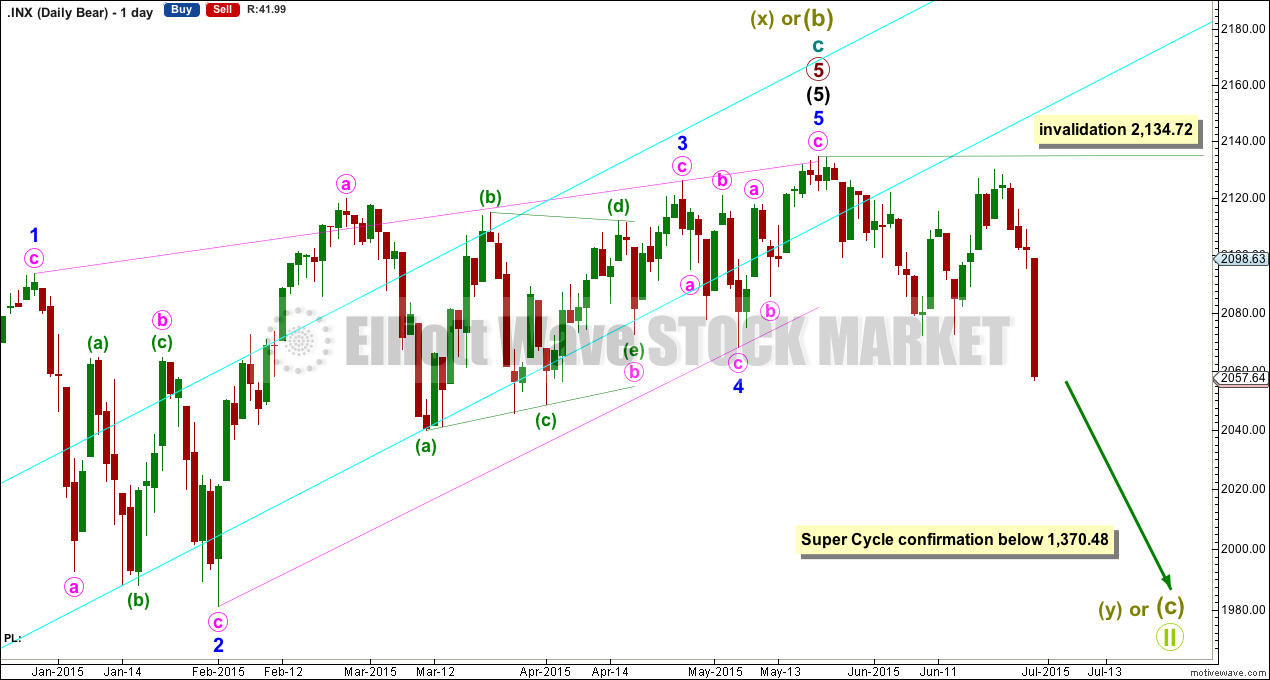
The subdivisions within cycle waves a-b-c are seen in absolutely exactly the same way as primary waves 1-2-3 for the bull wave count.
In line with recent Grand Super Cycle wave analysis, I am moving the degree of labelling for the bear wave count all up one degree. It is possible that the recent high was the end of a Super Cycle wave (b) or (x) and that Grand Super Cycle wave II is unfolding as an expanded flat, double flat or a double combination.
This bear wave count expects a Super Cycle wave (c) to unfold downwards for a few years, and if it is a C wave it may be devastating. It may end well below 666.79.
However, if this wave down is a Super Cycle wave (y), then it may be a time consuming repeat of the last big flat correction with two market crashes within it, equivalent to the DotCom crash and the recent Global Financial Crisis, and it may take another 8-9 years to unfold sideways.
At Super Cycle degree, wave (b) is over the maximum common length of 138% the length of cycle wave a, at 170% the length of cycle wave a. At 2,393 Super Cycle wave (b) would be twice the length of Super Cycle wave (a) and at that point this bear wave count should be discarded.
Technical Analysis

Click chart to enlarge.
ADX is now below 20 and declining, there is no clear trend, and the S&P 500 is range bound. However, with Monday’s data this will probably change. A downwards trend looks very likely.
The green trend line is no longer providing support and may now provide resistance to upwards corrections.
The long divergence between price as it made new all time highs and On Balance Volume as it moved lower indicates a deeper longer lasting downwards movement should unfold, which may have begun.
I would look for the downwards movement to be interrupted when OBV reaches down to find support at its green trend line.
Lower volume for Monday’s session is only slightly concerning. Higher volume would have supported a downwards trend, but increased volume is not necessary for a downwards trend. The market may fall of its own weight. The market does not need more sellers to push price lower and only needs an absence of buyers, and so a downwards trend may be achieved on lower volume.
Monday should see the shorter 13 day EMA cross below the longer 34 day EMA. This would support a downwards trend.
Dow Theory
Click chart to enlarge.
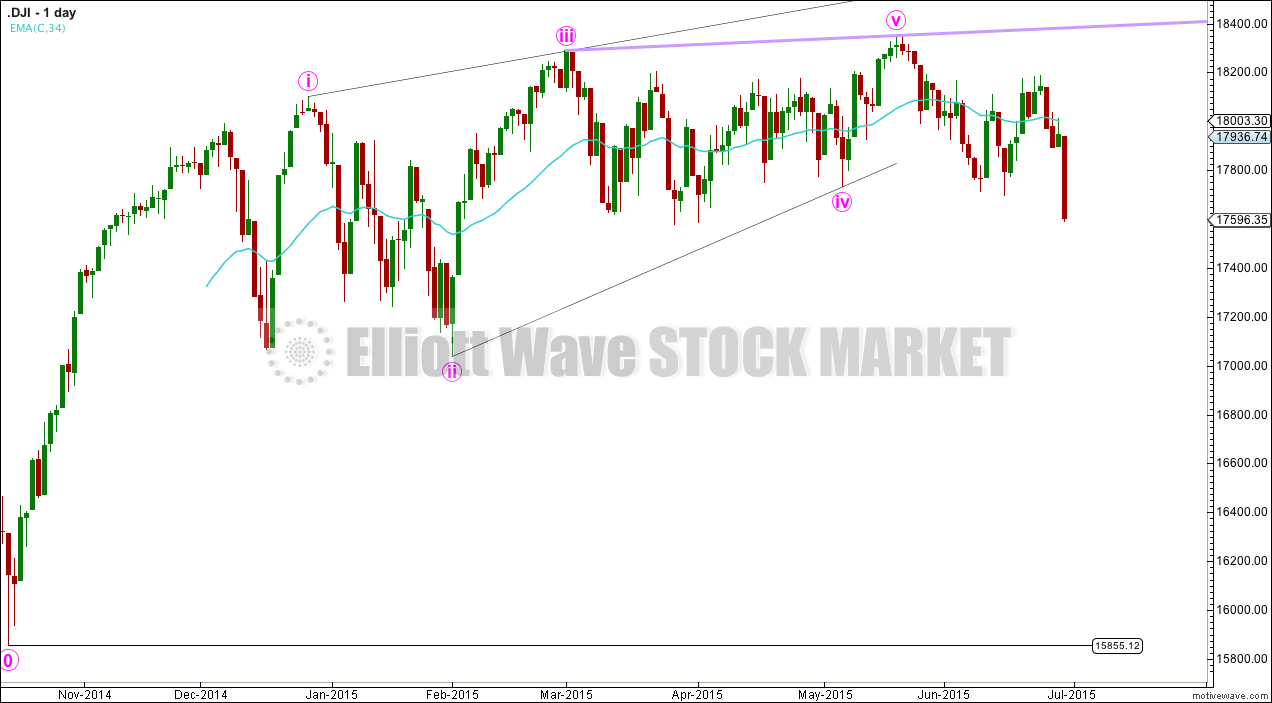
A new low below 15,855.12 must be seen for the Industrials to confirm a bear market. This is a long way away.
DJIA recently made a new all time high, potentially confirming a continuation of the bull market.
Click chart to enlarge.
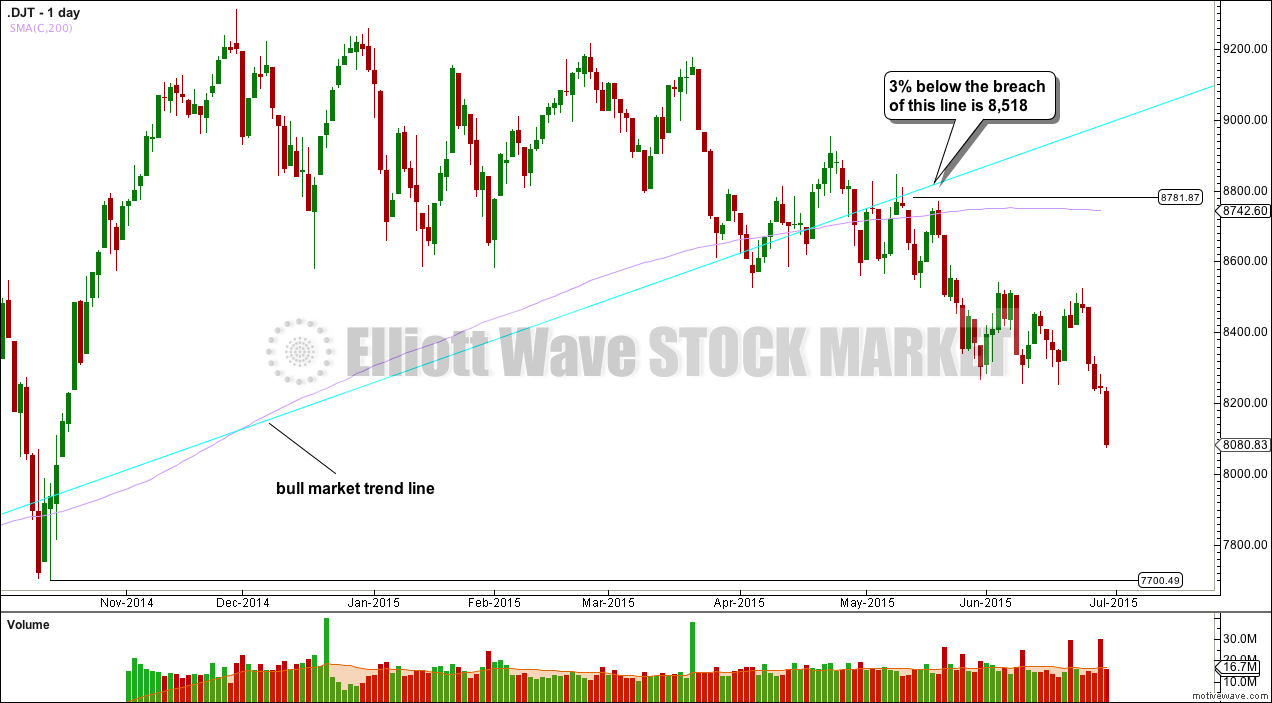
A new low is required below 7,700.49 for the Transportation Index. This is not so far away.
Currently I have more data for DJT than DJIA. DJT has breached its bull market trend line well below a close 3% or market value, that was at 8,518.
DJT has not made a new all time high recently; this was the only index to not do so and the only index to not confirm the continuation of the bull market.
Click chart to enlarge.
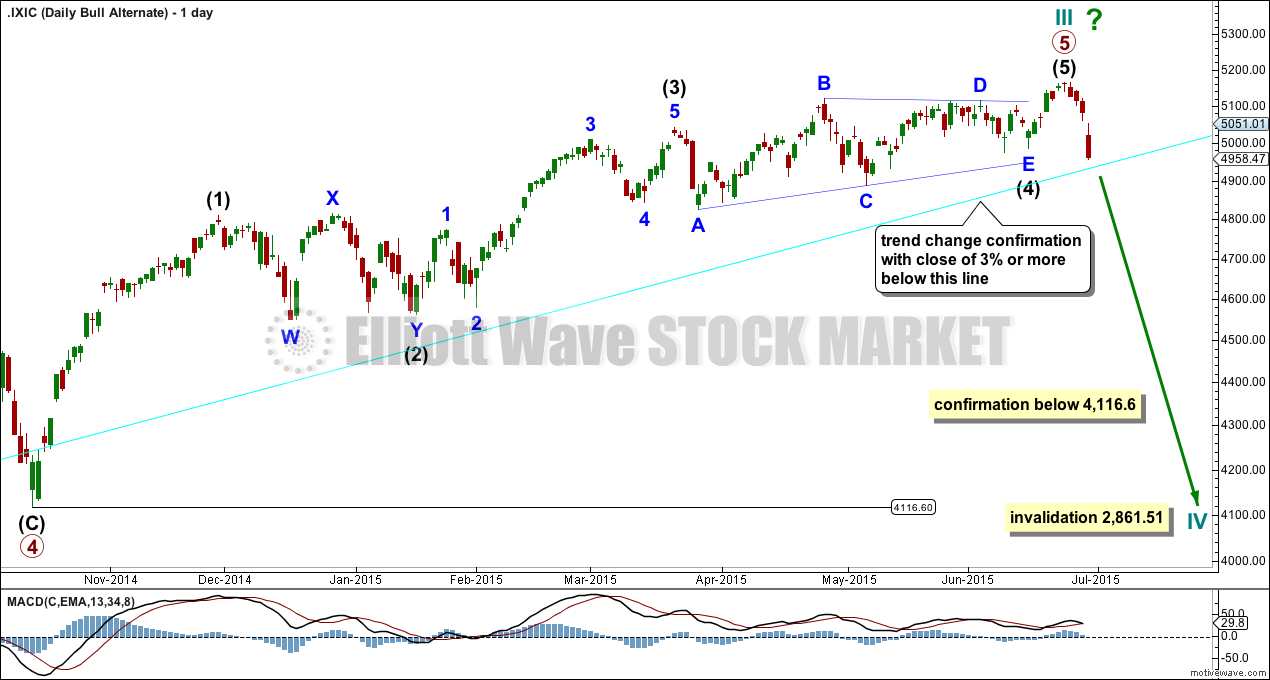
Nasdaq needs to make a new low below 4,116.60 to confirm a bear market. Nasdaq has not yet breached its bull market trend line.
Nasdaq recently made a new all time high, potentially confirming a continuation of the bull market.
Conclusion: a continuation of the bull market has not been confirmed by DJT. But a bear market has not been confirmed yet either. For a bear market to be confirmed by Dow Theory we must see: DJI make a new low below 15,855.12, DJT make a new low below 7,700.49, SPX500 make a new low below 1,820.66 and Nasdaq make a new low below 4,116.60.
This analysis is published about 07:54 p.m. EST.
Looks like 4th wave triangle developing in today’s action. Maybe we will see end of minuette three by day’s end and another 4th wave bounce tomorrow per wave count, probably a green candlestick…