
Upwards movement was expected. Monday did complete a small green candlestick, but a new low of 2 points began the session. This small downwards movement has remained above the invalidation point on the hourly chart.
Summary: I expect now one more upwards wave to 2,152. If this target is met, it may flush out the bears and provide a strong overshoot of the i-iii trend line of the diagonal. At this stage, I expect the target may be met in four trading days.
To see a weekly chart and how to draw trend lines go here. Changes to last analysis are italicised.
Bull Wave Count
Click chart to enlarge.
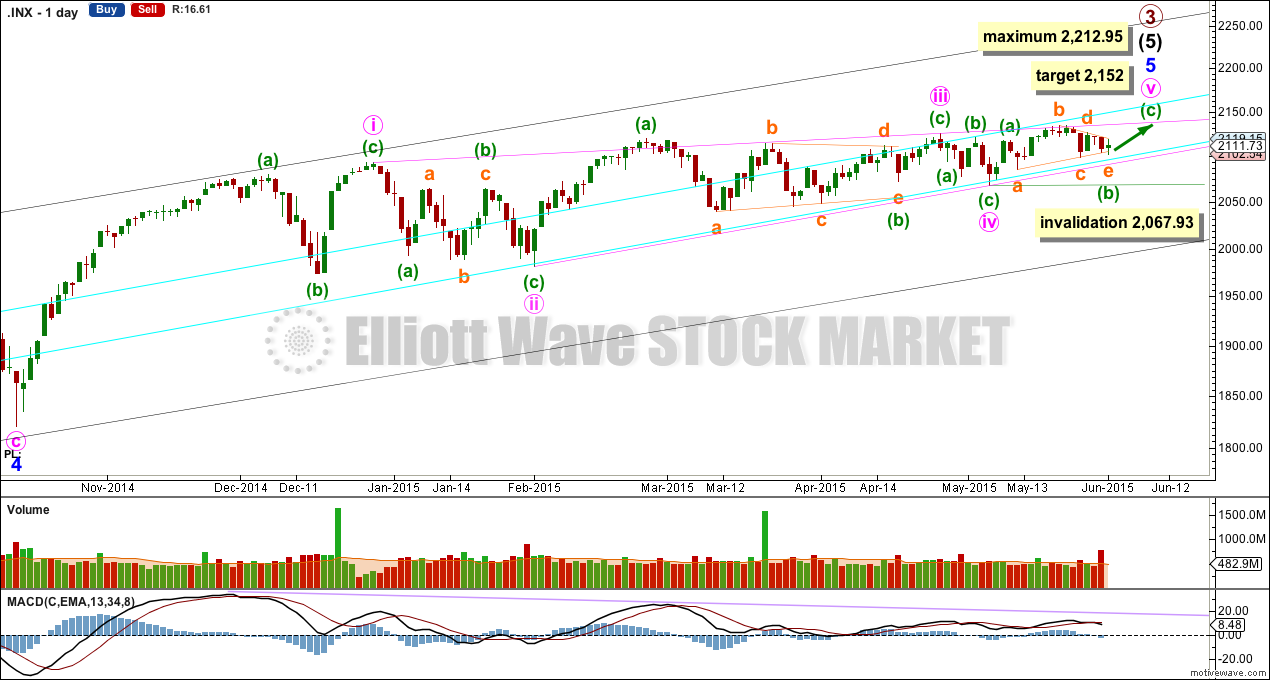
The bull wave count sees primary 1-2-3 within an impulse for a cycle degree wave V.
The bear wave count sees primary A-B-C zigzag for a cycle degree B wave.
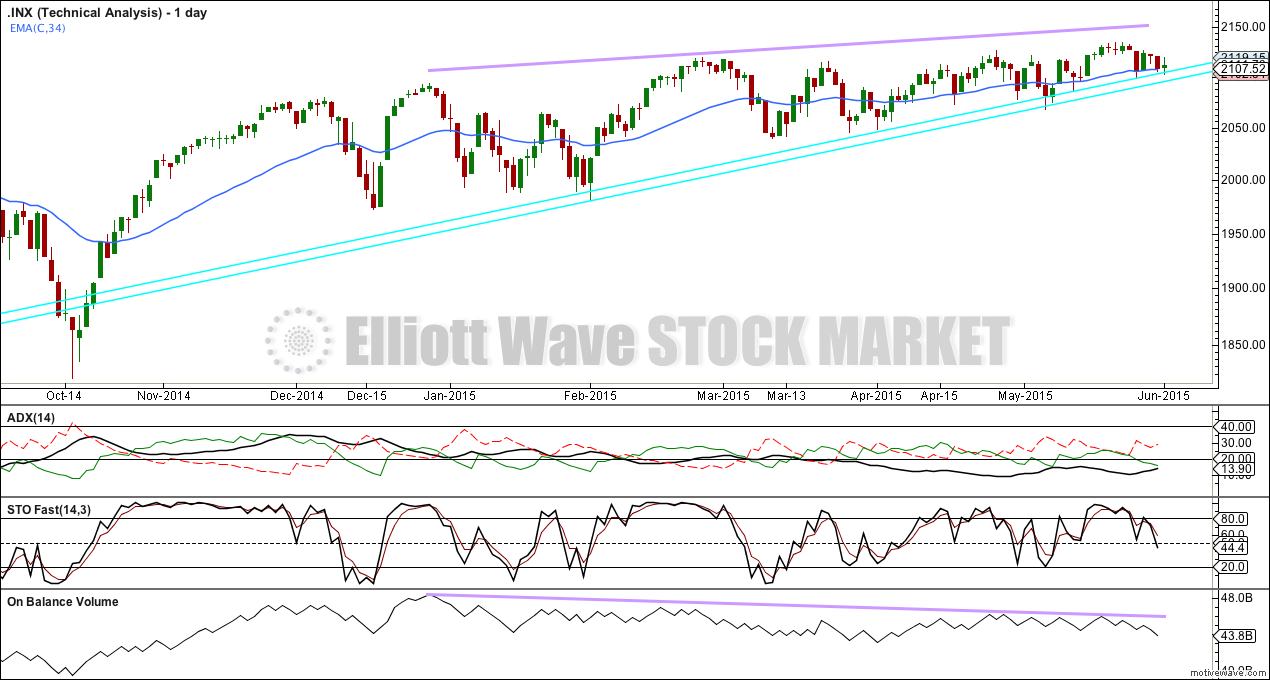
Recent sideways movement fits very nicely as a running contracting triangle. This perfectly explains why ADX remains below 15 indicating no clear trend; triangles have no trend, they are sideways structures.
At 2,152 minuette wave (c) would reach equality in length with minuette wave (a). If the target is met in another four trading days, then minute wave v may total a Fibonacci 21 sessions.
The diagonal of minor wave 5 is contracting so minute wave v must be shorter than minute wave iii. Minute wave iii may not be the shortest wave. At 2,212.95 minute wave v would reach its maximum length at equality with minute wave iii.
Contracting diagonals most often end with a reasonably strong overshoot of the 1-3 trend line. The target would see this.
The diagonal trend lines are converging, and they are getting to be quite close together. This structure must end before the diagonal trend lines cross over which would be on 3rd August. Because the trend lines are now very close together, I would expect a quicker end to this final wave up, which may be this week.
Minuette wave (b) may not move beyond the start of minuette wave (a) below 2,067.93.
Click chart to enlarge.
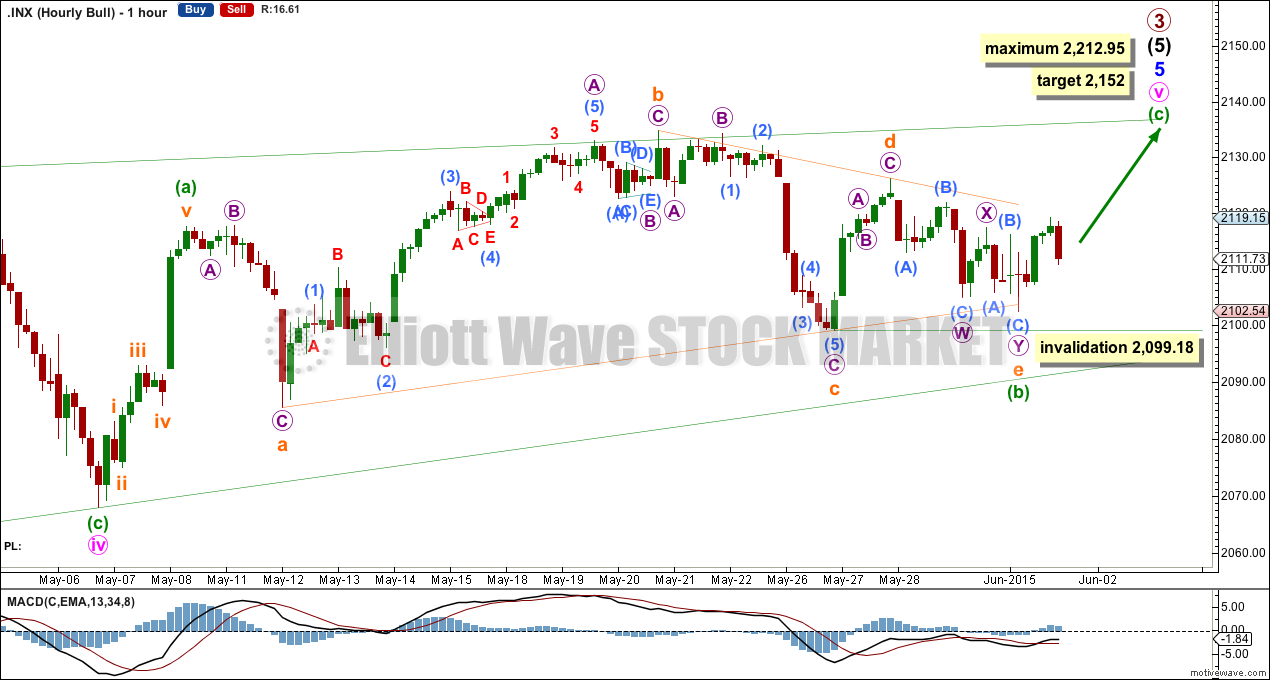
The hourly chart shows all of minute wave v zigzag.
Subminuette wave e of the triangle moved a little lower to begin Monday’s session, ending with a slight overshoot of the a-c trend line. E waves most commonly undershoot the A-C trend line, but sometimes they end with an overshoot. Because this line is now overshot, it is extremely likely that the triangle is over now.
At 2,152 minuette wave (c) would reach equality in length with minuette wave (a). This target would see the diagonal trend line comfortably overshot. This is the most common look for the final fifth wave of a contracting diagonal. If the overshoot looks substantial, it may be enough flush out most bears. That may turn the market players overwhelmingly bullish, which may provide the right conditions for a big trend change. If the target is reached though, it would not be high enough to provide a move 3% or more above the trend line.
The target at 2,152 would see minute wave v comfortably overshoot the i-iii trend line.
Alternate Bull Wave Count
Click chart to enlarge.
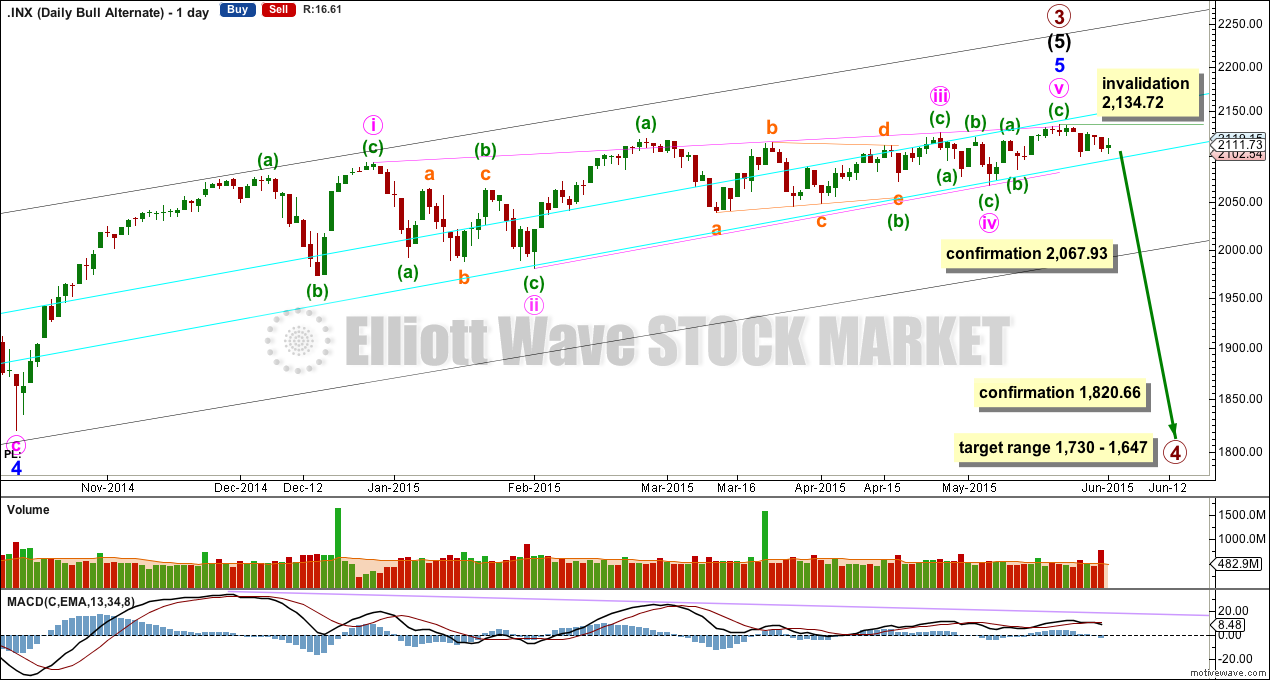
It is possible that the S&P has seen a primary degree (or for the bear count below a cycle degree) trend change seven days ago.
This wave count absolutely requires confirmation at the daily chart level before any confidence may be had in a primary (or cycle) degree trend change. Confirmation would come with:
1. A close of 3% or more of market value below the lower aqua blue trend line.
2. A clear five down on the daily chart.
3. A new low below 1,820.66.
As each condition is met the probability of a substantial trend change would increase.
Primary wave 4 would most likely be a time consuming flat, triangle or combination in order to exhibit structural alternation with the zigzag of primary wave 2. Primary wave 2 lasted 12 weeks. Primary wave 4 is likely to be longer in duration because combinations and triangles particularly are more time consuming than zigzags which tend to be quick corrections. Primary wave 4 may be expected to last more than 12 weeks, and may end with a total Fibonacci 13 or more likely 21 weeks.
Bear Wave Count
Click chart to enlarge.
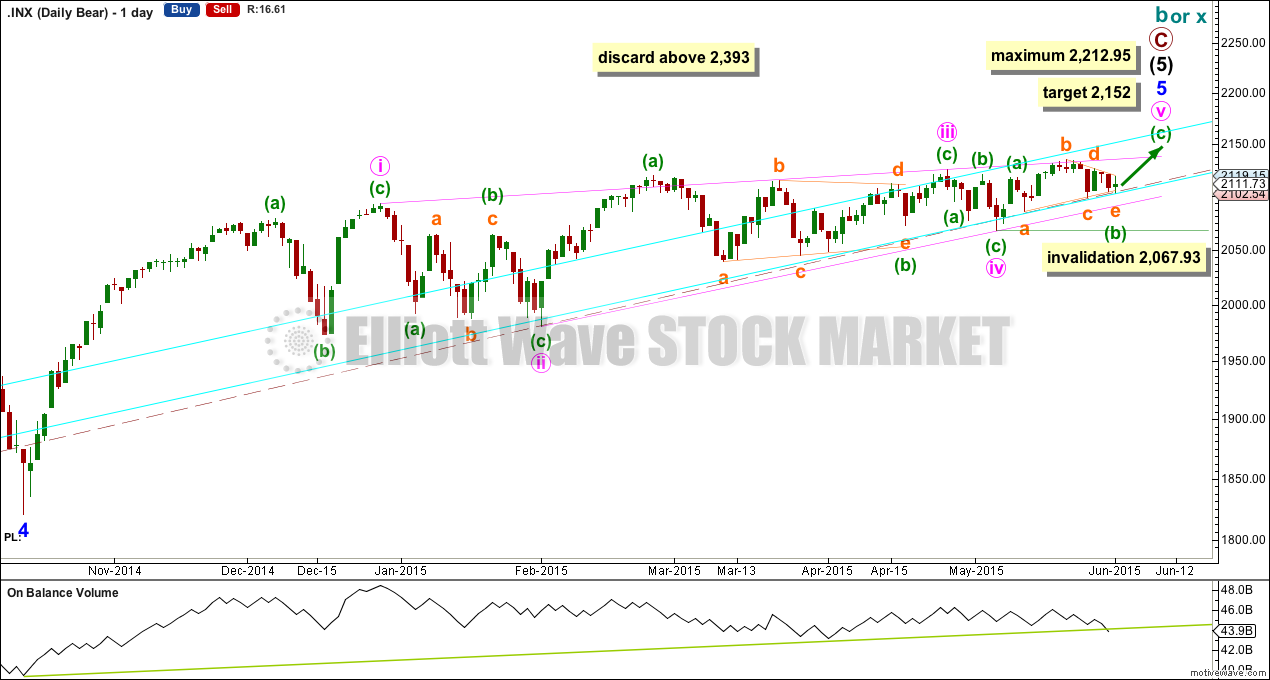
The subdivisions within primary waves A-B-C are seen in absolutely exactly the same way as primary waves 1-2-3 for the bull wave count.
To see the difference at the monthly chart level between the bull and bear ideas look at the last historical analysis here.
At cycle degree wave b is over the maximum common length of 138% the length of cycle wave a, at 170% the length of cycle wave a. At 2,393 cycle wave b would be twice the length of cycle wave a and at that point this bear wave count should be discarded.
While we have no confirmation of this wave count we should assume the trend remains the same, upwards. This wave count requires confirmation before I have confidence in it. Full and final confirmation that the market is crashing would only come with a new low below 1,370.58. However, structure and momentum should tell us long before that point which wave count is correct, bull or bear.
On Balance Volume has very slightly breached a trend line which began back in October 2014. This may be an early warning of more downwards movement to come.
Technical Analysis
Click chart to enlarge.
ADX has turned up further, but still remains below 15. No clear trend is yet indicated and a range bound trading system should still be employed as opposed to a trend following system. This system outlined here uses Stochastics as an oscillator to indicate where each swing may begin and end. Stochastics has not reached oversold though, so this system expects a little more downwards movement from here. This diverges from the main Elliott wave count at this stage.
However, in this case because price is slowly moving higher (the trading range is slightly upwards sloping), Stochastics is not working perfectly. On 16th April Stochastics had returned to normal range from oversold indicating a little more downwards movement to follow. But that did not happen. Price turned up from there to make new all time highs.
We may be about to see a similar situation happen this week.
Since 19th December, 2014, when ADX turned lower and the upwards trend was in decline, this particular range bound system has only worked for about half of the following price movement. It worked up until 23rd May, and since then Stochastics has not managed to properly return to oversold. I have added a second bull market trend line. This upper aqua blue line may be a better indicator of where downwards swings may end than Stochastics at this stage.
On Balance Volume continues to diverge with price. This price rise is not supported by volume. This may be an indicator of a larger correction to arrive soon.
The approach is simple. Slow upwards movement with short swings back down to one of the two aqua blue lines may be expected, until the lower line is breached by a close of 3% or more of market value. At that stage if ADX shows there is a clear trend then the trend should be down. A larger correction would then be expected because that lower trend line has been held since November 2011, so a breach of it would be highly technically significant.
Using Dow theory, I would then look for new lows below the last major swing low of 15th October, 2014, for all of S&P 500, DJIA, DJT and Nasdaq. If that happens then a bear market would be confirmed.
While there is no bear market confirmed and while price remains above the bull market trend lines, then a bull market is still assumed to exist.
This analysis is published about 07:33 p.m. EST.
Smart traders are all looking for the final thrust from this ending contracting diagonal and are going to hammer this market with short positions as soon as it happens. The spiking volume on down days suggests we are soon going to see a massive bearish engulfing candlestick to start the fireworks. I’m in with a few put credit spreads to catch the last move up and switch on a dime….this ought to be really interesting…