
Downwards movement was expected. I am changing the Elliott wave count though, because downwards momentum is weak and there has not been a clear five down on the hourly chart.
Summary: I expect now one more upwards wave to 2,154. If this target is met it may flush out the bears, and provide a strong overshoot of the i-iii trend line of the diagonal. At this stage I expect the target may be met in five trading days.
Changes to last analysis are italicised.
To see a weekly chart and how to draw trend lines go here.
Bull Wave Count
Click chart to enlarge.
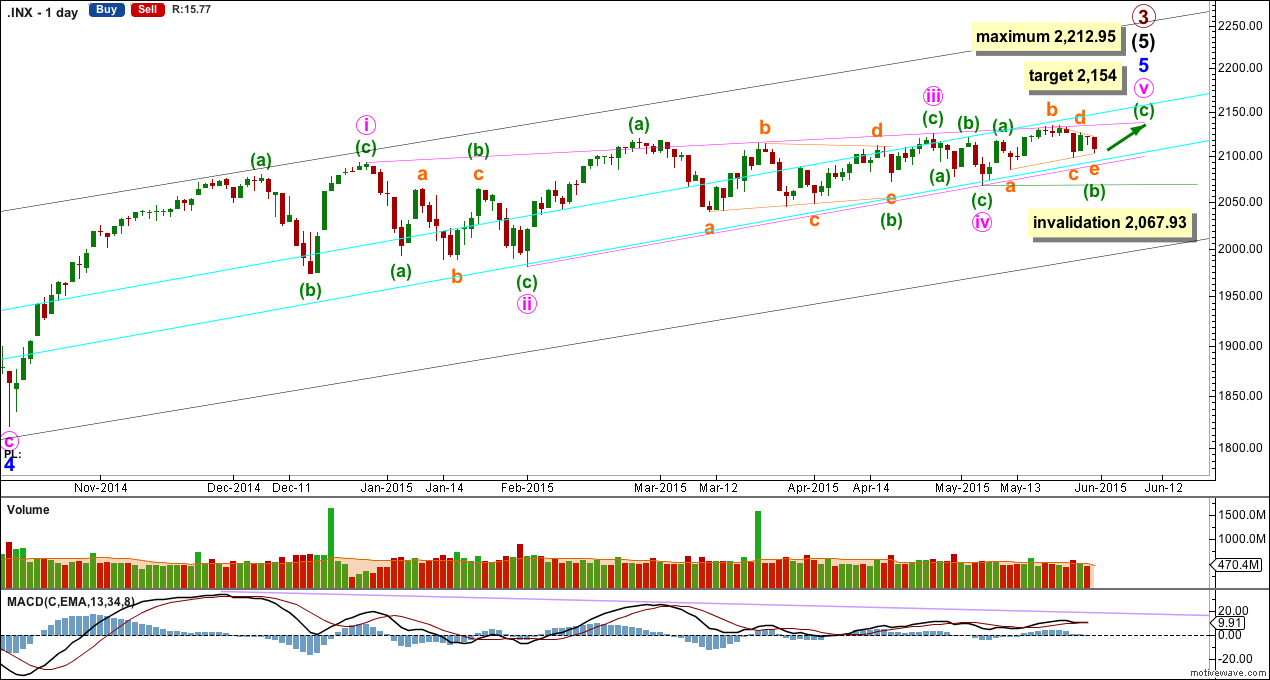
The bull wave count sees primary 1-2-3 within an impulse for a cycle degree wave V.
The bear wave count sees primary A-B-C zigzag for a cycle degree B wave.
I am changing the main bull wave count today. Current sideways / lower movement has not been convincing as a correction following a diagonal, whether it be leading or ending.
Recent sideways movement fits very nicely as a running contracting triangle. All the sub waves fit as single or double zigzags. This perfectly explains the lack of momentum and the absence this week of a five down on the hourly chart. It also explains why ADX remains below 15 indicating no clear trend.
At 2,154 minuette wave (c) would reach equality in length with minuette wave (a). If the target is met in another five trading days then minute wave v may total a Fibonacci 21 sessions.
The diagonal of minor wave 5 is contracting so minute wave v must be shorter than minute wave iii. Minute wave iii may not be the shortest wave. At 2,212.95 minute wave v would reach its maximum length at equality with minute wave iii.
Contracting diagonals most often end with a reasonably strong overshoot of the 1-3 trend line. The target would see this.
Minuette wave (b) may not move beyond the start of minuette wave (a) below 2,067.93.
Click chart to enlarge.
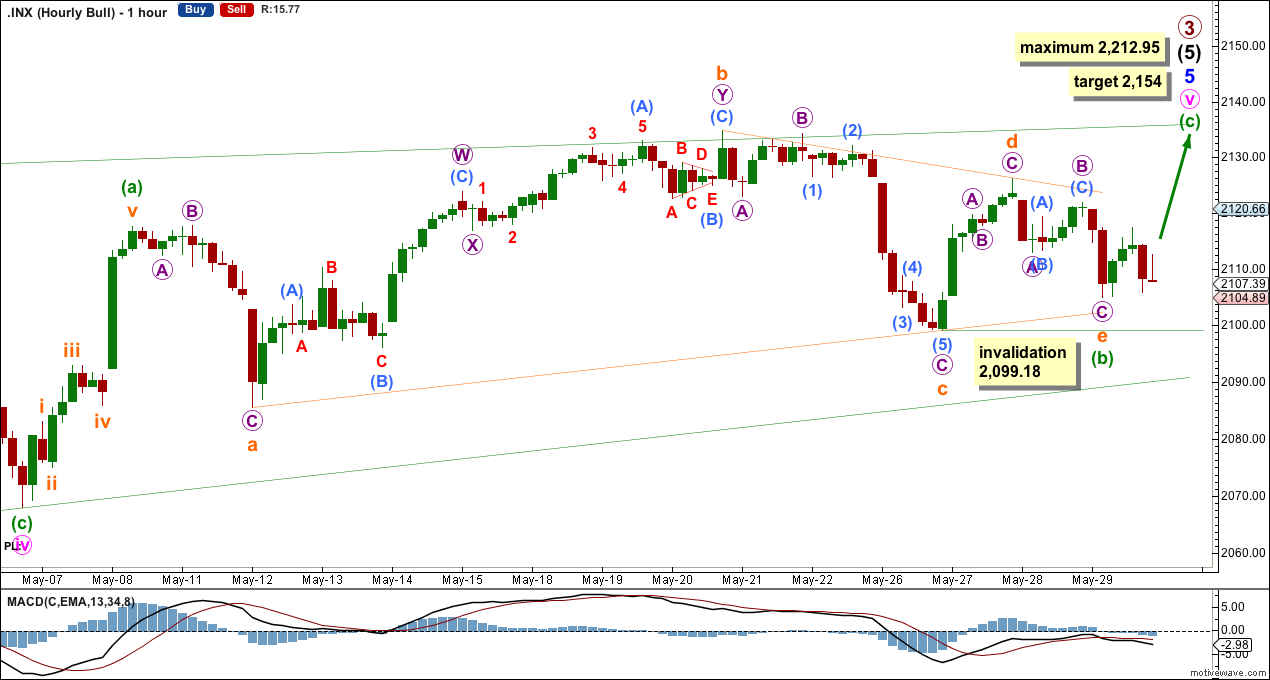
The hourly chart shows all of minute wave v zigzag.
Minuette wave (b) is now a complete running contracting triangle. Subminuette wave b is a 1.53 correction of subminuette wave a, subminuette wave c is a 0.72 correction of subminuette wave b, subminuette wave d is a 0.76 correction of subminuette wave c, and subminuette wave e is a 0.78 correction of subminuette wave d.
Subminuette wave e is very likely be over here because it has such a clear three wave structure. If subminuette wave e were to continue any further, it may not move beyond the end of subminuette wave c below 2,099.18.
Subminuette wave e falls short of the a-c trend line; this is the common way for an E wave of a triangle to end.
The target at 2,154 would see minute wave v comfortably overshoot the i-iii trend line.
Alternate Bull Wave Count
Click chart to enlarge.
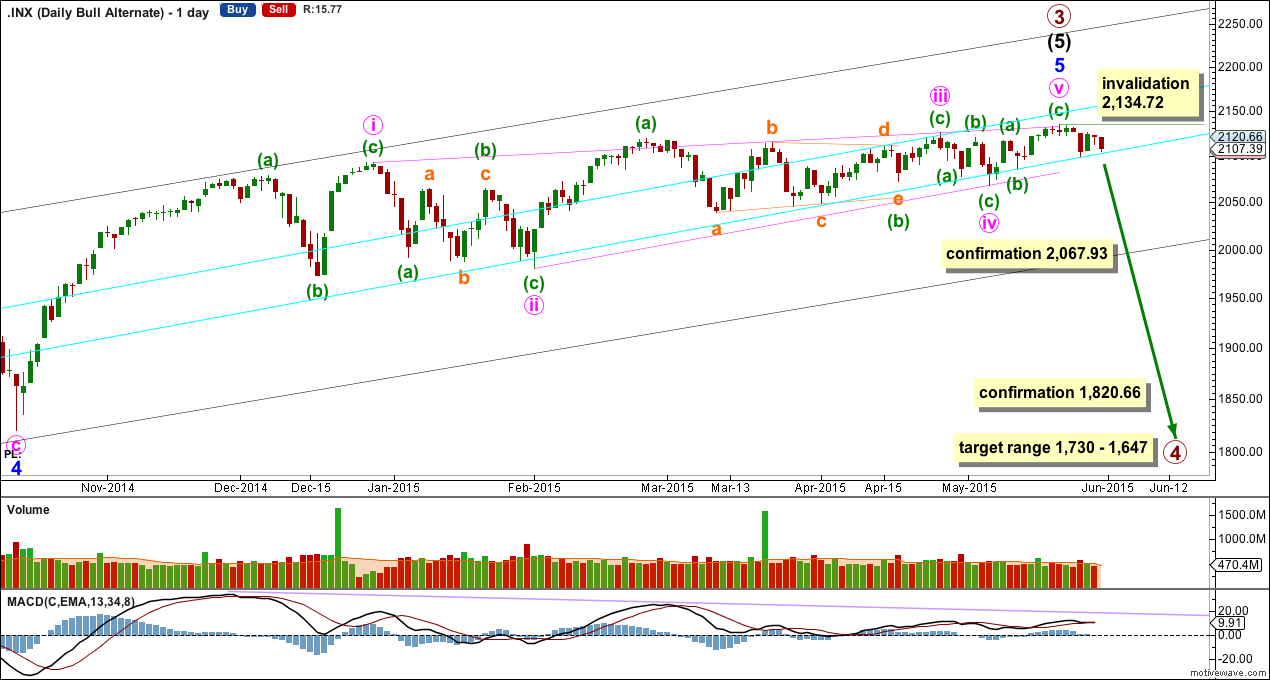
It is possible that the S&P has seen a primary degree (or for the bear count below a cycle degree) trend change six days ago.
This wave count absolutely requires confirmation at the daily chart level before any confidence may be had in a primary (or cycle) degree trend change. Confirmation would come with:
1. A close of 3% or more of market value below the lower aqua blue trend line.
2. A clear five down on the daily chart.
3. A new low below 1,820.66.
As each condition is met the probability of a substantial trend change would increase.
Primary wave 4 would most likely be a time consuming flat, triangle or combination in order to exhibit structural alternation with the zigzag of primary wave 2. Primary wave 2 lasted 12 weeks. Primary wave 4 is likely to be longer in duration because combinations and triangles particularly are more time consuming than zigzags which tend to be quick corrections. Primary wave 4 may be expected to last more than 12 weeks, and may end with a total Fibonacci 13 or more likely 21 weeks.
Bear Wave Count
Click chart to enlarge.
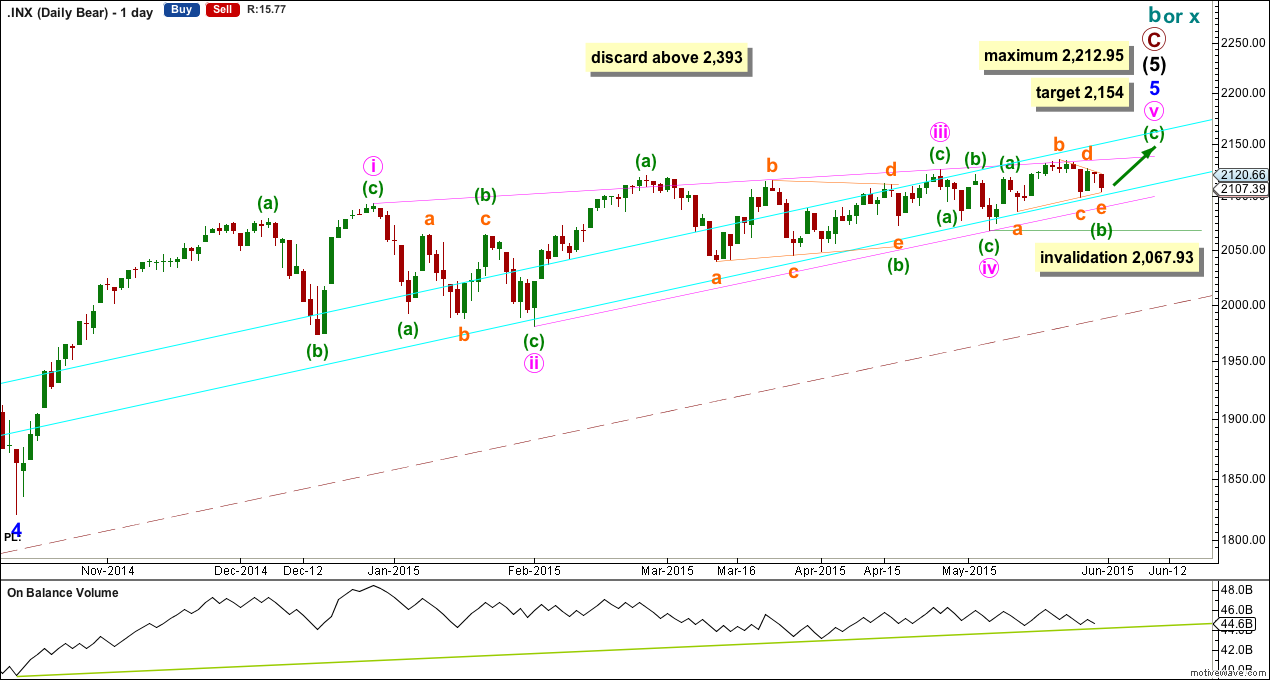
The subdivisions within primary waves A-B-C are seen in absolutely exactly the same way as primary waves 1-2-3 for the bull wave count.
To see the difference at the monthly chart level between the bull and bear ideas look at the last historical analysis here.
At cycle degree wave b is over the maximum common length of 138% the length of cycle wave a, at 170% the length of cycle wave a. At 2,393 cycle wave b would be twice the length of cycle wave a and at that point this bear wave count should be discarded.
While we have no confirmation of this wave count we should assume the trend remains the same, upwards. This wave count requires confirmation before I have confidence in it. Full and final confirmation that the market is crashing would only come with a new low below 1,370.58. However, structure and momentum should tell us long before that point which wave count is correct, bull or bear.
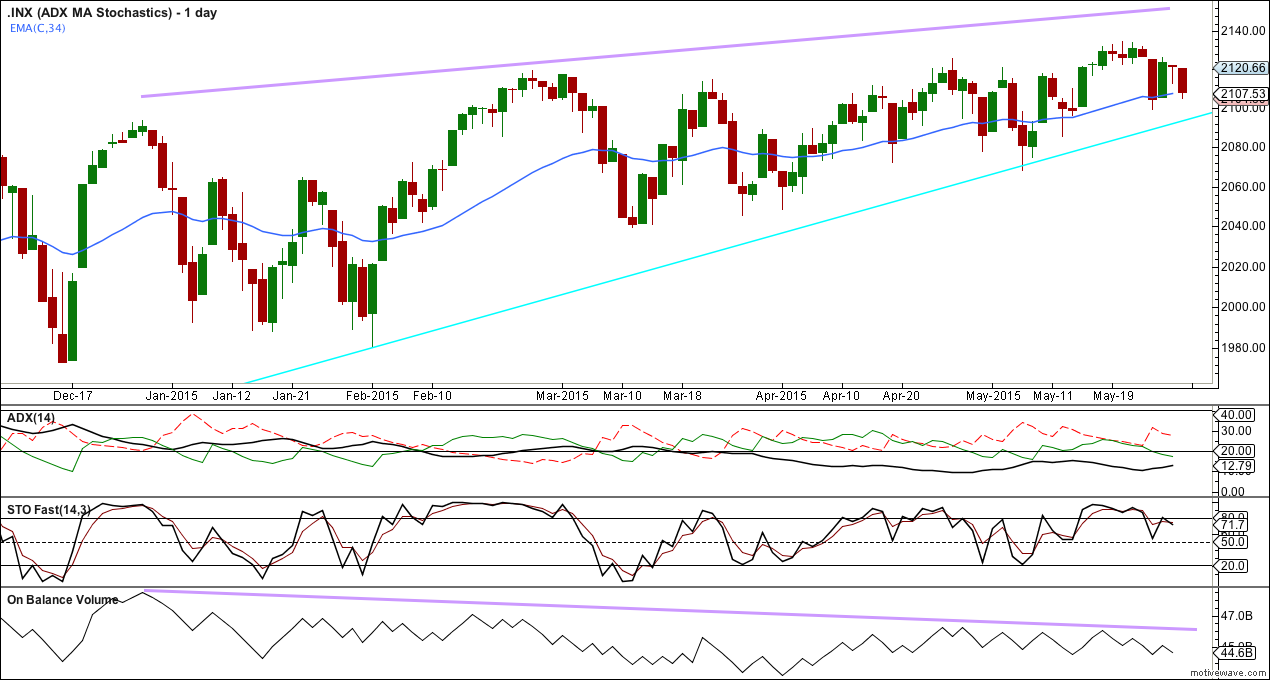
On Balance Volume should continue to find support at the trend lines drawn. When the longer held green trend line is broken by OBV a trend change would be supported.
Technical Analysis
Click chart to enlarge.
Although ADX has turned up slightly, it remains below 15 indicating no clear trend.
Stochastics has moved out of overbought territory. Data for Friday’s session will bring Stochastics down further.
On Balance Volume shows persistent divergence with price; this price rise since December last year is not supported by volume, it is questionable. This may indicate a more substantial correction could come soon.
Price remains above the long held bull market trend line which goes back to November 2011. While price is above this line a bull market remains intact.
DJT has seen a strong fall, but it has not yet made new lows below that of 15th October 2014. For a bear market to be confirmed using Dow theory the DJT, S&P 500, DJIA and Nasdaq must make new lows below their 15th October lows.
S&P 500 has recently made new highs, as has DJIA. But DJT and Nasdaq have not, a continuation of the bull market is unconfirmed at this stage.
This analysis is published about 03:51 a.m. EST.
Lots of whipsawing for Monday’s action. Classic attempts to shakeout both bears and bulls prior to final run up. Final thrust from triangle should occur today I think but I would be very surprised if upwards movement lasts the entire week. The move down is going to be brutal..and the MMs know it…
Thx Lara! I’m impressed with the triangle count. I think it solves a lot of issues I was seeing along with other indices (too many to name). Are you concerned the cursory count from 2105 appears to be 7 on the 5 min chart? It does not look impulsive.
Yes, I really like this new wave count. I hope it’s just in time for members to catch a last wave up.
No I’m not concerned with that seven up; I can see an impulse ending at five up, followed by an expanded flat subdividing 3-3-5. The wave down from 2,117 to 2,105 (following the wave up you’re seeing as a seven) fits perfectly as a five, so it could be a C wave of an expanded flat.
But I’ve learned the hard way to not give total weight to the five minute chart. It’s put me off as often as it’s put me right.
I will be on the look out now for upward movement but I have to disagree based on Daily MACD and Stochastics looks to me as if we move hard Monday to the downside. I am always out over the weekend anyway, this gives me a new prospective for Monday. Thanks
That would have required Friday’s triangle to be a fourth wave since triangles always occur in the position prior to the final actionary wave…tough to see that count
Hello Lara,
Your count looks very feasible. If price goes below 2098 do you think my count makes sense on 15 min chart ?
Aseem
spx
You seem to have second waves which look like triangles? Its key to identify how those corrections subdivide. A triangle may not be the sole corrective structure within a second wave.
Hi Lara, I thought the previous downward count was very doubtful as I could also not see 5 waves down. I think your new count will prove accurate. Nick