
Sideways movement was expected to complete a small fourth wave correction to about 2,107, a small green candlestick or doji was expected for Wednesday. This is not what happened. Price moved much higher than expected, breaching the invalidation point on the hourly chart.
Summary: A deep second wave correction may be over here or very soon. The next move for the S&P may be a strong third wave down to a short term target about 2,069.
Changes to last analysis are italicised.
To see a weekly chart and how to draw trend lines go here.
Bull Wave Count
Click chart to enlarge.
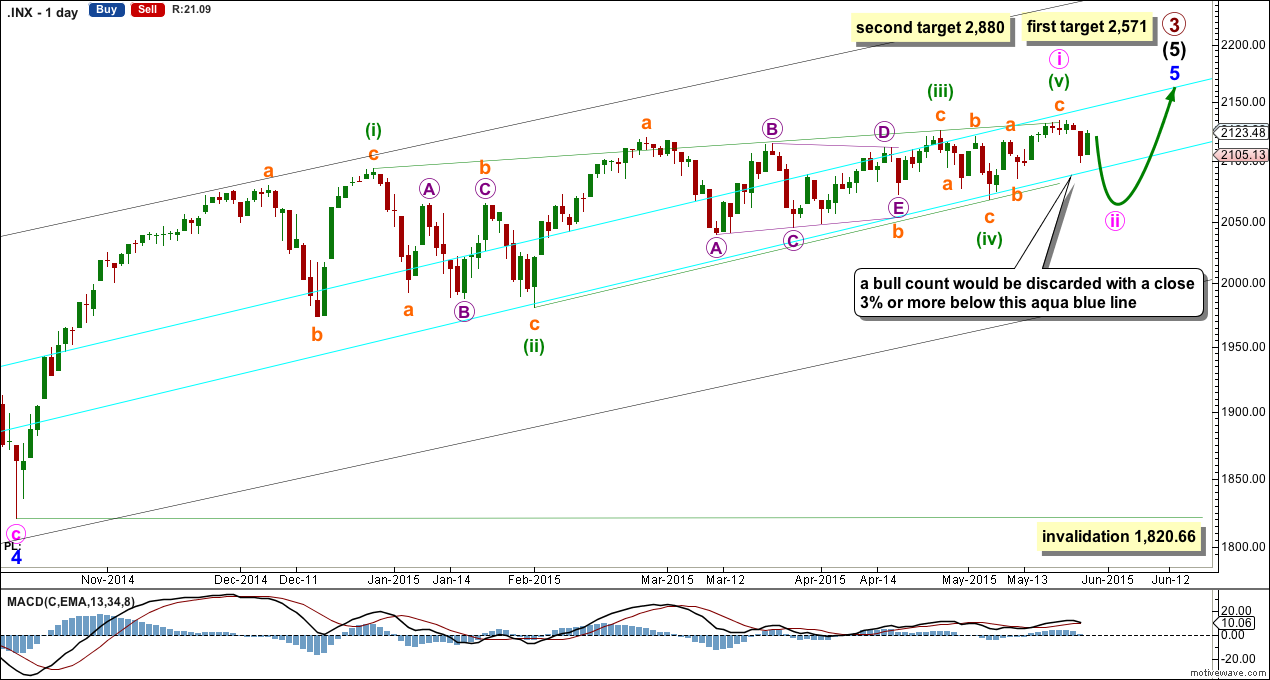
The bull wave count sees primary 1-2-3 within an impulse for a cycle degree wave V.
The bear wave count sees primary A-B-C zigzag for a cycle degree B wave.
We should always assume the trend remains the same until proven otherwise. I will have the main wave count relatively bullish while price remains above the lower aqua blue trend line which has provided support for this bull market since 2011. Only when that trend line is breached by a close of 3% or more of market value will I have my main wave count bearish.
The complete contracting diagonal may have been only minute wave i as a leading diagonal within minor wave 5.
At 2,571 intermediate wave (5) would reach 1.618 the length of intermediate wave (3). If upwards movement keeps going past this first target, or when price gets there the structure is incomplete, then the second target would be used.
At 2,880 primary wave 3 would reach 2.618 the length of primary wave 1.
There is now a complete contracting diagonal structure, although the final fifth wave has only slightly overshot the (i)-(iii) trend line. There is now first confirmation of a trend change at least at a small degree on the hourly chart. Normally a second wave correction following a first wave leading diagonal is very deep. In this case it may be expected to be shallow due to strong support offered by the lower aqua blue trend line. An overshoot of this line is allowed for (like that seen for the end of minor wave 4 at the left on the daily chart) as long as price does not close 3% or more below the line.
For both main and alternate bull wave counts some downwards movement is now expected. For this main bull count it may be a low degree second wave for minute wave ii, which should not breach the lower aqua blue trend line by a close of 3% or more of market value.
Minute wave ii may not move beyond the start of minute wave i below 1,820.66. While this price point would provide final price invalidation of this bull wave count, it would be discarded before this point is passed when the aqua blue trend line is breached.
Click chart to enlarge.
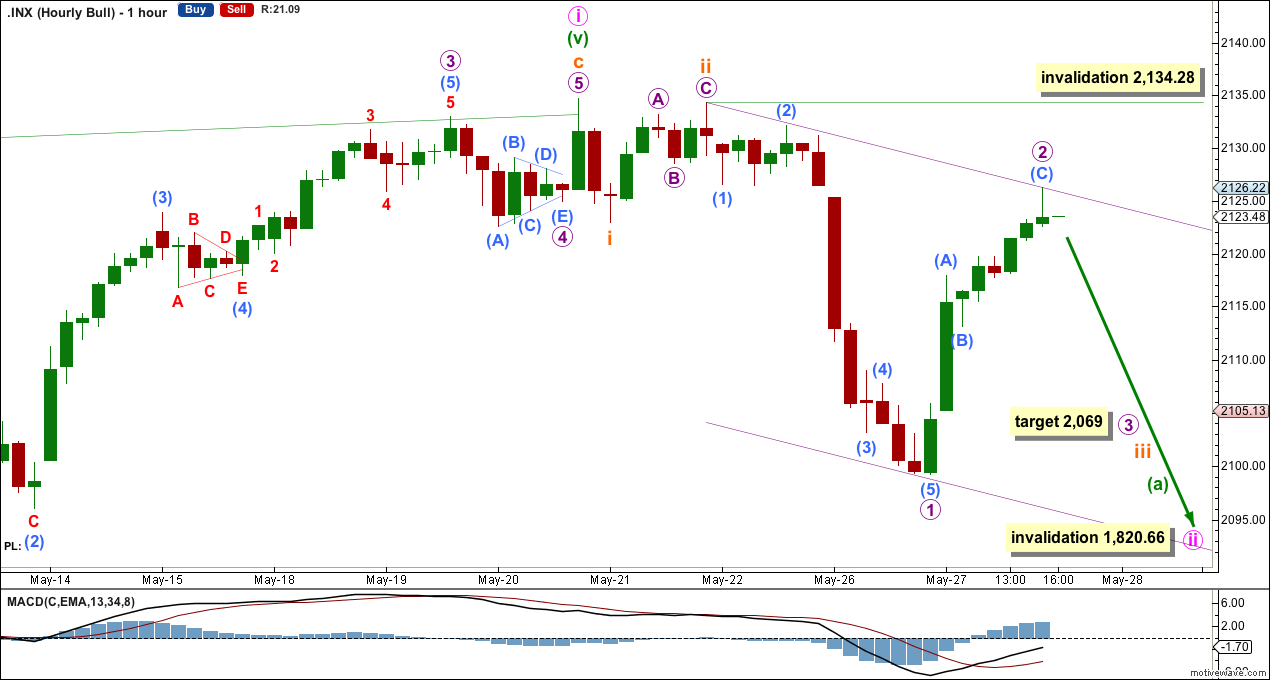
Upwards movement is too deep for a fourth wave correction. This upward movement may be another deep second wave correction, which is a very common way for an impulse to begin.
Micro wave 2 may not move beyond the start of micro wave 1 above 2,134.28. At 2,069 micro wave 3 would reach 1.618 the length of micro wave 1.
Minute wave ii is most likely to subdivide as a zigzag. Minuette wave (a) is most likely to subdivide as a five wave structure.
Even for a correction at only minute wave degree, it should begin the new trend with a clear five down at the hourly chart level. We do not have that yet.
Draw a base channel about micro waves 1 and 2. The upper trend line so far is showing where price is finding resistance, and may continue to do so. This may be where micro wave 2 ends.
Alternate Bull Wave Count
Click chart to enlarge.
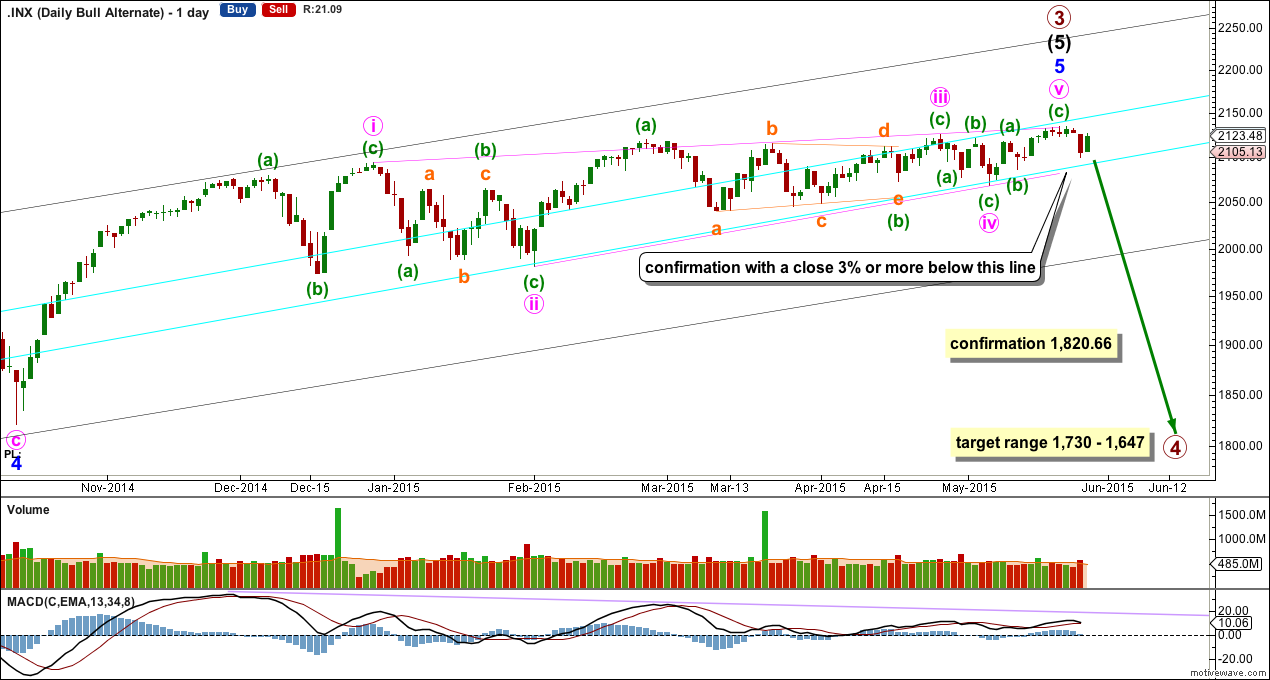
It is possible that the S&P has seen a primary degree (or for the bear count below a cycle degree) trend change five days ago.
This alternate bull wave count simply moves the degree of labelling within the contracting diagonal all up one degree to see it as an ending diagonal for minor wave 5.
This wave count absolutely requires confirmation at the daily chart level before any confidence may be had in a primary (or cycle) degree trend change. Confirmation would come with:
1. A close of 3% or more of market value below the lower aqua blue trend line.
2. A clear five down on the daily chart.
3. A new low below 1,820.66.
As each condition is met the probability of a substantial trend change would increase.
Primary wave 4 would most likely be a time consuming flat, triangle or combination in order to exhibit structural alternation with the zigzag of primary wave 2. Primary wave 2 lasted 12 weeks. Primary wave 4 is likely to be longer in duration because combinations and triangles particularly are more time consuming than zigzags which tend to be quick corrections. Primary wave 4 may be expected to last more than 12 weeks, and may end with a total Fibonacci 13 or more likely 21 weeks.
Bear Wave Count
Click chart to enlarge.
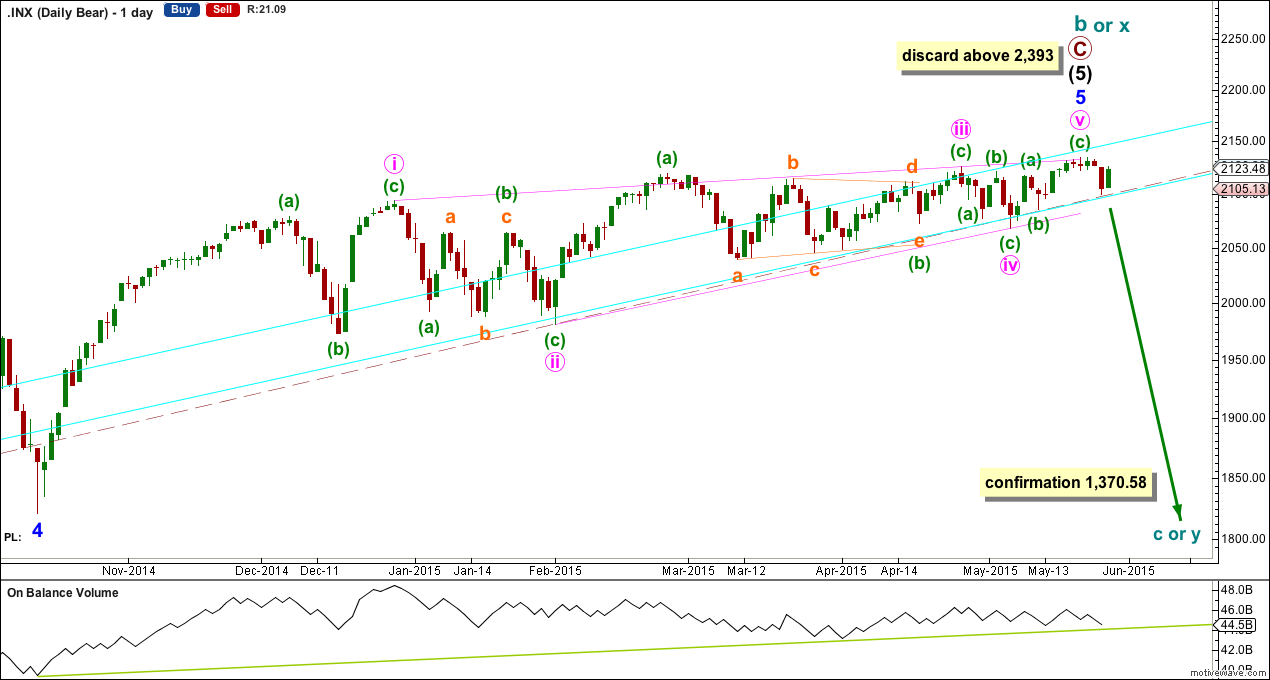
The subdivisions within primary waves A-B-C are seen in absolutely exactly the same way as primary waves 1-2-3 for the bull wave count.
To see the difference at the monthly chart level between the bull and bear ideas look at the last historical analysis here.
At cycle degree wave b is over the maximum common length of 138% the length of cycle wave a, at 170% the length of cycle wave a. At 2,393 cycle wave b would be twice the length of cycle wave a and at that point this bear wave count should be discarded.
While we have no confirmation of this wave count we should assume the trend remains the same, upwards. This wave count requires confirmation before I have confidence in it. Full and final confirmation that the market is crashing would only come with a new low below 1,370.58. However, structure and momentum should tell us long before that point which wave count is correct, bull or bear.
On Balance Volume should continue to find support at the trend lines drawn. When the longer held green trend line is broken by OBV a trend change would be supported.
Technical Analysis
Click chart to enlarge.
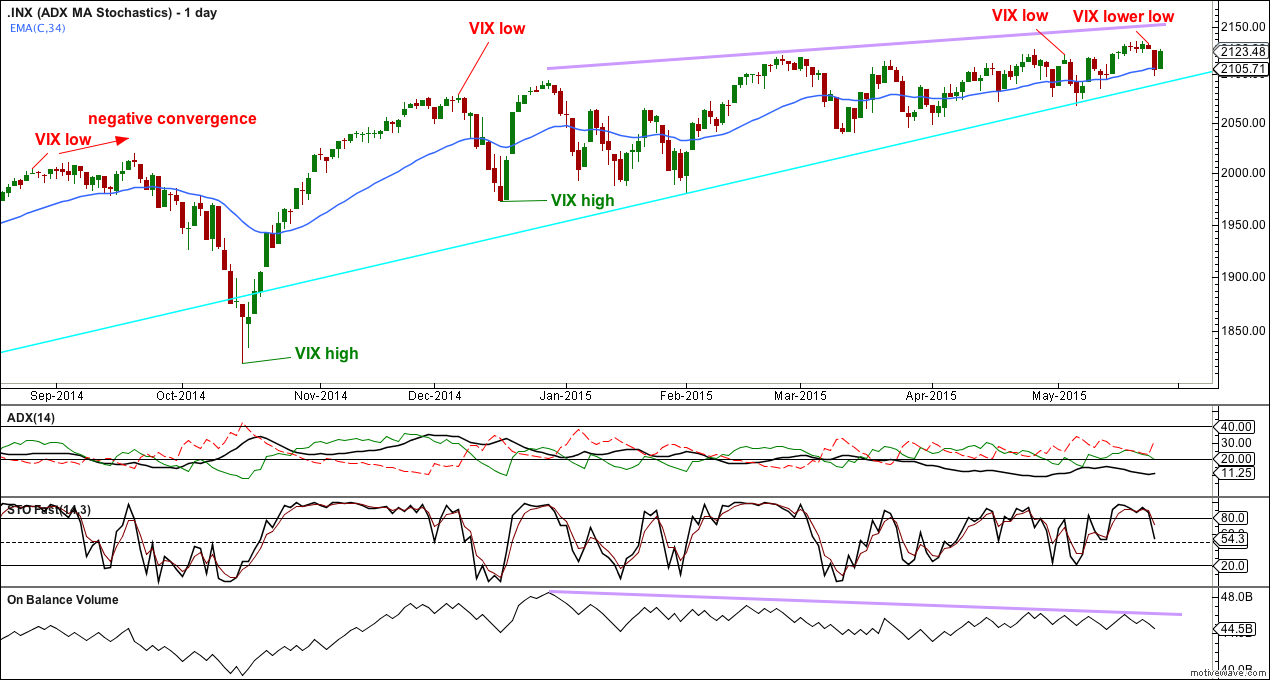
ADX turned up slightly for Monday but remains below 15. This still indicates there is no clear trend. Short swings and low volatility may be expected. A range trading system would still be better to use than a trend trading system.
Stochastics has declined from overbought, but has not yet reached oversold. A continuation of at least a small downwards swing would be expected until Stochastics again reaches oversold.
Wednesday’s strong price rise saw no new high for the S&P, DJIA, DJT nor Nasdaq. All remain below recent highs. The bull market continuation is unconfirmed.
For a bear market to be confirmed new lows in all of the S&P, DJIA, DJT and Nasdaq beyond their lows of 15th October would have to be seen. So far all four markets remain above their lows of 15th October 2014, including DJT which has seen the biggest fall.
There is persistent divergence between price trending higher and On Balance Volume trending lower since December 2014. This long divergence may be an indicator of a reasonable drop in price to come.
Click chart to enlarge.
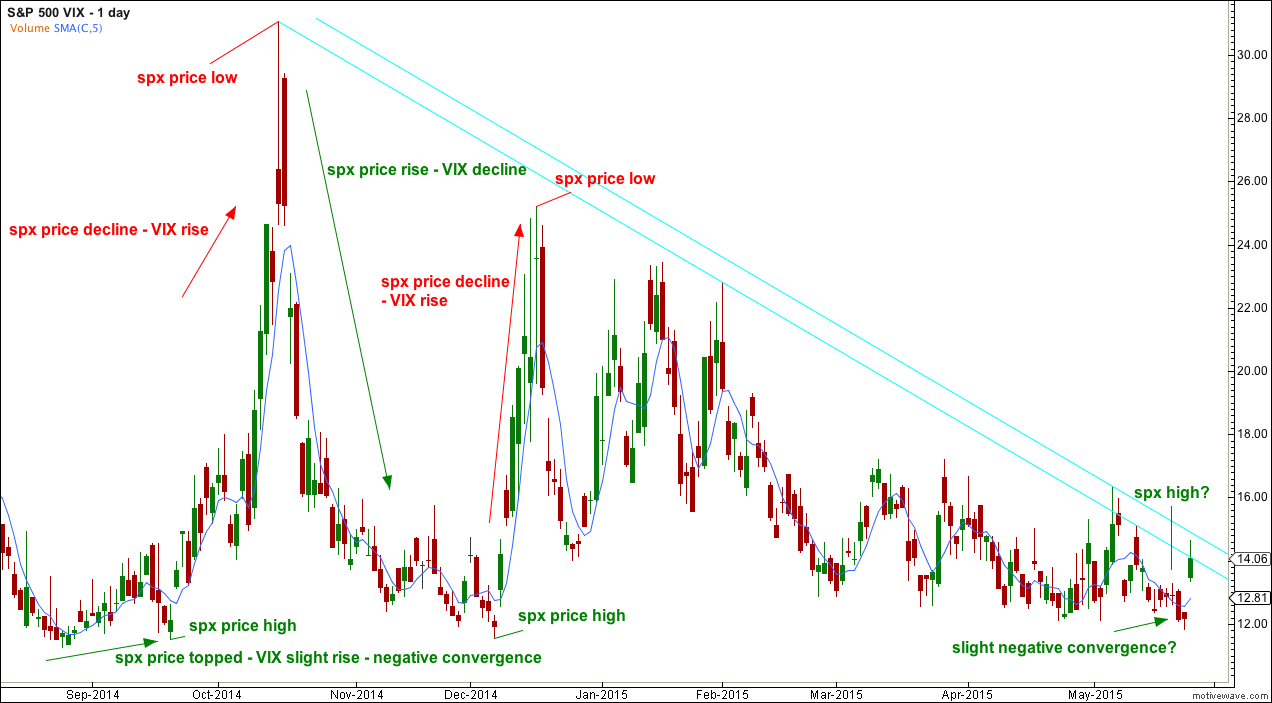
There may be a little negative convergence at the recent price high for the S&P. While price made a new high VIX slightly increased also.
The prior two price lows of 15th October and 16th December for the S&P corresponded perfectly with highs in the VIX.
The last two price declines for the S&P 500 ended exactly at highs for VIX. The price decline from 19th September to 15th October, 2014 did not begin at a VIX low exactly, there was a little negative convergence before price turned. As price moves higher up to 19th September VIX also slightly moved higher.
This may have happened again. As price moved slightly higher up to 20th May, 2015 VIX also slightly increased up to that date.
From 20th to 22nd May VIX slightly declined, while price moved sideways. The price drop of 26th May has seen VIX increase. If VIX breaks above the recent bear trend line that may allow for further drops in the S&P for price. While VIX remains below the upper double aqua trend line a trend change for price will continue to be in doubt.
This analysis is published about 06:59 p.m. EST.
No third wave down today in my opinion. I am starting to think we are going to ultimately see the overshoot of the diagonal trend-line prior to the real reversal. This is NOT the way ending diagonals behave when they complete….