
Again upwards movement may be over, but confirmation is required.
Summary: The trend channel on the hourly chart should be breached tomorrow, if there has been a trend change. While price remains within the channel on the hourly chart, it must be accepted that a little more upwards movement may unfold before a trend change.
Click charts to enlarge.
To see a weekly chart and how to draw trend lines go here.
Bull Wave Count
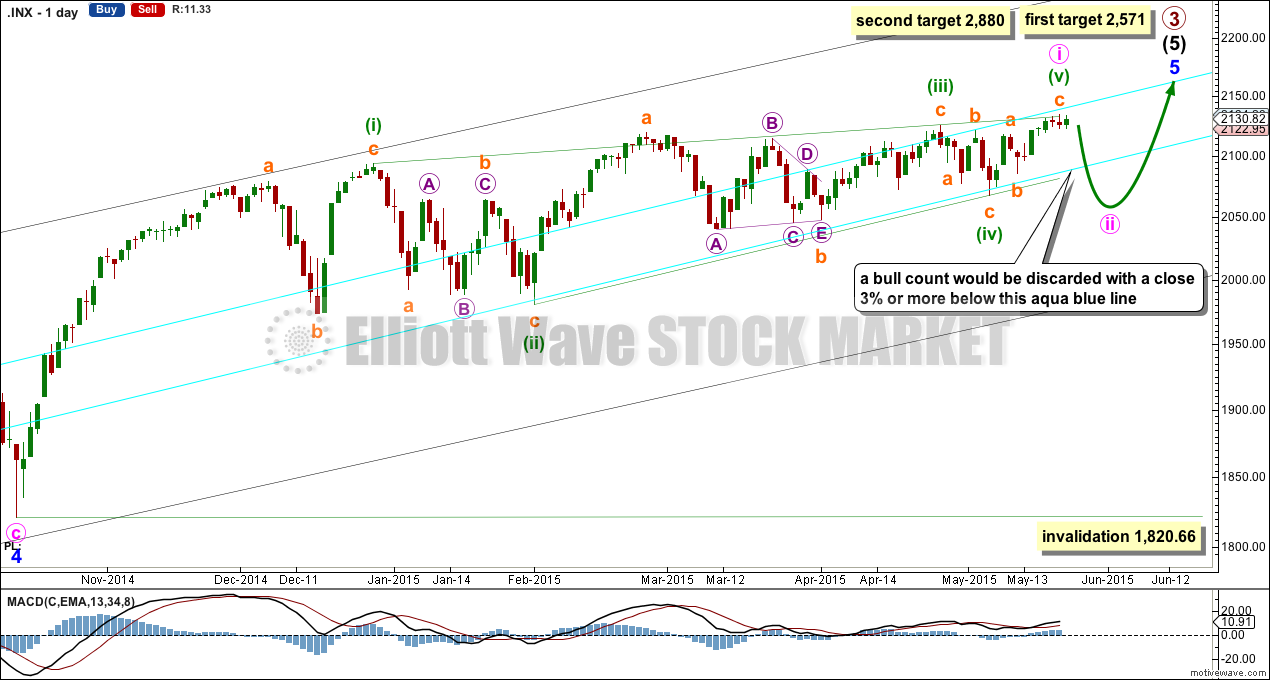
The bull wave count sees primary 1-2-3 within an impulse for a cycle degree wave V.
The bear wave count sees primary A-B-C zigzag for a cycle degree B wave.
We should always assume the trend remains the same until proven otherwise. I will have the main wave count bullish while price remains above the lower aqua blue trend line which has provided support for this bull market since 2011. Only when that trend line is breached by a close of 3% or more of market value will I have my main wave count bearish.
The complete contracting diagonal may have been only minute wave i as a leading diagonal within minor wave 5.
At 2,571 intermediate wave (5) would reach 1.618 the length of intermediate wave (3). If upwards movement keeps going past this first target, or when price gets there the structure is incomplete, then the second target would be used.
At 2,880 primary wave 3 would reach 2.618 the length of primary wave 1.
There is now a complete contracting diagonal structure, although the final fifth wave has only slightly overshot the (i)-(iii) trend line. While there is zero confirmation of a trend change at any degree, it must be accepted that price may yet move a little higher for this overshoot to be stronger, before a trend change occurs.
For both main and alternate bull wave counts some downwards movement is now expected. For this main bull count it may be a low degree second wave for minute wave ii, which should not breach the lower aqua blue trend line by a close of 3% or more of market value. An overshoot (like that seen for the end of minor wave 4) may be expected only.
Minute wave ii may not move beyond the start of minute wave i below 1,820.66. While this price point would provide final price invalidation of this bull wave count, it would be discarded before this point is passed when the aqua blue trend line is breached.
Hourly Wave Count
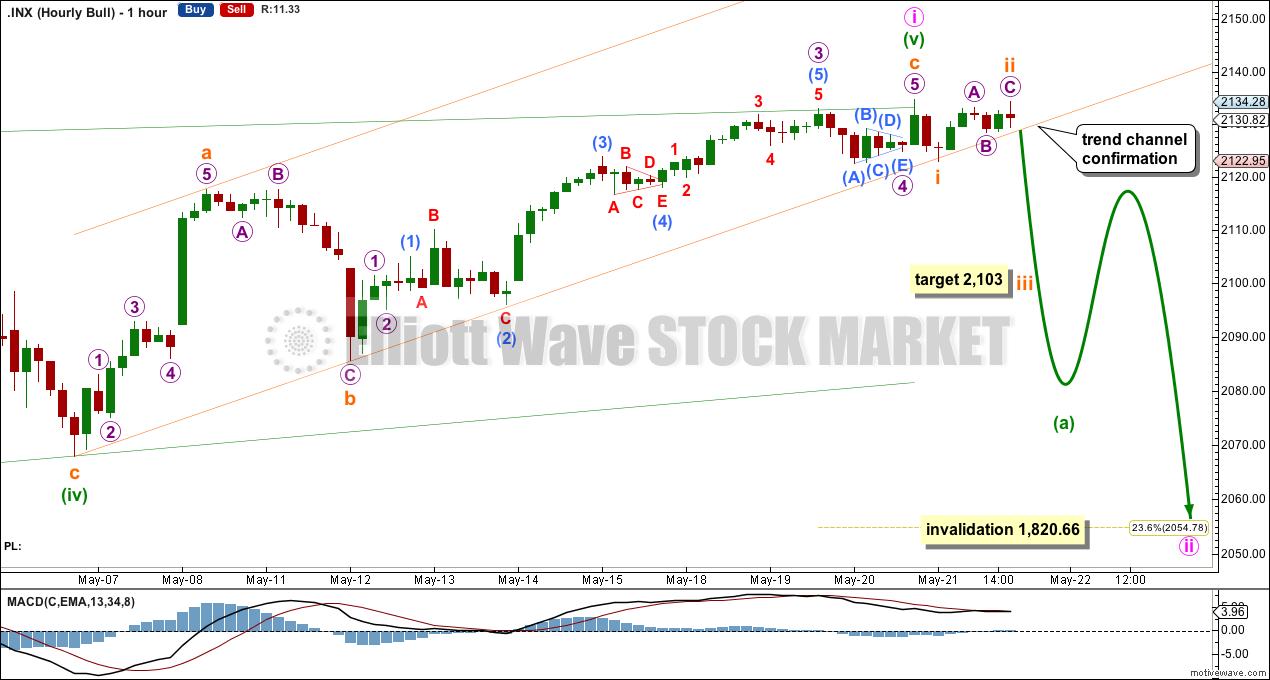
This wave count still requires confirmation. Confirmation would come with a clear breach of the channel containing the final zigzag of the diagonal. When the lower orange trend line is breached by at least one full hourly candlestick below it and not touching it then minuette wave (v) would be confirmed as over.
Subminuette wave c is now just 0.58 points short of equality in length with subminuette wave a.
Ratios within subminuette wave c are: micro wave 3 is 3.55 points short of 2.618 the length of micro wave 1, and micro wave 5 is just 0.01 longer than 0.618 the length of micro wave 1. There is perfect alternation between the 0.40 depth of the zigzag for micro wave 2, and the 0.21 depth triangle of micro wave 4.
Ratios within micro wave 3 are: submicro wave (3) is 1.70 points longer than 2.618 the length of submicro wave (1), and submicro wave (5) is 1.11 points short of 1.618 the length of submicro wave (1). There is good alternation between submicro wave (2) as a very deep 0.90 expanded flat, and submicro wave (4) as a very shallow 0.21 triangle.
The first small wave down labelled subminuette wave i fits perfectly as a small five wave impulse on the five minute chart. Subminuette wave ii may not move beyond the start of subminuette wave i above 2,134.72. At 2,103 subminuette wave iii would reach 2.618 the length of subminuette wave i.
Minute wave ii may end about the 0.236 Fibonacci ratio of minute wave i at 2,054.78, may last about two weeks, and must subdivide as a three wave structure most likely a zigzag. Despite this being a second wave correction following a leading diagonal (they are normally very deep), I would expect this one to be more shallow due to strong support provided by the long held bullish trend line on the daily chart.
Alternate Bull Wave Count
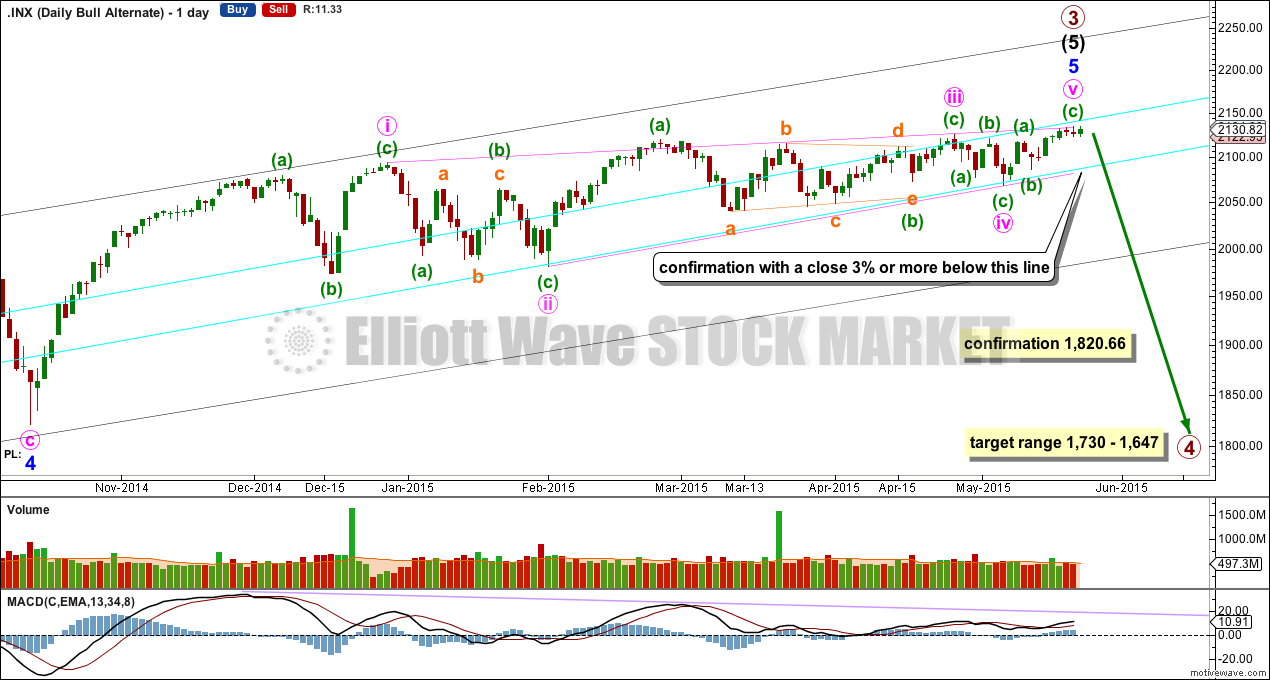
It is possible that the S&P has seen a primary degree (or for the bear count below a cycle degree) trend change yesterday. If not there, then another one or two days of a very little more upwards movement to overshoot the upper pink i-iii trend line would give this contracting diagonal a very typical look.
This alternate bull wave count simply moves the degree of labelling within the contracting diagonal all up one degree to see it as an ending diagonal for minor wave 5.
This wave count absolutely requires confirmation at the daily chart level before any confidence may be had in a primary (or cycle) degree trend change. Confirmation would come with:
1. A close of 3% or more of market value below the lower aqua blue trend line.
2. A clear five down on the daily chart.
3. A new low below 1,820.66.
As each condition is met the probability of a substantial trend change would increase.
Primary wave 4 would most likely be a time consuming flat, triangle or combination in order to exhibit structural alternation with the zigzag of primary wave 2. Primary wave 2 lasted 12 weeks. Primary wave 4 is likely to be longer in duration because combinations and triangles particularly are more time consuming than zigzags which tend to be quick corrections. Primary wave 4 may be expected to last more than 12 weeks, and may end with a total Fibonacci 13 or more likely 21 weeks.
Bear Wave Count
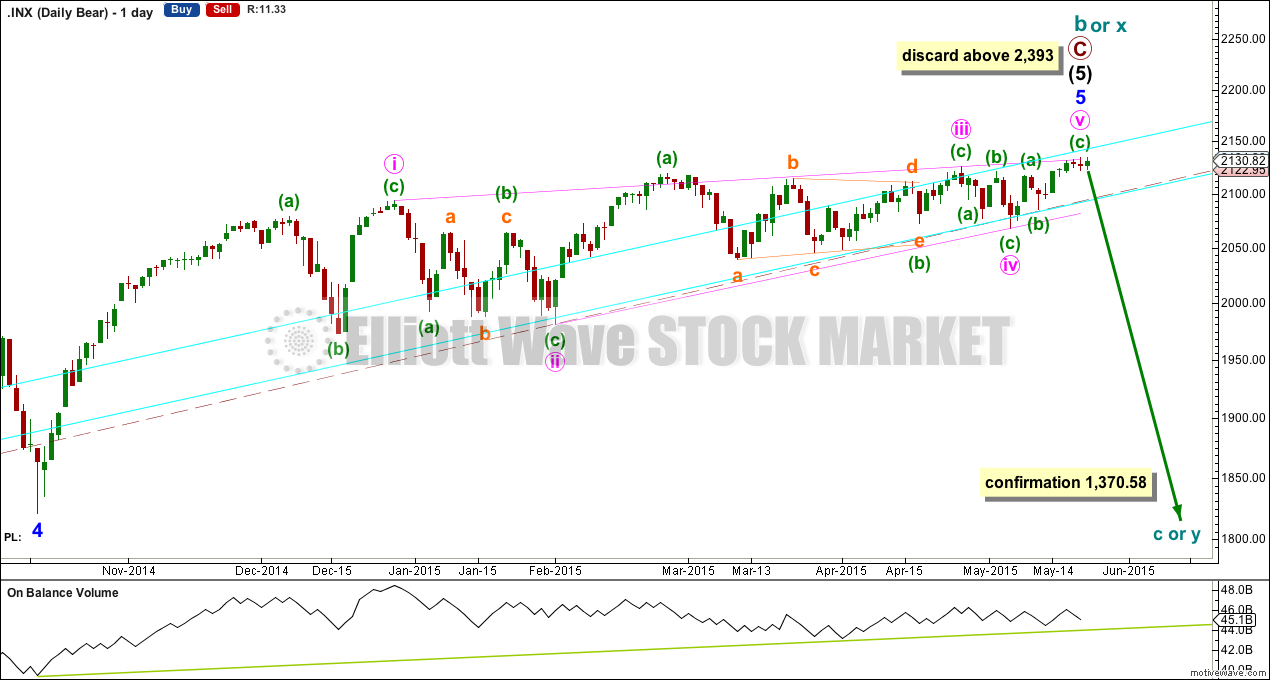
The subdivisions within primary waves A-B-C are seen in absolutely exactly the same way as primary waves 1-2-3 for the bull wave count.
To see the difference at the monthly chart level between the bull and bear ideas look at the last historical analysis here.
At cycle degree wave b is over the maximum common length of 138% the length of cycle wave a, at 170% the length of cycle wave a. At 2,393 cycle wave b would be twice the length of cycle wave a and at that point this bear wave count should be discarded.
While we have no confirmation of this wave count we should assume the trend remains the same, upwards. This wave count requires confirmation before I have confidence in it. Full and final confirmation that the market is crashing would only come with a new low below 1,370.58. However, structure and momentum should tell us long before that point which wave count is correct, bull or bear.
On Balance Volume should continue to find support at the trend lines drawn. When the longer held green trend line is broken by OBV a trend change would be supported.
Technical Analysis
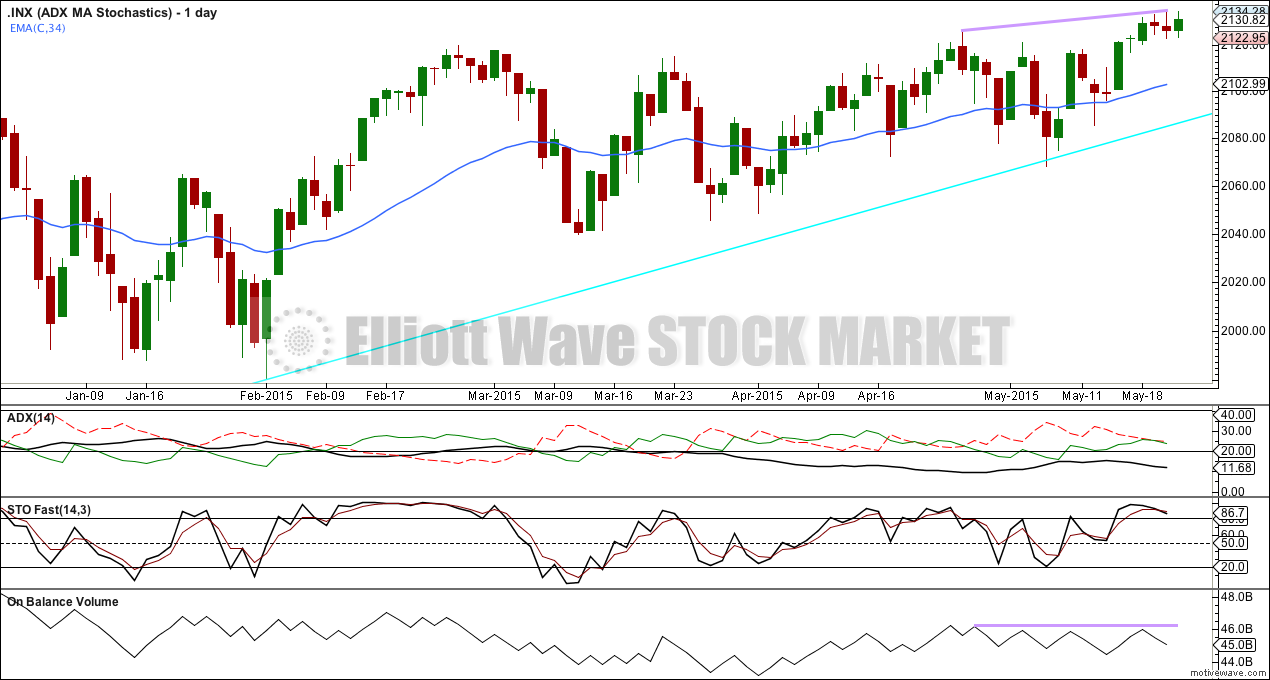
The regular technical analysis picture is the same as yesterday. ADX is trending lower and below 15 indicating no trend, sideways consolidation. The -DX (red dashed line) and +DX lines have come to touch. This indicates no direction, neither up nor down.
Stochastics may be turning down out of overbought territory.
On Balance Volume did not manage to confirm price at the new all time high three days ago.
Overall this TA supports the wave count if we are about to see a trend change of some degree. But while price remains above the 34 day EMA and above the long held bull market trend line, we must assume that the bull market remains intact, the trend remains up, and that we may be seeing only a small consolidation develop.
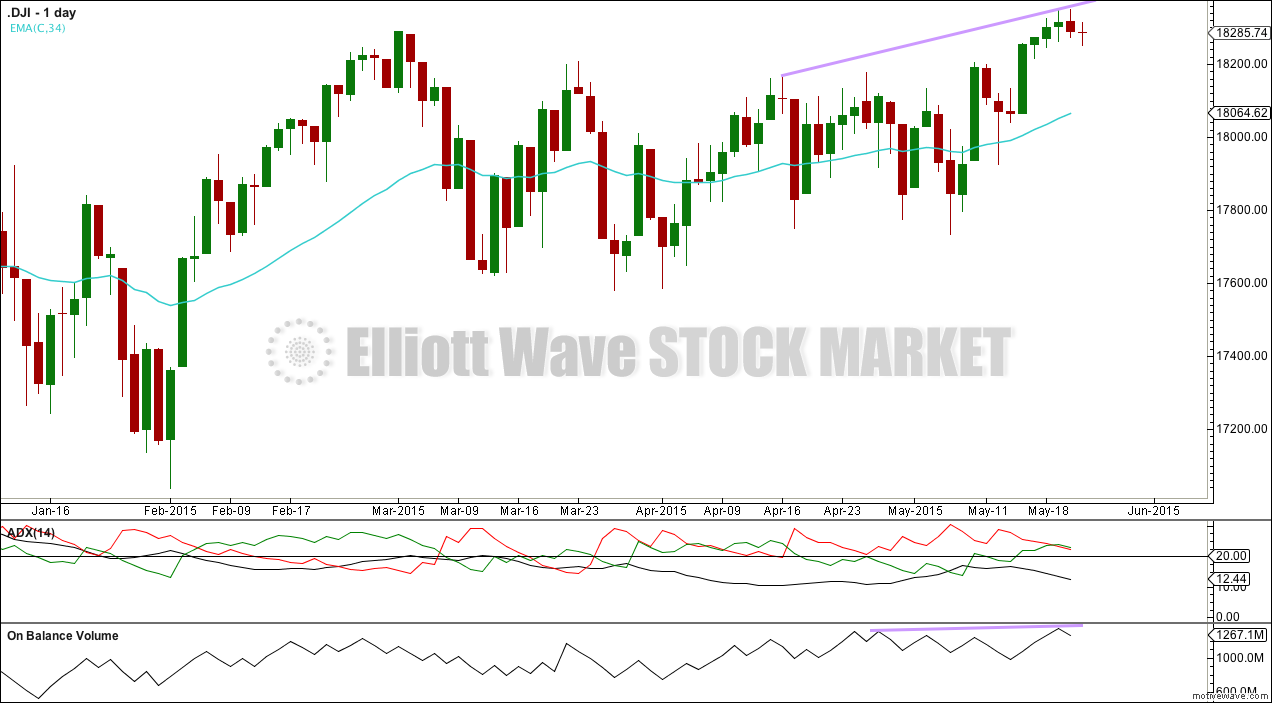
While the S&P500 made new highs the Dow confirmed.
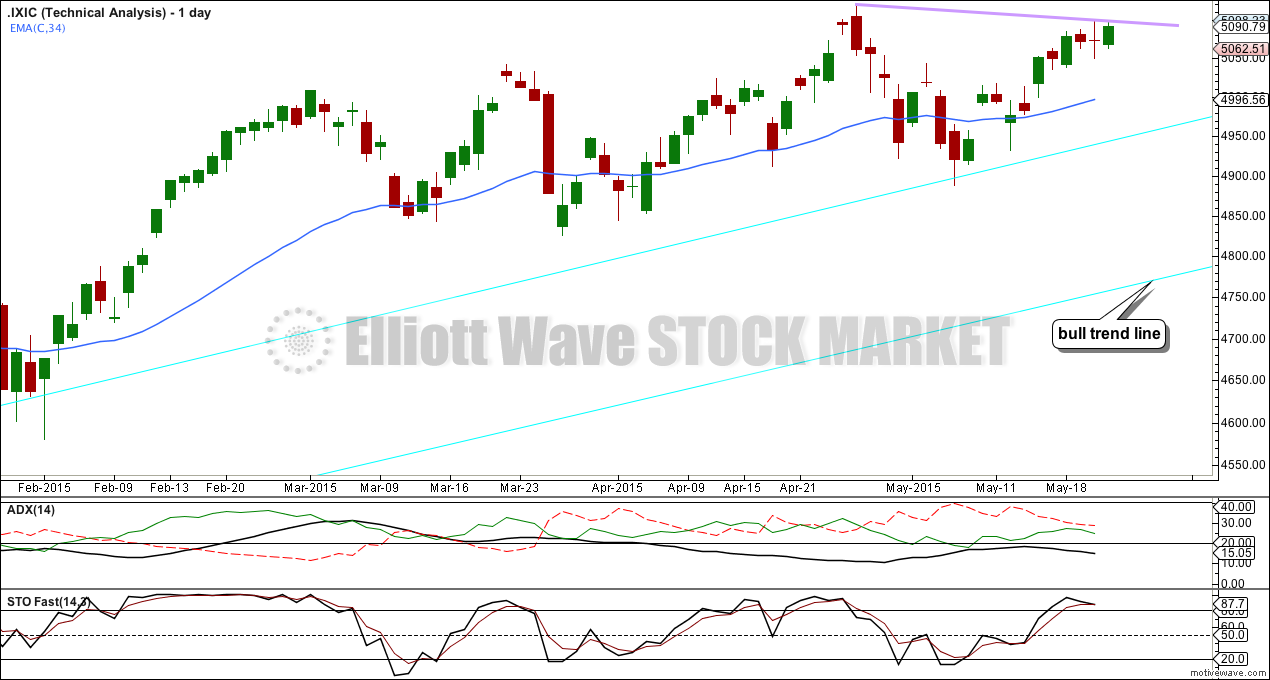
While the S&P500 and Dow have made new highs, importantly Nasdaq has failed to confirm.
Although we should assume the trend remains the same until proven otherwise, failure to confirm the upwards trend from Nasdaq indicates the potential here for a trend change.
I would rather use Nasdaq than Dow Transportation Index for confirmation because Nasdaq is more relevant than transportations to today’s markets. Ideally both would be used. Transports have also failed to make new highs recently.
This analysis is published about 08:15 p.m. EST.
Hi Lara,
My hourly chart looks very different from yours. this is the FXCM chart through Motive Wave
Hi Lara,
Just a small point but is there any chance that you can put back and forward arrows (which enable scrolling through charts) in the middle of your charts like EW Forex do? Many thanks.
Bottom left is “previous” and “next” to scroll through the charts.
But it also works if you click absolutely anywhere in the chart. It scrolls to the next one. I do this everyday for videos.