
Upwards movement for Monday is exactly what the Elliott wave count expected. The target remains the same.
Summary: Upwards movement may end this week. The target may now be calculated at two wave degrees giving a small range of 2,135 – 2,137. The upper i-iii trend line of the diagonal provided resistance during Monday. This resistance needs to be broken through for a final overshoot for the diagonal to have a typical look.
Click charts to enlarge.
To see a weekly chart and how to draw trend lines go here.
Bull Wave Count
The bull wave count sees primary 1-2-3 within an impulse for a cycle degree wave V.
The bear wave count sees primary A-B-C zigzag for a cycle degree B wave.
The subdivisions for this upwards movement for both bull and bear wave counts are 5-3-5. The wave counts don’t diverge and won’t for months yet.
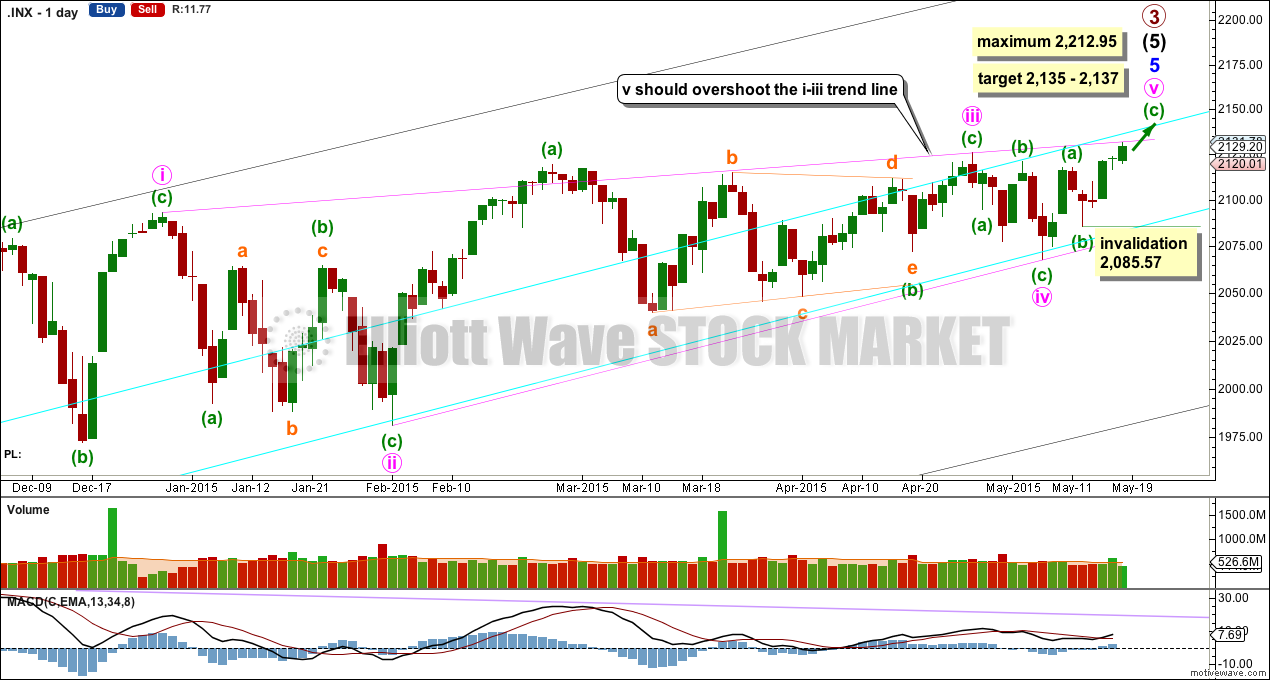
Minor wave 5 is an ending contracting diagonal, detailed on the daily chart below (the beginning is now off to the left of the chart, and can be seen on weekly charts).
All this choppy overlapping movement with declining momentum fits for a diagonal. An ending diagonal requires all sub waves to be zigzags, and the fourth wave must overlap back into first wave price territory. Elliott wave convention is to always draw the trend lines about a diagonal to indicate the structure is a diagonal.
The diagonal for minor wave 5 would be contracting: minute wave iii is shorter than minute wave i.
Minute wave iv is extremely likely to be over at the lower aqua blue trend line. If minute wave v begins here then it has a limit. It may not be longer than equality with minute wave iii at 2,212.95.
Within minuette wave (c), no second wave correction may move beyond the start of its first wave below 2,085.57.
Within impulses, the S&P often exhibits a Fibonacci ratio between two of its three actionary waves and rarely between all three. Within primary wave 3, there is already a close Fibonacci ratio between intermediate waves (1) and (3), and within intermediate wave (5) there is already a reasonable Fibonacci ratio between minor waves 3 and 1. It is unlikely that either minor wave 5 or intermediate wave (5) will exhibit a Fibonacci ratio. This means a target for primary wave 3 calculated at intermediate or minor degree would not have a good probability.
The target at 2,190 from the weekly chart looks to be too high. I would not expect such a large overshoot of the diagonal trend line.
Actionary waves within diagonals don’t normally exhibit Fibonacci ratios to each other. So the target cannot be reliably calculated at minute degree.
A better way to see where minute wave v is likely to end is the i-iii trend line. It is very common for the fifth wave of a contracting diagonal to overshoot the i-iii trend line. Only when this line is overshot would I consider and end to primary wave 3.
When the ending contracting diagonal is a complete structure, this wave count will become an alternate. I will have a main wave count which moves the diagonal all down one degree and sees it as a leading diagonal for minute wave i of minor wave 5. The invalidation point will then be at 1,820.66. If the lower aqua blue trend line is breached by a close of 3% or more of market value then and only then will the main wave count see a trend change at primary degree. We should always assume the trend remains the same until proven otherwise. While price remains above the aqua blue bull trend line it should be assumed that the S&P remains within a bull market.
Hourly Wave Count
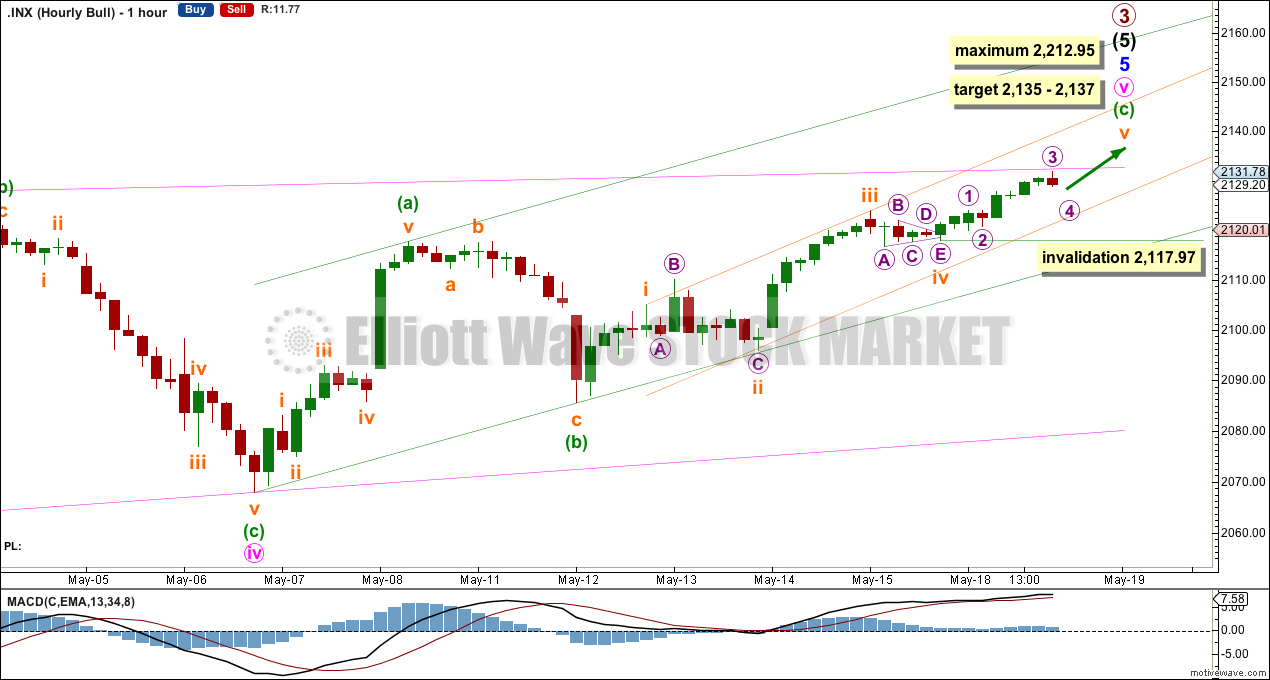
Minuette wave (c) is unfolding as an impulse. Within it, there is no Fibonacci ratio between subminuette waves iii or i so it is very likely that subminuette wave v will exhibit a Fibonacci ratio to either of subminuette waves i or iii. The most common ratio for subminuette wave v would be equality in length with subminuette wave i at 2,137.
At 2,135 minuette wave (c) would reach equality in length with minuette wave (a).
This target zone may be too low, not allowing enough of an overshoot for minute wave v.
Within subminuette wave v, no second wave correction may move beyond the start of its first wave below 2,117.97.
Draw the two channels about minute wave v and minuette wave (c) as shown. It looks like subminuette wave v may end midway within the narrow orange channel, and minuette wave (c) may end midway within the wider green channel.
After a little more upwards movement, the green channel will be used to provide the earliest indication of a trend change. When downwards movement breaches the lower edge of that channel, it will provide trend channel confirmation that minute wave v is over.
Bear Wave Count
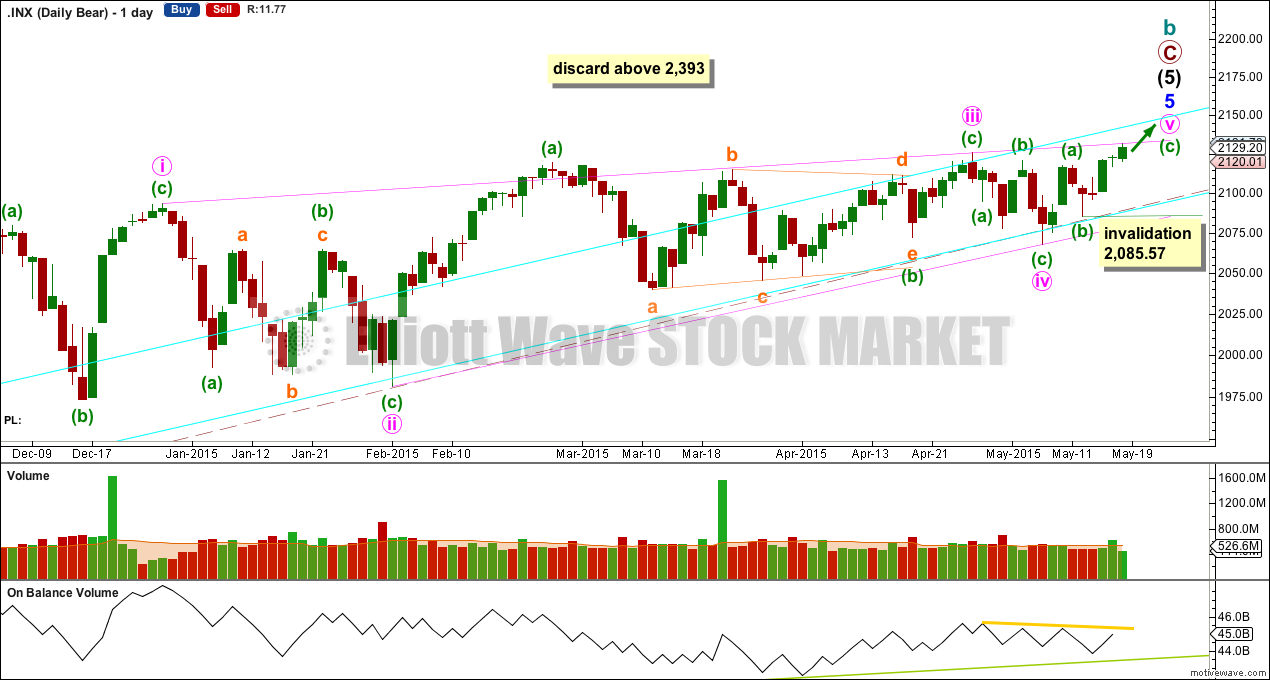
The subdivisions within primary waves A-B-C are seen in absolutely exactly the same way as primary waves 1-2-3 for the bull wave count.
To see the difference at the monthly chart level between the bull and bear ideas look at the last historical analysis here.
At cycle degree wave b is over the maximum common length of 138% the length of cycle wave a, at 167% the length of cycle wave a. At 2,393 cycle wave b would be twice the length of cycle wave a and at that point this bear wave count should be discarded.
While we have no confirmation of this wave count we should assume the trend remains the same, upwards. This wave count requires confirmation before I have confidence in it. Full and final confirmation that the market is crashing would only come with a new low below 1,370.58. However, structure and momentum should tell us long before that point which wave count is correct, bull or bear.
On Balance Volume should continue to find support at the trend lines drawn. When the longer held green trend line is broken by OBV a trend change would be supported.
Technical Analysis
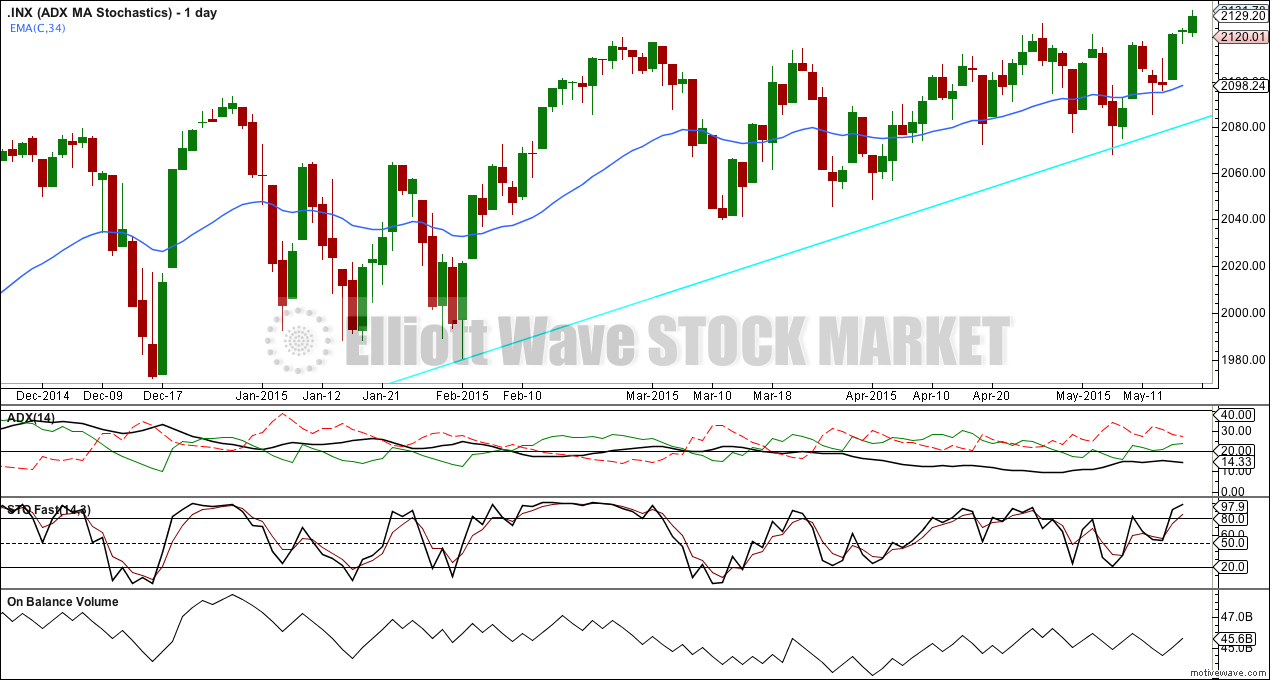
ADX remains flat and below 15 indicating low volatility, very short swings and no trend. ADX indicates downwards direction is stronger than upwards, but price is above the 34 day EMA. The situation is unclear.
Volume for Monday is slightly lower for an up day (volume is shown on the daily bull chart) but Friday’s volume being higher still supports an up trend.
On balance, with price above both the 34 day EMA and the long held bull trend line, it can be assumed that it is most likely the trend at this stage is up.
I will look for the final day of this upwards movement to exhibit a volume spike. If that happens, it would support an end to this contracting diagonal structure.
This analysis is published about 07:05 p.m. EST.
Hi Lara: I thought your observation of failure swings in the RSI signaling previous market tops was quite insightful. Are you still looking at that indicator?