
Upwards movement was expected from yesterday’s Elliott wave analysis. This is exactly what happened.
Summary: The wave count expects upwards movement to continue for at least another week. Only when the i-iii trend line of the diagonal is overshot would the wave count expect a trend change.
Click charts to enlarge.
Bull Wave Count
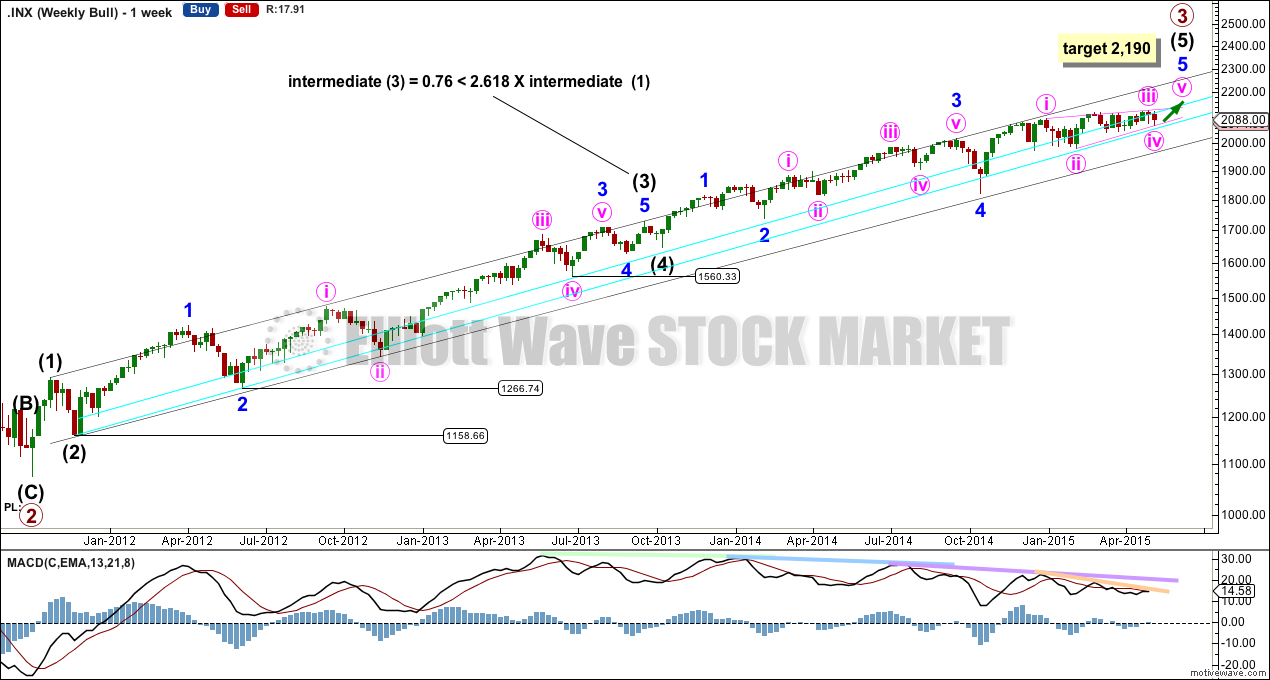
The bull wave count sees primary 1-2-3 within an impulse for a cycle degree wave V.
The bear wave count sees primary A-B-C zigzag for a cycle degree B wave.
The subdivisions for this upwards movement for both bull and bear wave counts are 5-3-5. The wave counts don’t diverge and won’t for months yet.
Within primary wave 3 the impulse is close to an end. At 2,190 primary wave 3 would reach 1.618 the length of primary wave 1. If this target is wrong it may be too high by about 20 points or so. A better way to see where upwards movement may end is the upper i-iii pink diagonal trend line, best viewed on the daily chart.
Within primary wave 3 intermediate wave (3) is extended and shows strongest upward momentum at the weekly chart level. It is just 0.76 short of 2.618 the length of intermediate wave (1). All subdivisions fit perfectly.
Within intermediate wave (5) minor wave 3 is extended, and is 11 points longer than 1.618 the length of minor wave 1. All subdivisions fit perfectly.
Minor wave 5 is an ending contracting diagonal, detailed on the daily chart below.
Draw a channel about primary wave 3 using Elliott’s technique: draw the first trend line from the ends of intermediate waves (1) to (3), then place a parallel copy on the end of intermediate wave (2). The upper edge of this black channel may provide resistance to upwards movement, if price reaches it then intermediate wave (5) may end there.
Draw a double trend line as shown (aqua blue lines). While price remains above the lower aqua blue trend line the S&P500 will remain in a bull market. Only when that lower aqua blue line is breached by a close of 3% or more of market value will a bear market be indicated.
There is quadruple negative divergence between price and MACD. This indicates a correction may arrive soon.
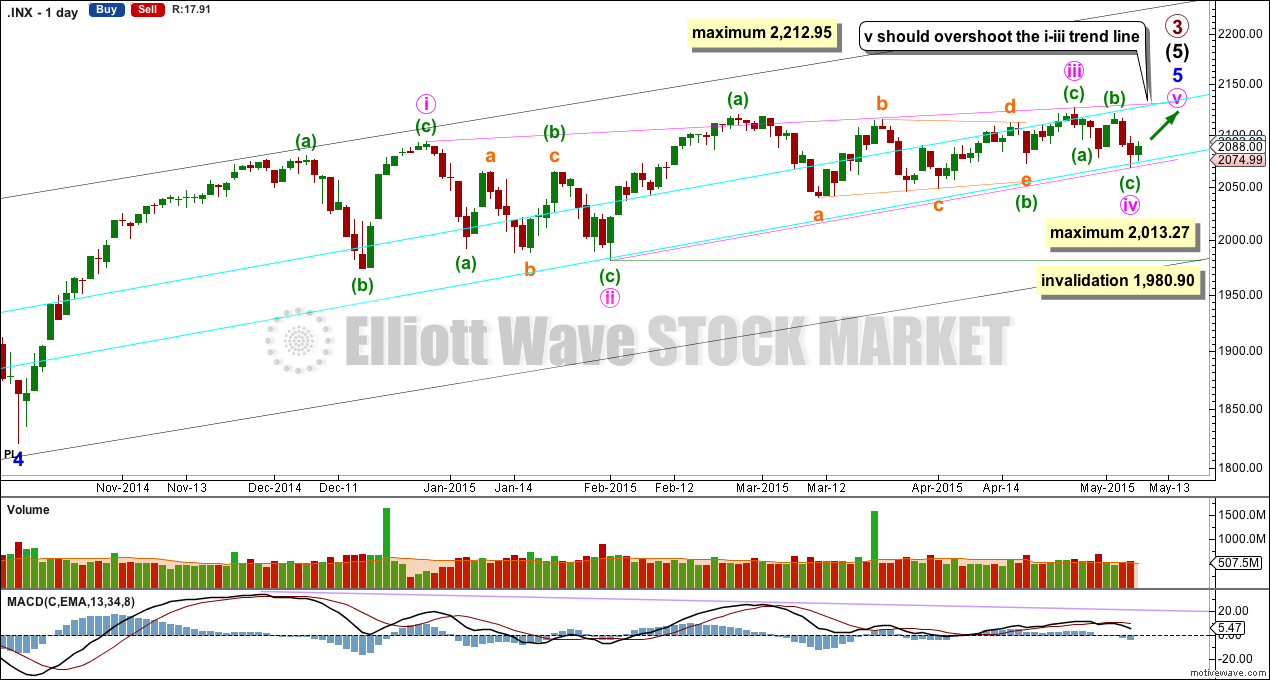
Both bull and bear wave counts see minor wave 5 as an ending contracting diagonal.
Minor wave 5 begins here as labelled. All this choppy overlapping movement with declining momentum fits for a diagonal. An ending diagonal requires all sub waves to be zigzags, and the fourth wave must overlap back into first wave price territory. Elliott wave convention is to always draw the trend lines about a diagonal to indicate the structure is a diagonal.
The diagonal for minor wave 5 would be contracting: minute wave iii is shorter than minute wave i. Minute wave iv must be shorter than minute wave ii, the maximum length for minute wave iv is equality in length with minute wave ii at 2,013.27. The rule for the end of a fourth wave within a diagonal is it must overlap back into minute wave i price territory below 2,093.55 and it may not move beyond the end of minute wave ii below 1,980.90.
Minute wave iv is extremely likely to be over at the lower aqua blue trend line.
If minute wave v begins here then it too has a limit. It may not be longer than equality with minute wave iii at 2,212.95.
Within impulses the S&P often exhibits a Fibonacci ratio between two of its three actionary waves, and rarely between all three. Within primary wave 3 there is already a close Fibonacci ratio between intermediate waves (1) and (3), and within intermediate wave (5) there is already a reasonable Fibonacci ratio between minor waves 3 and 1. It is unlikely that either minor wave 5 or intermediate wave (5) will exhibit a Fibonacci ratio. This means a target for primary wave 3 calculated at intermediate or minor degree would not have a good probability.
The target at 2,190 from the weekly chart looks to be too high. I would not expect such a large overshoot of the diagonal trend line.
Actionary waves within diagonals don’t normally exhibit Fibonacci ratios to each other. So the target cannot be reliably calculated at minute degree.
Only when minuette waves (a) and (b) within minute wave v are complete can minuette wave degree be used to calculate a target.
A better way to see where minute wave v is likely to end is the i-iii trend line. It is very common for the fifth wave of a contracting diagonal to overshoot the i-iii trend line. Only when this line is overshot would I consider and end to primary wave 3.
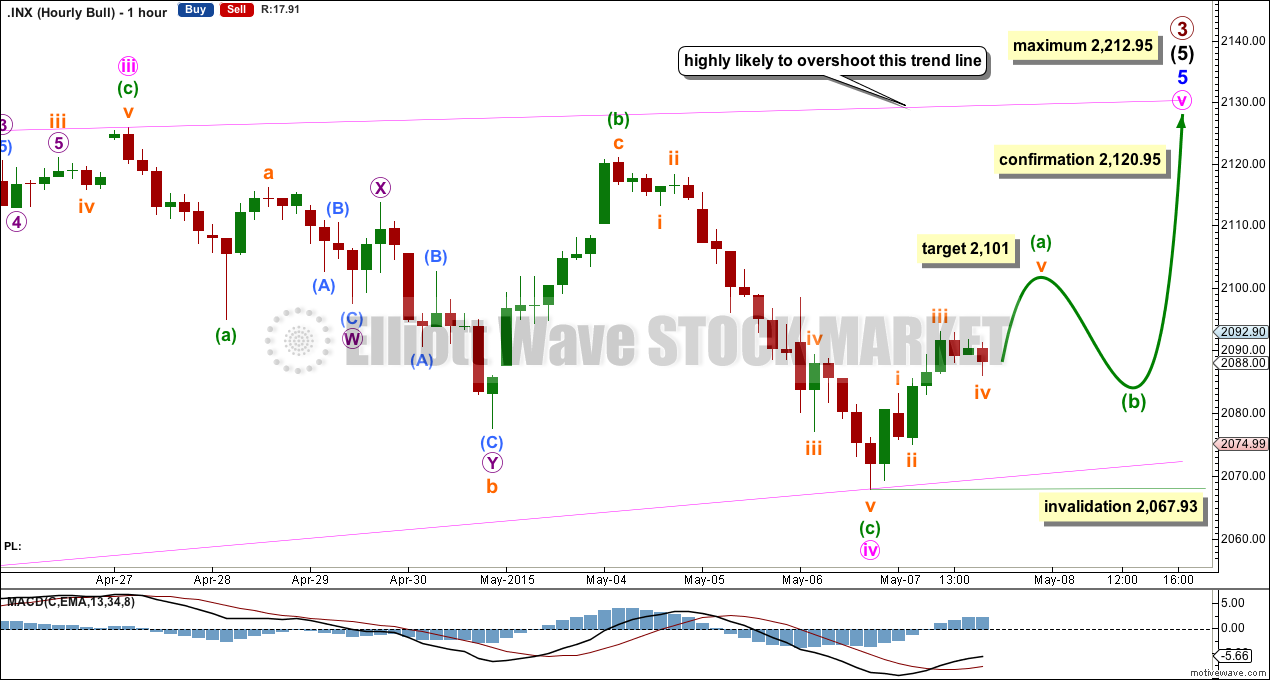
Minute wave v must subdivide as a zigzag. Within it minuette wave (a) may be close to completion. At 2,101 subminuette wave v would reach equality in length with subminuett wave i.
When minuette wave (a) is a complete impulse then some downwards movement would be expected for minuette wave (b) which may not move beyond the start of minuette wave (a) below 2,067.93. Minuette wave (b) should show up on the daily chart as one to three red candlesticks or doji. This would give the zigzag for minute wave v a three wave look at the daily chart level.
Minuette wave (b) would be extremely likely to find support at the lower ii-iv diagonal trend line (pink sloping line) if it gets down that low.
Overall this wave count expects upwards movement, with a correction against the trend in the middle of it to last one to three days.
Only when the upper pink i-iii trend line is overshot would I consider an end to primary wave 3.
Bear Wave Count
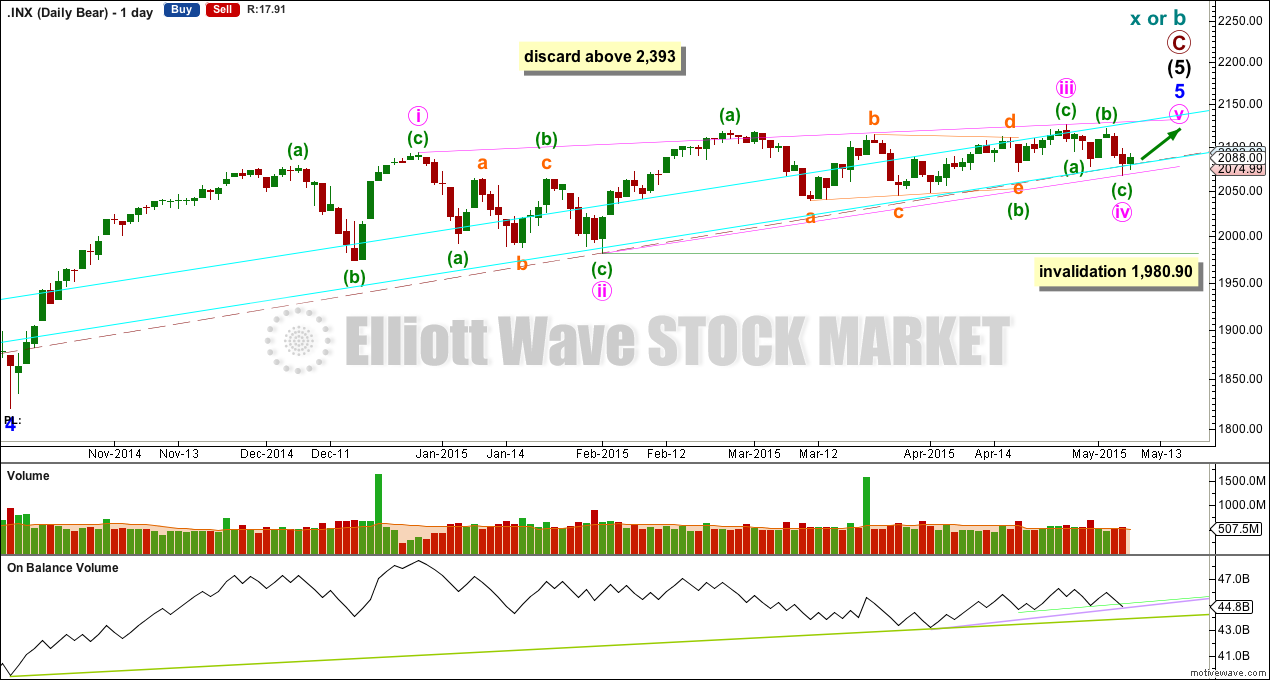
The subdivisions within primary waves A-B-C are seen in absolutely exactly the same way as primary waves 1-2-3 for the bull wave count.
To see the difference at the monthly chart level between the bull and bear ideas look at the last historical analysis here.
At cycle degree wave b is over the maximum common length of 138% the length of cycle wave a, at 167% the length of cycle wave a. At 2,393 cycle wave b would be twice the length of cycle wave a and at that point this bear wave count should be discarded.
While we have no confirmation of this wave count we should assume the trend remains the same, upwards. This wave count requires confirmation before I have confidence in it. Full and final confirmation that the market is crashing would only come with a new low below 1,370.58. However, structure and momentum should tell us long before that point which wave count is correct, bull or bear.
On Balance Volume should continue to find support at the trend lines drawn. When the longer held green trend line is broken by OBV a trend change would be supported.
This analysis is published about 06:17 p.m. EST.