
Downwards movement continued, as expected, reaching 3.07 points below the target which was at 2,071.
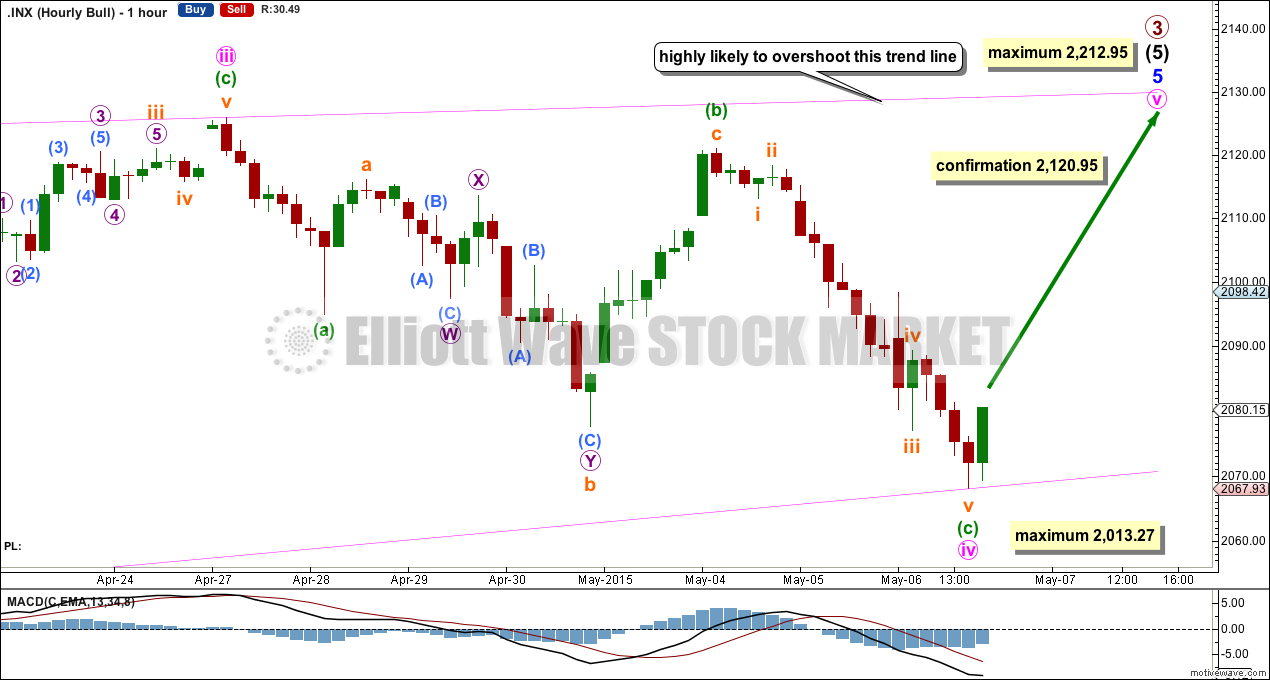
Summary: The wave count now expects upwards movement to be extremely likely to move above 2,125.92 to avoid a truncation. Upwards movement is highly likely to only end when the i-iii trend line of the diagonal is overshot.
To see a weekly chart showing how to draw trend lines and the structure of primary wave 3 go here.
Click charts to enlarge.
Bull Wave Count

Both bull and bear wave counts see minor wave 5 as an ending contracting diagonal.
Minor wave 5 begins here as labelled. All this choppy overlapping movement with declining momentum fits for a diagonal. An ending diagonal requires all sub waves to be zigzags, and the fourth wave must overlap back into first wave price territory. Elliott wave convention is to always draw the trend lines about a diagonal to indicate the structure is a diagonal.
The diagonal for minor wave 5 would be contracting: minute wave iii is shorter than minute wave i. Minute wave iv must be shorter than minute wave ii, the maximum length for minute wave iv is equality in length with minute wave ii at 2,013.27. The rule for the end of a fourth wave within a diagonal is it must overlap back into minute wave i price territory below 2,093.55 and it may not move beyond the end of minute wave ii below 1,980.90.
Minute wave iv is extremely likely to now be over as it has touched the lower aqua blue trend line.
If minute wave v begins here then it too has a limit. It may not be longer than equality with minute wave iii at 2,212.95.
Within impulses the S&P often exhibits a Fibonacci ratio between two of its three actionary waves, and rarely between all three. Within primary wave 3 there is already a close Fibonacci ratio between intermediate waves (1) and (3), and within intermediate wave (5) there is already a reasonable Fibonacci ratio between minor waves 3 and 1. It is unlikely that either minor wave 5 or intermediate wave (5) will exhibit a Fibonacci ratio. This means a target for primary wave 3 calculated at intermediate or minor degree would not have a good probability.
Actionary waves within diagonals don’t normally exhibit Fibonacci ratios to each other. So the target cannot be reliably calculated at minute degree.
Only when minuette waves (a) and (b) within minute wave v are complete can minuette wave degree be used to calculate a target.
A better way to see where minute wave v is likely to end is the i-iii trend line. It is very common for the fifth wave of a contracting diagonal to overshoot the i-iii trend line. Only when this line is overshot would I consider and end to primary wave 3.
The alternate hourly wave count was invalidated leaving only this main wave count.
Minute wave iv is very likely to be over. Minuette wave (c) is 2.81 points longer than 1.618 the length of minuette wave (a).
A new high above 2,120.95 would eliminate the possibility that minuette wave (c) could continue lower. At that point I would have full confidence that the S&P should continue upwards to new highs, to overshoot the i-iii trend line.
While price remains below 2,120.95 the possibility of a little more downwards movement will remain. Minute wave iv should not move below 2,013.27.
Bear Wave Count
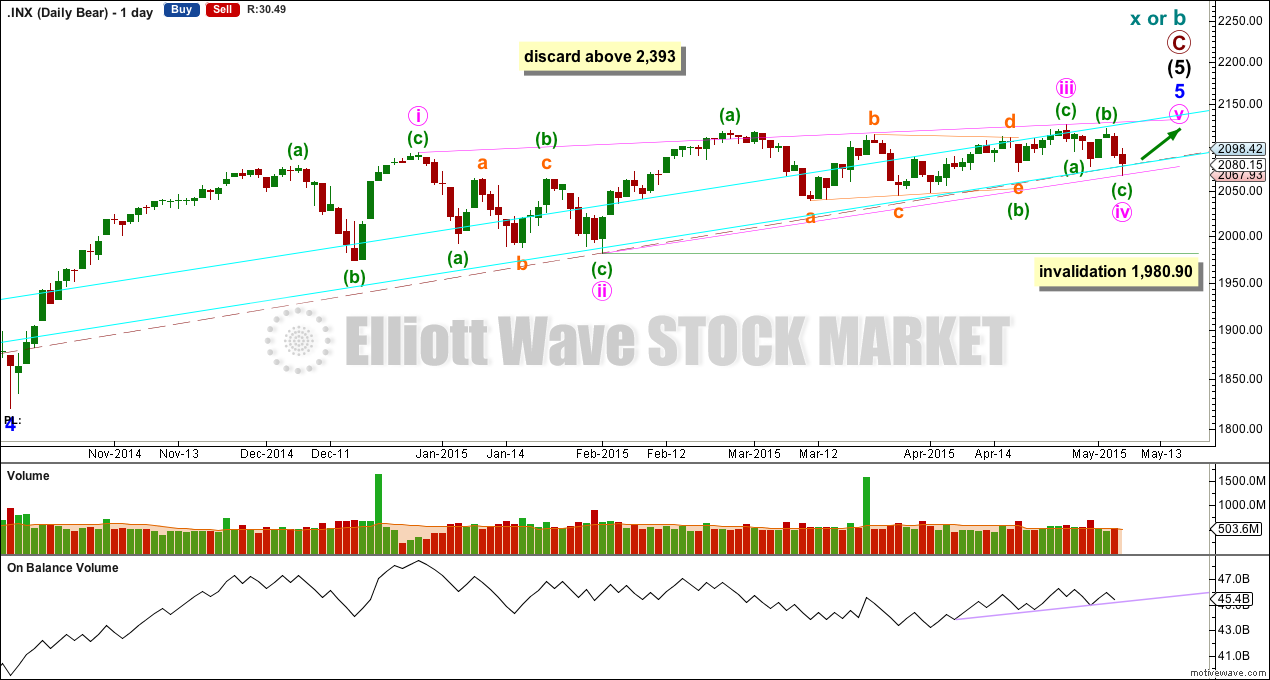
The subdivisions within primary waves A-B-C are seen in absolutely exactly the same way as primary waves 1-2-3 for the bull wave count. The alternate bull wave count idea also works perfectly for this bear wave count.
To see the difference at the monthly chart level between the bull and bear ideas look at the last historical analysis here.
At cycle degree wave b is over the maximum common length of 138% the length of cycle wave a, at 167% the length of cycle wave a. At 2,393 cycle wave b would be twice the length of cycle wave a and at that point this bear wave count should be discarded.
While we have no confirmation of this wave count we should assume the trend remains the same, upwards. This wave count requires confirmation before I have confidence in it. Full and final confirmation that the market is crashing would only come with a new low below 1,370.58. However, structure and momentum should tell us long before that point which wave count is correct, bull or bear.
On Balance Volume has a small trend line providing support over the month on the daily chart. OBV may continue to find support at this trend line, where the final upwards wave may bounce up from.
This analysis is published about 07:07 p.m. EST.