
The hourly chart expected some upwards movement for another second wave correction in the short term. This unfolded on Monday.
Summary: The mid term target remains at 2,000 and may be met in another five or ten sessions if minuette wave (iii) totals a Fibonacci eight or thirteen days.
Click charts to enlarge.
Bullish Wave Count
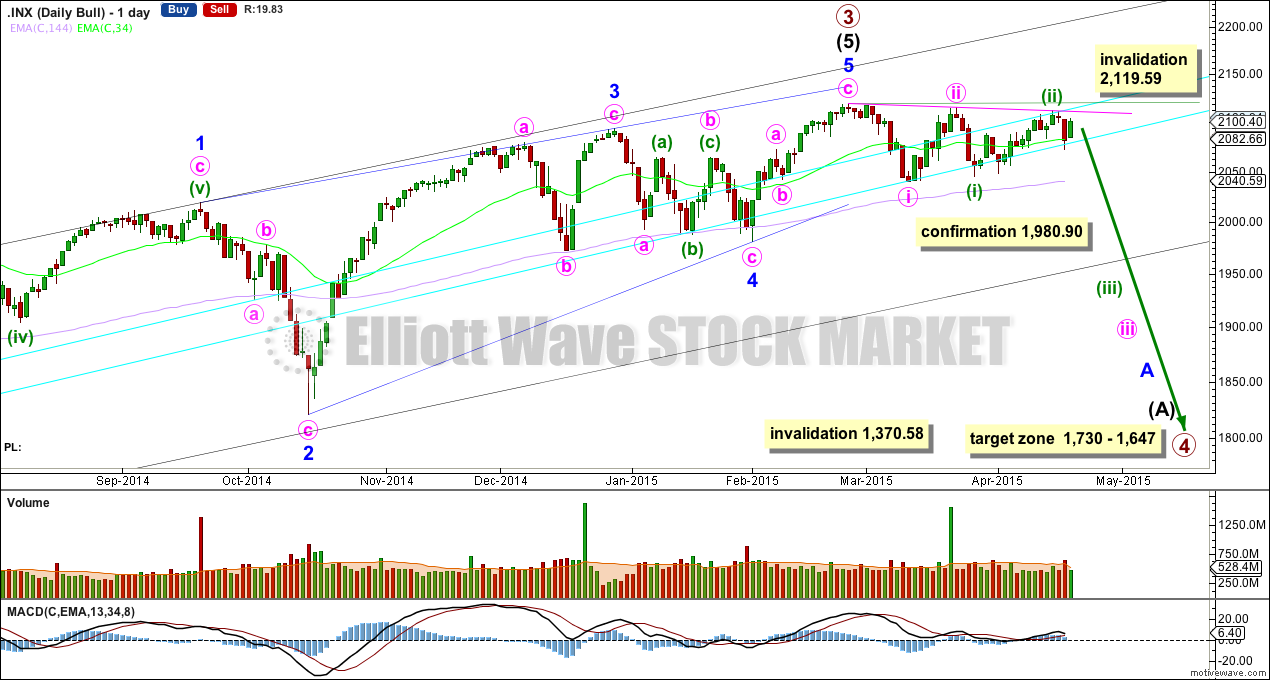
If primary wave 3 is over then primary wave 4 should begin. Upwards movement from the low at 666.79 subdivides now as a complete 5-3-5. For the bull wave count this is seen as primary waves 1-2-3. The wave count sees intermediate wave (5) as an ending contracting diagonal. Ending diagonals require all sub waves to be zigzags.
Primary wave 2 was a relatively shallow 0.41 zigzag lasting 12 weeks. Primary wave 4 may be more shallow and is most likely to be a flat, combination or triangle. It may be longer lasting than primary wave 2 as these types of sideways corrective structures tend to be more time consuming than zigzags. Primary wave 4 is likely to end in the price territory of the fourth wave of one lesser degree between 1,730 – 1,647. It may last about 13 or more likely 21 weeks. So far it is in its seventh week.
To see a weekly chart and how to draw the aqua blue trend lines and the black channel, go here. Primary wave 4 should break below the black channel.
Primary wave 4 may not move into primary wave 1 price territory below 1,370.58. Invalidation of this bull wave count would provide full confidence in the bear wave count.
Because primary wave 4 may be an expanded flat, running triangle or double combination it may include a new high beyond its start at 2,119.59. If this happens the bear wave count would be invalidated. Before that becomes a possibility though, primary wave 4 should begin with a clear five down on the daily chart.
There is triple (quadruple?) divergence with price and MACD at the weekly chart level supporting the idea of a trend change, either already or coming up soon.
A close 3% or more of market value below the double aqua blue trend line would provide trend line confirmation of a sizeable trend change. I will only have confidence in this wave count when there is confirmation of this trend change. When this trend line is again breached I will calculate where the close needs to be.
A new low below 1,980.90 would provide further confirmation of a trend change. At that stage I will use DJIA and NASDAQ to apply Dow theory to confirm a substantial trend change.
The last substantial downward movement for the S&P was primary wave 2 back in June to October, 2011. During this primary degree wave down the 34 day SMA was below the longer 144 day SMA, and price was below both. Once primary wave 3 got underway the 34 day SMA moved above the 144 day SMA and has remained above since December 2011. A cross again of these two moving averages would provide strong confidence in a substantial trend change. I have chosen to use these two ranges because they’re Fibonacci numbers, and these two in conjunction worked so nicely for primary wave 2.
So far within the sideways movement the strongest volume is still down days. This indicates that when the breakout comes from this sideways consolidation phase it is more likely to be down than up. Friday’s session shows an increase in volume for another down day, indicating the breakout may have just begun. Lower volume for the up day of Monday supports the wave count.
A trend line drawn from the start of minute wave i at 2,119.59 to the end of minute wave ii and extended out still perfectly shows where minuette wave (ii) has ended. This pink trend line may continue to provide resistance to corrections along the way down. Minuette wave (ii) totals a Fibonacci thirteen days.
Minuette wave (iii) may total a Fibonacci eight or thirteen days. So far it has lasted only three days.
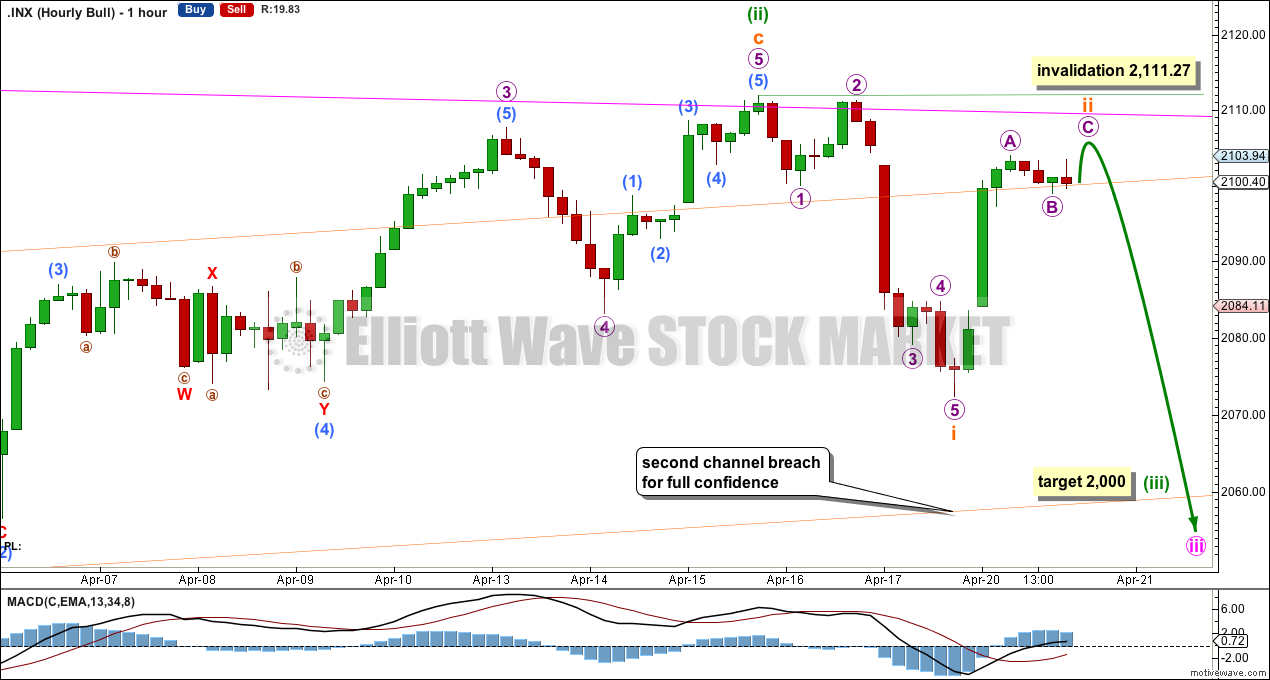
Another deep second wave correction is close to completion. I would expect tomorrow to open with a little upwards movement to find resistance again at the pink trend line (if it gets that high) before a continuation of the downwards movement seen for Friday.
Subminuette wave ii may not move beyond the start of subminuette wave i above 2,111.27.
The next wave down for the S&P is very likely to be the one to provide us with some confirmation of a big trend change. It should show a strong increase in downwards momentum, and down days should show an increase in volume.
At 2,000 minuette wave (iii) would reach 1.618 the length of minuette wave (i).
Alternate Bullish Wave Count
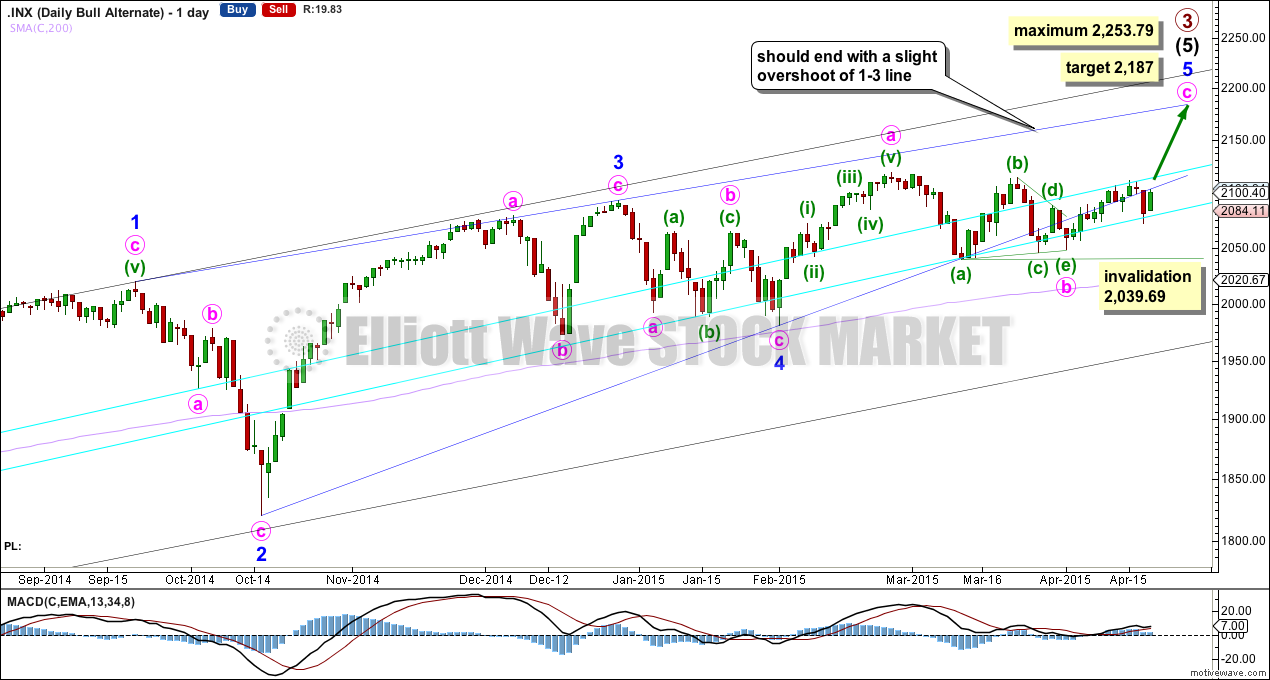
This alternate wave count is identical to the main wave count up to the low labelled minor wave 4. Thereafter, it sees minor wave 5 incomplete.
The lower 2-4 trend line of the contracting diagonal is now breached by three full daily candlesticks below it and not touching it. Diagonals normally adhere very well to their trend lines and this part of the wave count now looks wrong. The strong downwards candlestick for Friday further reduces the probability of this alternate, and it now looks quite ridiculous. I will keep publishing it though as a possible bullish alternate only because we just don’t have confirmation of a primary or cycle degree trend change yet.
This wave count is still technically possible but it has a very low probability. The breach of the 2-4 trend line is the only reason why this wave count is an alternate.
Within the triangle of minute wave b, if minuette wave (c) continues further it may not move beyond the end of minuette wave (a) below 2,039.69. If we see a new low below this point this week I will discard this alternate wave count.
It is at this stage that this alternate wave count diverges from the main wave count. A new high above 2,114.86 (the high of minute wave ii, bullish wave count) would increase the probability of this alternate.
Bear Wave Count
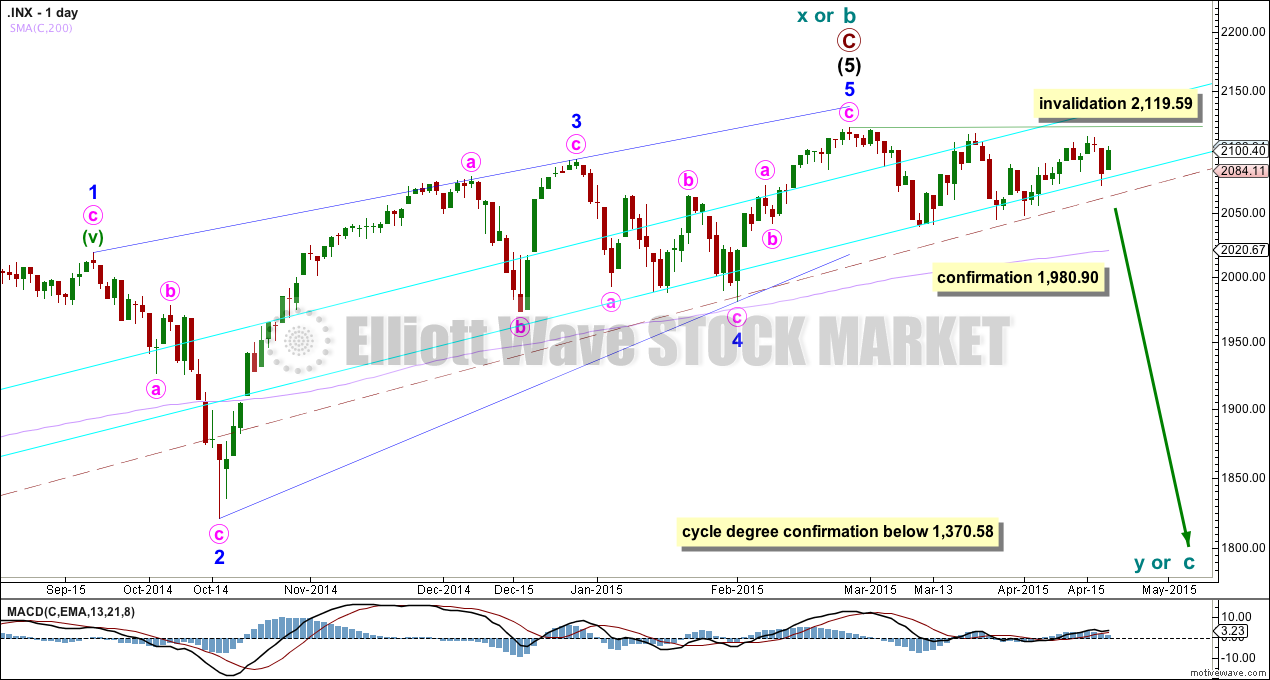
The subdivisions within primary waves A-B-C are seen in absolutely exactly the same way as primary waves 1-2-3 for the bull wave count. The alternate bull wave count idea also works perfectly for this bear wave count.
To see the difference at the monthly chart level between the bull and bear ideas look at the last historical analysis here.
At cycle degree wave b is over the maximum common length of 138% the length of cycle wave a, at 167% the length of cycle wave a. At 2,393 cycle wave b would be twice the length of cycle wave a and at that point this bear wave count should be discarded.
While we have no confirmation of this wave count we should assume the trend remains the same, upwards. This wave count requires confirmation before I have confidence in it. Full and final confirmation that the market is crashing would only come with a new low below 1,370.58. However, structure and momentum should tell us long before that point which wave count is correct, bull or bear.
This analysis is published about 08:29 p.m. EST.
I like to look at the UVXY which is a derivative of the VIX (reflects not only current put call ratio but also a kind of VIX futures) UVXY has been making a series of 52 week lows and made another today.
It certainly has. However, this looks like a short term trading ETF which, it is important to note, may exhibit decay independent of the underlying item
The almost complete absence of fear in this market is absolutely mind-blowing! Particularly when you consider the most likely wave count. In a strange kind of way I guess it could be confirmatory of at least a temporary summit on the long run up. Boy these thirds waves sure have a way of taking their own sweet time to get going don’t they… waiting for a few more victims to “buy the dip?!! 😀
If we have a high in place then the market should be euphoric, with a very very high % of bulls.
That’s the contrary opinion, which is an EW opinion.
What indicators are you looking at the determine the level of fear?
Normally one looks at the VIX, which is at a fairly low level at the moment