
Downwards movement was expected and showed up at the end of the week, with an increase in volume which was also expected.
Summary: The small channel on the hourly chart is breached, and a new low below 2,083.24 adds confidence to the idea that the S&P has begun a downwards breakout. The target is at 2,000 to be reached in maybe in six or eleven more days, if minuette wave (iii) totals a Fibonacci eight or thirteen sessions. A close at 2,013 or below would provide strong confirmation of a substantial trend change for the S&P.
Click charts to enlarge.
Bullish Wave Count
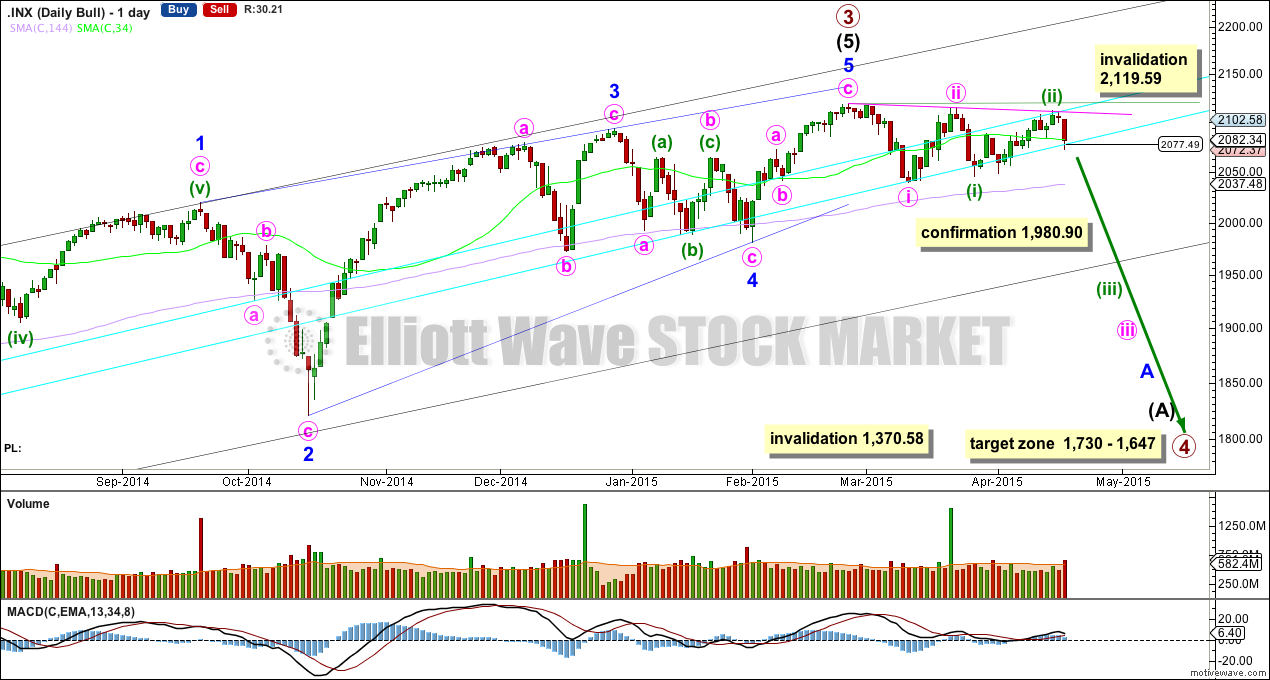
If primary wave 3 is over then primary wave 4 should begin. Upwards movement from the low at 666.79 subdivides now as a complete 5-3-5. For the bull wave count this is seen as primary waves 1-2-3. The wave count sees intermediate wave (5) as an ending contracting diagonal. Ending diagonals require all sub waves to be zigzags.
Primary wave 2 was a relatively shallow 0.41 zigzag lasting 12 weeks. Primary wave 4 may be more shallow and is most likely to be a flat, combination or triangle. It may be longer lasting than primary wave 2 as these types of sideways corrective structures tend to be more time consuming than zigzags. Primary wave 4 is likely to end in the price territory of the fourth wave of one lesser degree between 1,730 – 1,647. It may last about 13 or more likely 21 weeks. So far it is in its seventh week.
To see a weekly chart and how to draw the aqua blue trend lines and the black channel, go here. Primary wave 4 should break below the black channel.
Primary wave 4 may not move into primary wave 1 price territory below 1,370.58. Invalidation of this bull wave count would provide full confidence in the bear wave count.
Because primary wave 4 may be an expanded flat, running triangle or double combination it may include a new high beyond its start at 2,119.59. If this happens the bear wave count would be invalidated. Before that becomes a possibility though, primary wave 4 should begin with a clear five down on the daily chart.
There is triple (quadruple?) divergence with price and MACD at the weekly chart level supporting the idea of a trend change, either already or coming up soon.
A close 3% or more of market value below the double aqua blue trend line would provide trend line confirmation of a sizeable trend change. I will only have confidence in this wave count when there is confirmation of this trend change. At this stage if price breaks through the trend line at 2,077.49 then it needs to close at 2,014 or below to have confidence in a substantial trend change.
A new low below 1,980.90 would provide further confirmation of a trend change. At that stage I will use DJIA and NASDAQ to apply Dow theory to confirm a substantial trend change.
The last substantial downward movement for the S&P was primary wave 2 back in June to October, 2011. During this primary degree wave down the 34 day SMA was below the longer 144 day SMA, and price was below both. Once primary wave 3 got underway the 34 day SMA moved above the 144 day SMA and has remained above since December 2011. A cross again of these two moving averages would provide strong confidence in a substantial trend change. I have chosen to use these two ranges because they’re Fibonacci numbers, and these two in conjunction worked so nicely for primary wave 2.
So far within the sideways movement of minuette wave (ii) the strongest volume was on a down day. This indicates that when the breakout comes from this sideways consolidation phase it is more likely to be down than up. Friday’s session shows an increase in volume for another down day, indicating the breakout may have just begun.
A trend line drawn from the start of minute wave i at 2,119.59 to the end of minute wave ii and extended out still perfectly shows where minuette wave (ii) has ended. This pink trend line may continue to provide resistance to corrections along the way down. Minuette wave (ii) totals a Fibonacci thirteen days.
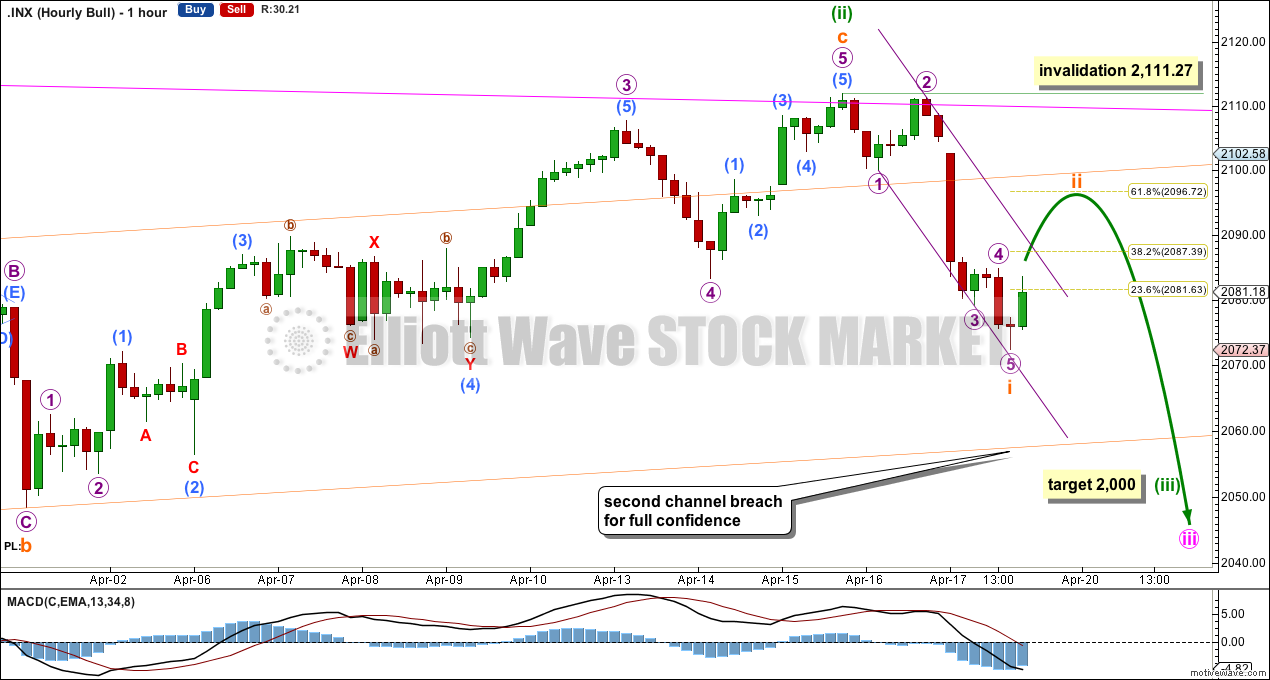
Within minuette wave (iii) subminuette wave i may have completed as a five wave impulse on Friday.
Ratios within subminuette wave i are: micro wave 3 is just 1.05 points longer than 2.618 the length of micro wave 1, and micro wave 5 is just 0.52 points longer than equality in length with micro wave 1.
Subminuette wave ii is incomplete and is likely to move price higher and / or sideways when markets open on Monday. It may end at either the 0.382 or 0.618 Fibonacci ratios of subminuette wave i. In this instance it is a second wave correction within a third wave one and two degrees higher, so it may be more shallow and brief than second waves usually are. The 0.382 Fibonacci ratio may be equally as likely as the 0.618 Fibonacci ratio for this reason.
Subminuette wave ii may not move beyond the start of subminuett wave i above 2,111.27. It is possible that it may be somewhat time consuming, enough to show up on the daily chart as one or more green candlesticks or doji.
When it is done then the S&P should move strongly lower as the middle of a third wave takes off.
A clear breach of the wider orange channel drawn about the whole of minuette wave (ii) would provide further confidence that a third wave down is underway.
Alternate Bullish Wave Count
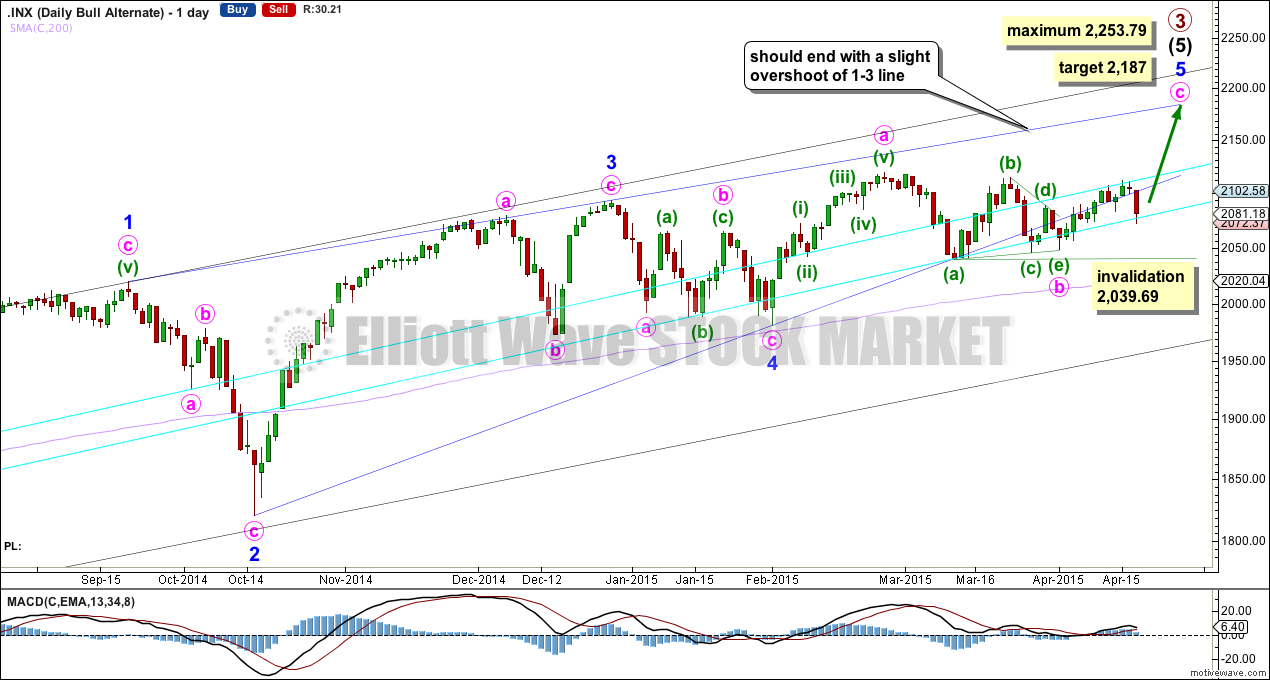
This alternate wave count is identical to the main wave count up to the low labelled minor wave 4. Thereafter, it sees minor wave 5 incomplete.
The lower 2-4 trend line of the contracting diagonal is now breached by three full daily candlesticks below it and not touching it. Diagonals normally adhere very well to their trend lines and this part of the wave count now looks wrong. The strong downwards candlestick for Friday further reduces the probability of this alternate, and it now looks quite ridiculous. I will keep publishing it though as a possible bullish alternate only because we just don’t have confirmation of a primary or cycle degree trend change yet.
This wave count is still technically possible but it has a very low probability. The breach of the 2-4 trend line is the only reason why this wave count is an alternate.
Within the triangle of minute wave b, if minuette wave (c) continues further it may not move beyond the end of minuette wave (a) below 2,039.69. If we see a new low below this point this week I will discard this alternate wave count.
It is at this stage that this alternate wave count diverges from the main wave count. A new high above 2,114.86 would increase the probability of this alternate, and if it is correct we should see that this week.
Bear Wave Count
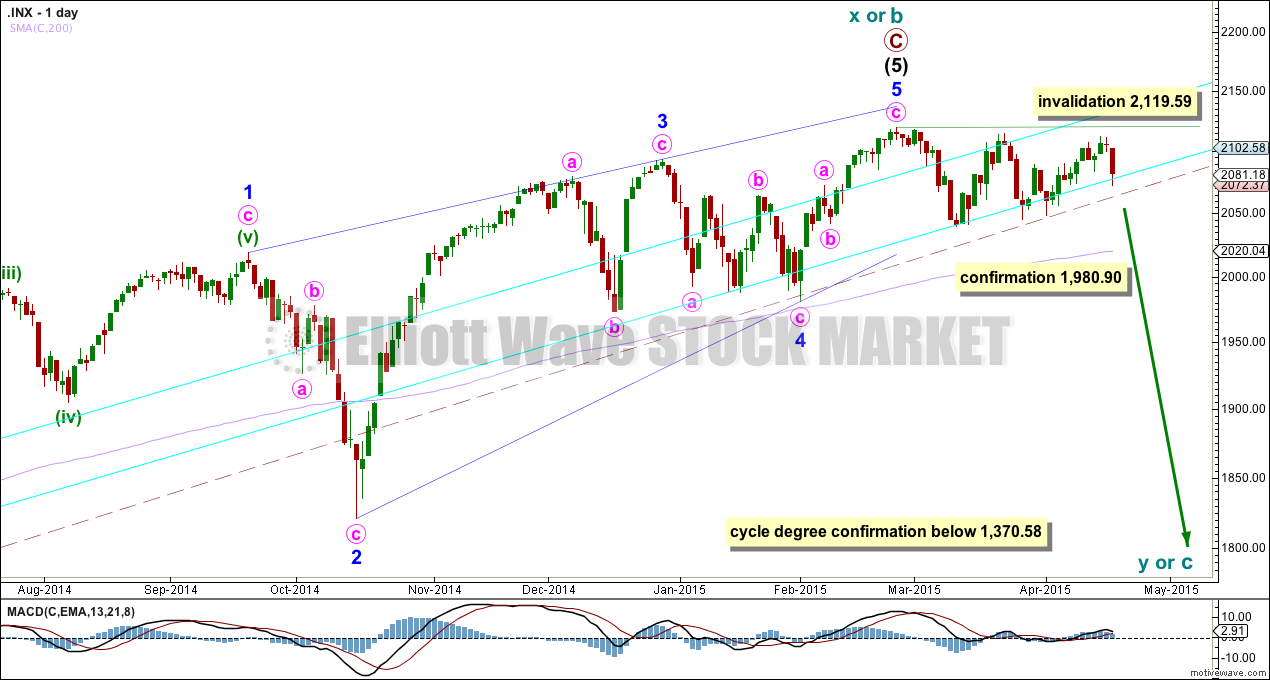
The subdivisions within primary waves A-B-C are seen in absolutely exactly the same way as primary waves 1-2-3 for the bull wave count. The alternate bull wave count idea also works perfectly for this bear wave count.
To see the difference at the monthly chart level between the bull and bear ideas look at the last historical analysis here.
At cycle degree wave b is over the maximum common length of 138% the length of cycle wave a, at 167% the length of cycle wave a. At 2,393 cycle wave b would be twice the length of cycle wave a and at that point this bear wave count should be discarded.
While we have no confirmation of this wave count we should assume the trend remains the same, upwards. This wave count requires confirmation before I have confidence in it. Full and final confirmation that the market is crashing would only come with a new low below 1,370.58. However, structure and momentum should tell us long before that point which wave count is correct, bull or bear.
This analysis is published about 11:39 p.m. EST.
Dead cat bounce ripping the heads of cohort shorting at the end of sub-minutette one down as is typical. Closed put spread at the pop and pouncing on beautiful set up for more downside…momentum down should be huge…
I agree, another deep second wave correction.
Not sure about calling this one a Dead Cat Bounce though, the duration of the downwards wave was only one day, it should be several, and the bounce is also only one day. (I’m taking the definition from “Technical Analysis” by Kirkpatrick and Dahlquist, page 371)
Everything else fits though. And volume for the up day was lower than the prior down day, as would be expected if the trend is now down.
There is a great risk / reward ratio set up here. I’m calculating the risk at 11 points, and the reward about 100 points to the downside.
Although, the more risk adverse amongst us may use the daily invalidation point at 2,119.59 so the risk is 19.19 points.