
Downwards movement was expected for the main Elliott wave count for Tuesday. This is what happened.
Summary: The main wave count requires downwards movement which must subdivide as an impulse and should show an increase in downwards momentum. The target for the next wave down is now 1,976 which may be met in either another four or seven sessions.
Click charts to enlarge.
Bullish Wave Count
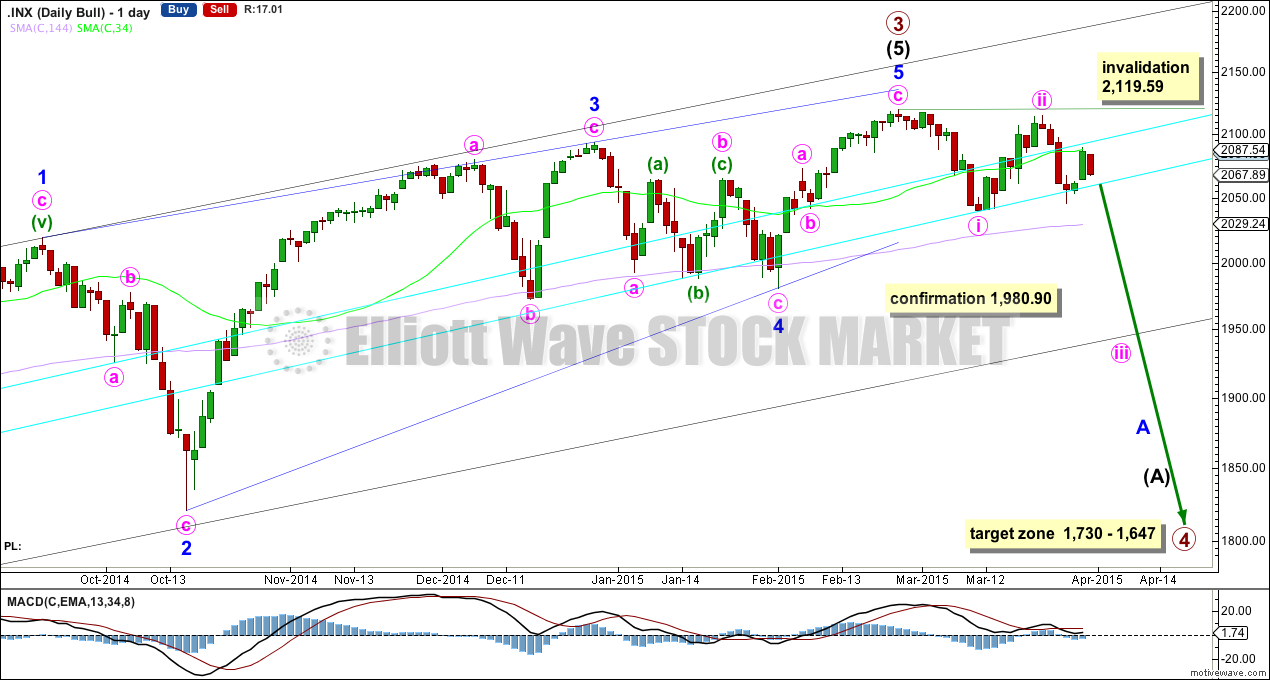
If primary wave 3 is over then primary wave 4 should begin. Upwards movement from the low at 666.79 subdivides now as a complete 5-3-5. For the bull wave count this is seen as primary waves 1-2-3. The wave count sees intermediate wave (5) as an ending contracting diagonal. Ending diagonals require all sub waves to be zigzags.
Primary wave 2 was a relatively shallow 0.41 zigzag lasting 12 weeks. Primary wave 4 may be more shallow and is most likely to be a flat, combination or triangle. It may be longer lasting than primary wave 2 as these types of sideways corrective structures tend to be more time consuming than zigzags. Primary wave 4 is likely to end in the price territory of the fourth wave of one lesser degree between 1,730 – 1,647. It may last about 13 or maybe even 21 weeks. So far it has started its fifth week.
To see a weekly chart and how to draw the aqua blue trend lines and the black channel, go here. Primary wave 4 should break below the black channel.
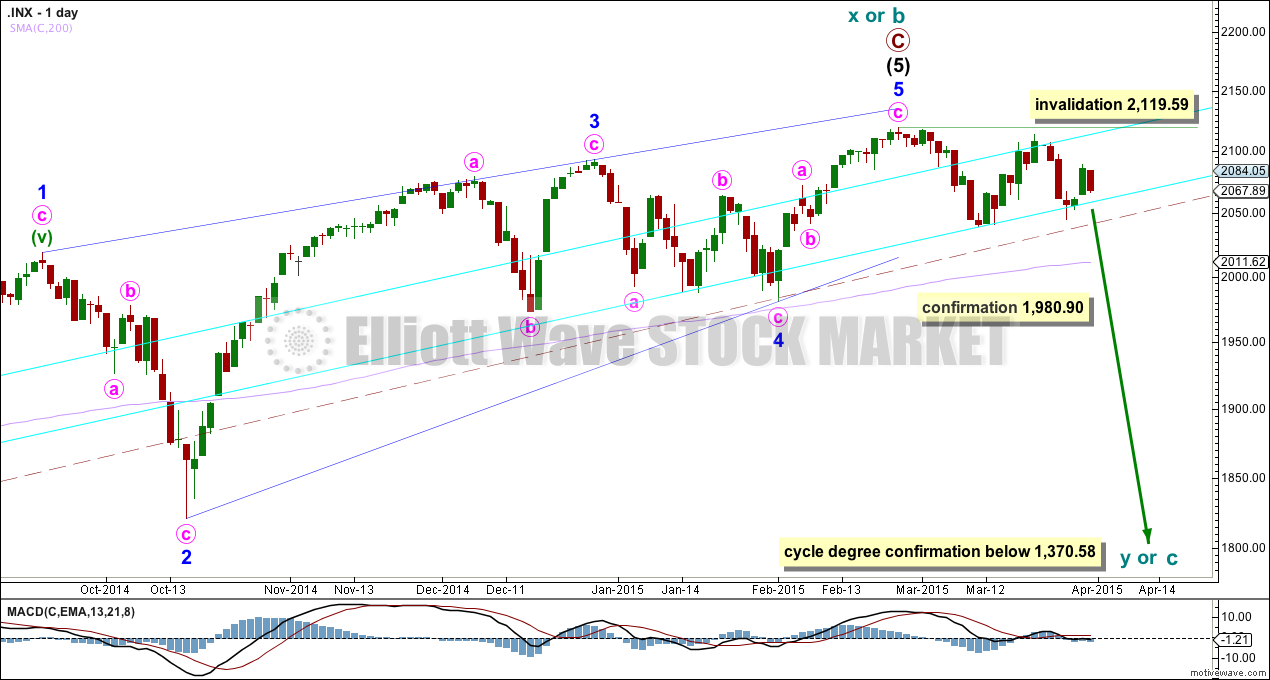
Primary wave 4 may not move into primary wave 1 price territory below 1,370.58. Invalidation of this bull wave count would provide full confidence in the bear wave count.
Because primary wave 4 may be an expanded flat, running triangle or double combination it may include a new high beyond its start at 2,119.59. If this happens the bear wave count would be invalidated.
There is triple (quadruple?) divergence with price and MACD at the weekly chart level supporting the idea of a trend change, either already or coming up soon.
A close at 1,990 or below would provide a close 3% of market value below the double aqua blue trend line, providing trend line confirmation of a sizeable trend change. I will only have confidence in this wave count when there is confirmation of this trend change.
A new low below 1,980.90 would provide further confirmation of a trend change.
Price is now below the 34 day SMA (which is about where price just found resistance) but remains above the 144 day SMA (I am playing with different time frames for moving averages and using Fibonacci numbers). A close below the longer 144 day SMA would add confidence in this trend change. A cross of the two moving averages with the 34 below the 144 day would also add confidence to this trend change. While we have neither this trend change remains unconfirmed.
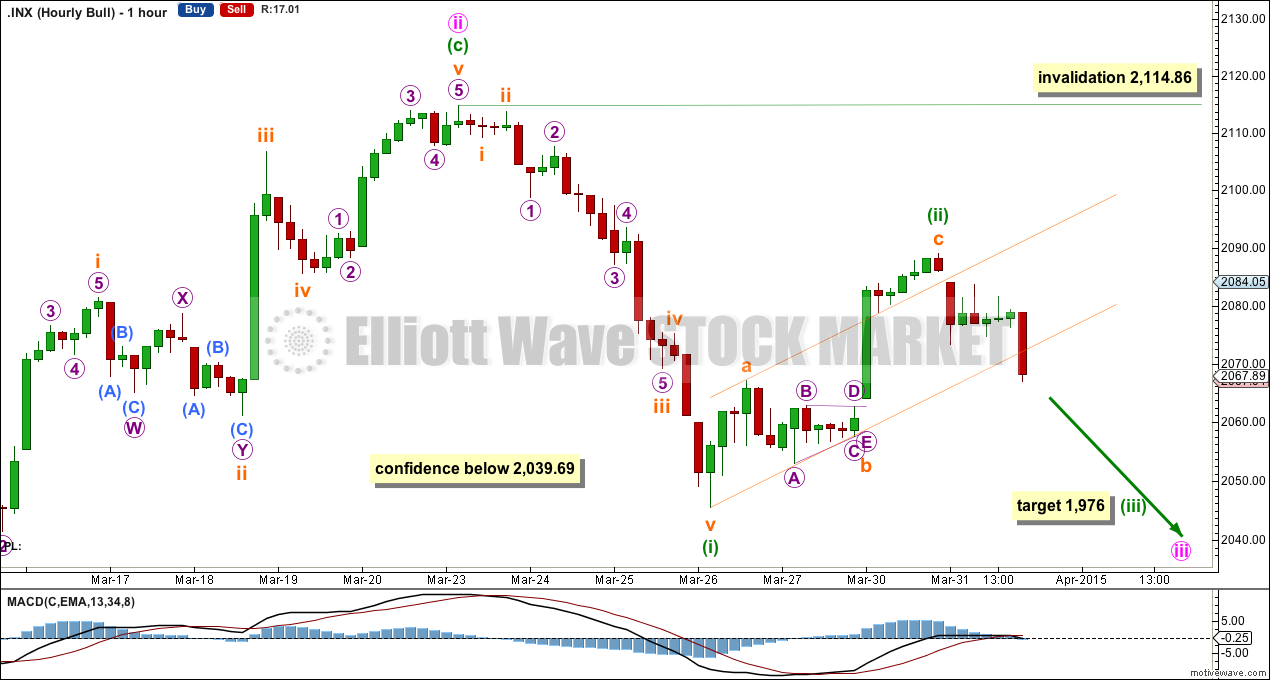
Minuette wave (ii) is a complete three wave structure ending close to the 0.618 Fibonacci ratio of minuette wave (i). The channel about minuette wave (ii) is overshot but not yet breached. One more full hourly candlestick below the lower orange trend line is required for a breach. That would provide confidence that minuette wave (ii) should be over.
At 1,976 minuette wave (iii) would reach 1.618 the length of minuette wave (i).
Completion of a small clear five down on the hourly chart would add confidence to this wave count. A new low below 2,039.69 would add a lot of confidence to this wave count and the target.
If minuette wave (ii) continues further as a double zigzag, flat or combination then it may not move beyond the start of minuette wave (i) above 2,114.86. It is possible that minuette wave (ii) could continue, but the probability is low. It looks to be nicely in proportion to minuette wave (i) and minute wave ii, if it is over here, and with it ending at the 0.618 Fibonacci ratio it is already a deep second wave.
This main wave count expects there is a very high probability of downwards movement continuing tomorrow, with an increase in downwards momentum.
Alternate Bullish Wave Count
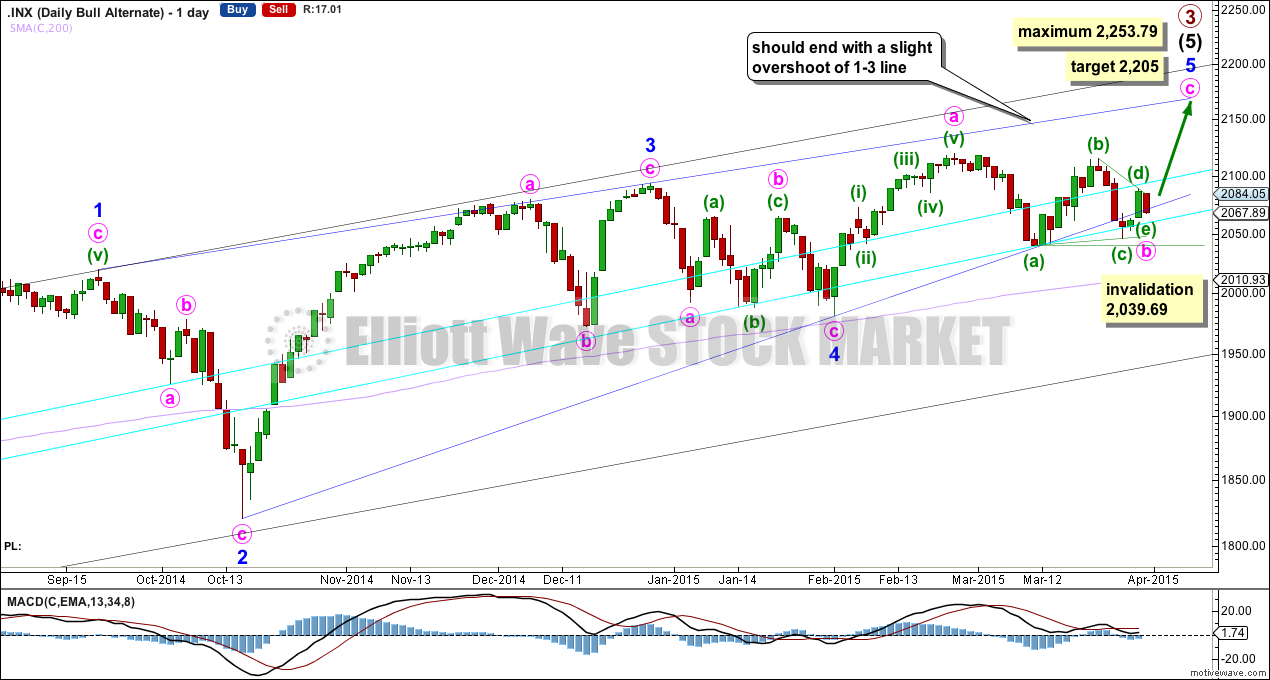
This alternate wave count is identical to the main wave count up to the low labelled minor wave 4. Thereafter, it sees minor wave 5 incomplete.
The lower 2-4 trend line of the contracting diagonal is now breached by one full daily candlestick below it and not touching it. Diagonals normally adhere very well to their trend lines and this wave count now looks wrong.
The breach is small. This wave count is still technically possible but it has substantially reduced in probability and must now be an alternate.
I am adjusting the labelling of minute wave b to see it as a complete regular contracting triangle. This resolves a problem with subdivisions on the hourly chart. Within the triangle, if minuette wave (c) continues further it may not move beyond the end of minuette wave (a) below 2,039.69.
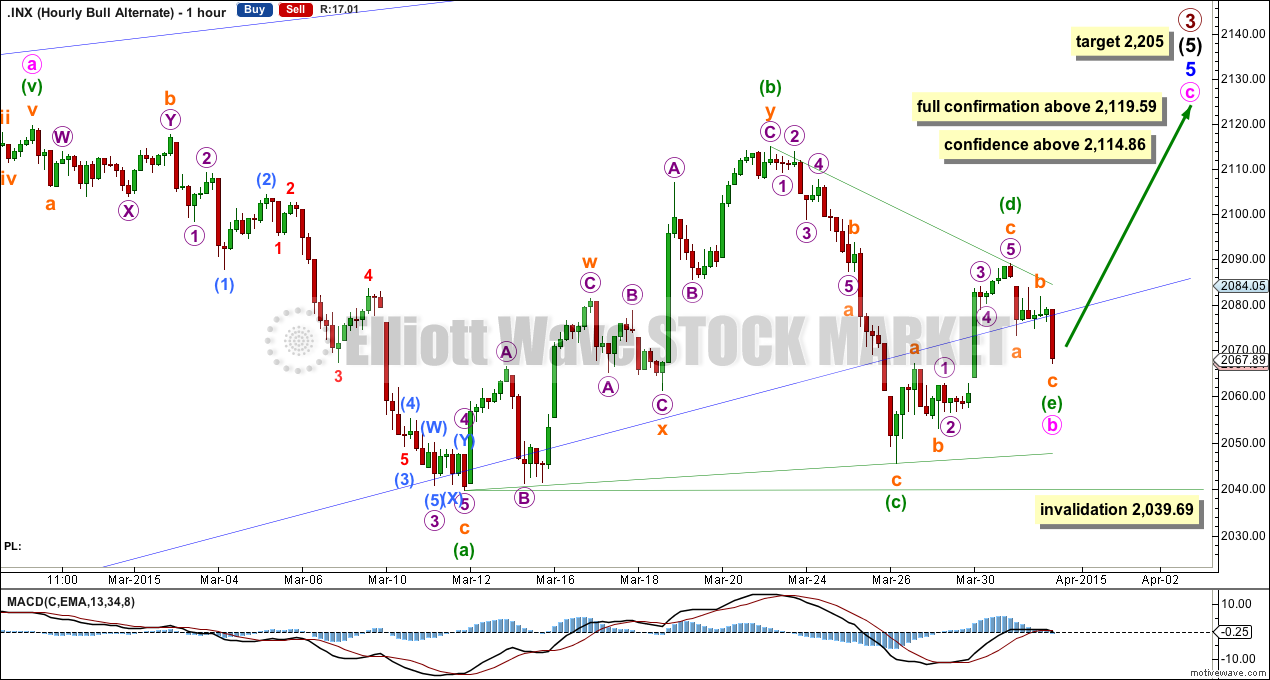
If minute wave b is seen as a triangle this resolves the problem I had with the upward wave labelled minuette wave (b). This movement may subdivide nicely as a double zigzag where previously I was trying to see it as a completed five wave impulse.
The triangle would be extremely likely to be over already. At 2,205 minute wave c would reach equality in length with minute wave a and the upper 1-3 blue trend line of the diagonal would be comfortably overshot.
If price rises from here and makes a new high above 2,114.86 this wave count must be seriously considered. It would be fully confirmed with a new high above 2,119.59.
Bear Wave Count
The subdivisions within primary waves A-B-C are seen in absolutely exactly the same way as primary waves 1-2-3 for the bull wave count. The alternate bull wave count idea also works perfectly for this bear wave count.
To see the difference at the monthly chart level between the bull and bear ideas look at the last historical analysis here.
At cycle degree wave b is over the maximum common length of 138% the length of cycle wave a, at 167% the length of cycle wave a. At 2,393 cycle wave b would be twice the length of cycle wave a and at that point this bear wave count should be discarded.
While we have no confirmation of this wave count we should assume the trend remains the same, upwards. This wave count requires confirmation before I have confidence in it. Full and final confirmation that the market is crashing would only come with a new low below 1,370.58. However, structure and momentum should tell us long before that point which wave count is correct, bull or bear.
This analysis is published about 07:36 p.m. EST.
I think you are right about micro four of subminuette 1 of minuette three. Considering what is probably coming, a multiple extension of the third down makes perfect sense. I think we will see a brief break to a new low tomorrow and a bounce…
Today definitely did not feel like a third of a third down. Could minuette (ii) be turning into an a-b-c correction? The end of today’s wave looks like a fourth wave triangle…looks like we will get a slight new low tomorrow with a bounce higher to end the week…
We could just be in micro wave 4 of subminuette wave 1 of minuette 3 down. That’s how I have it.
agreed assuming we get a low tomorrow below today’s low and preferably around 2040ish
It’s a very interesting setup. If that happens it could be a very strong move. The 100 day MA would have clearly given way, and it may break the neckline of a potential HNS type topping pattern on the hourly chart that projects down to 1940. The only support I can see is the BB at 2035 and the 200 day MA at 2012. Only problem with it is it looks a little too easy. But i’m going for it
Hi Lara. For the alternate, while the triangle for minute wave b is not invalidated yet, on the daily, it does appear to have another candlestick below the contracting diagonal. I’m hoping this setup is clearing the way for a higher probability of more and potentially stronger downside. Any thoughts on this?
I’m really concerned with another clear breach of that lower trend line. That wave count has substantially reduced in probability today.
I’ll publish the daily chart only for it, with the caveat that the probability is very low. It looks wrong.