
Upwards movement was expected for both Elliott wave counts.
Summary: Upwards movement may continue for three more sessions to reach 2,133. It is possible that it is over, but this has a lower probability.
Click charts to enlarge.
Bullish Wave Count
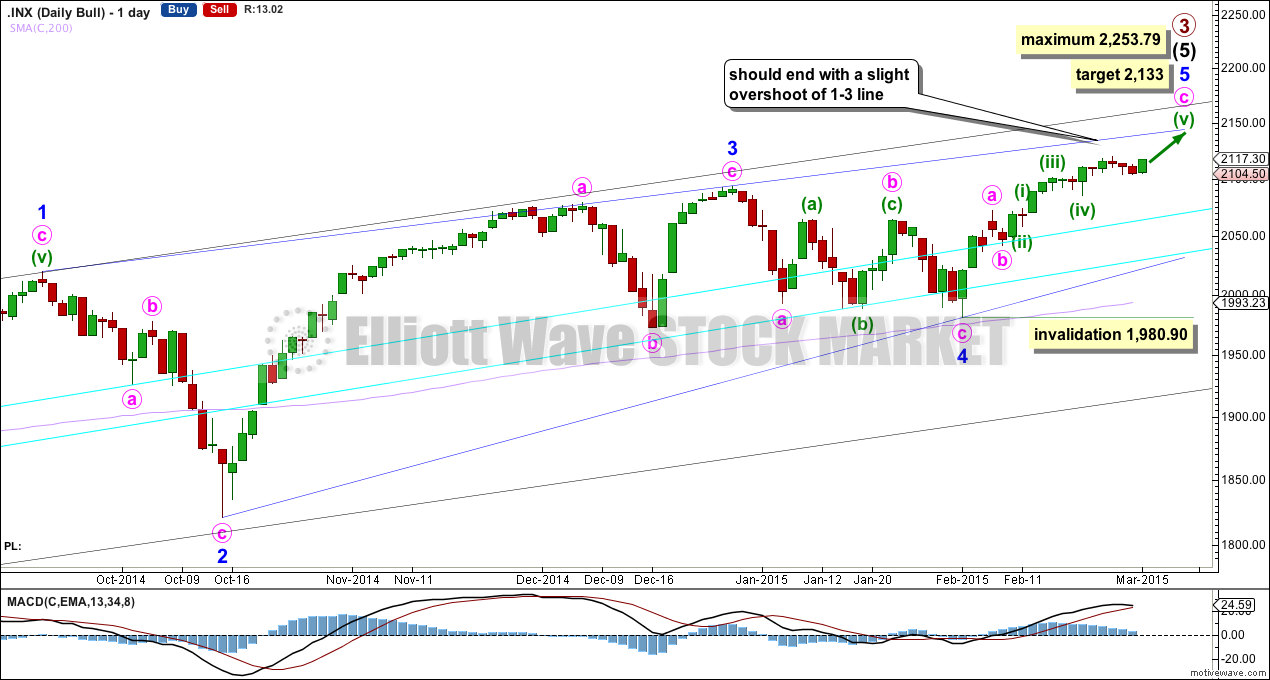
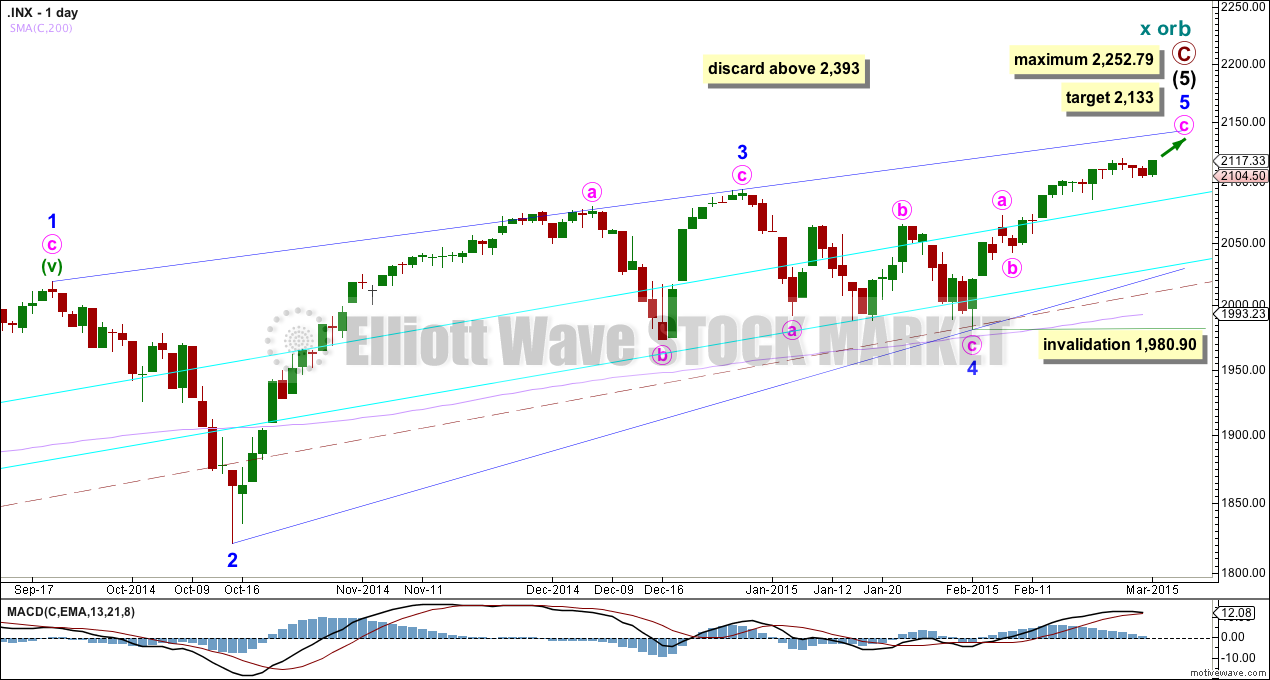
Upwards movement from the low at 666.79 subdivides as an incomplete 5-3-5. For the bull wave count this is seen as primary waves 1-2-3.
The aqua blue trend lines are traditional technical analysis trend lines. These lines are long held (the lower one has its first anchor in November, 2011), repeatedly tested, and shallow enough to be highly technically significant. When the lower of these double trend lines is breached by a close of 3% or more of market value that should indicate a trend change. It does not indicate what degree the trend change should be though. It looks like the last four corrections may have ended about the lower aqua blue trend line, which gives the wave count a typical look. To see a weekly chart where I have drawn these trend lines go here.
The wave count looks at intermediate wave (5) as an ending contracting diagonal. Ending diagonals require all sub waves to be zigzags. So far this is a perfect fit. Minor wave 3 has stronger momentum than minor wave 5 on the daily chart.
The diagonal is contracting. The only problem with this possibility is that minor waves 2 and 4 are more shallow than second and fourth waves within diagonals normally are. In this case they may have been forced to be more shallow by support offered from the double aqua blue trend lines.
Because the third wave within the contracting diagonal is shorter than the first wave and a third wave may never be the shortest wave, this limits the final fifth wave to no longer than equality with the third wave at 2,253.79.
Within intermediate wave (5) minor wave 1 lasted 238 days (5 days longer than a Fibonacci 233), minor wave 2 lasted 18 days (2 short of a Fibonacci 21), minor wave 3 lasted 51 days (4 short of a Fibonacci 55) and minor wave 4 lasted 23 days (2 longer than a Fibonacci 21). While none of these durations are perfect Fibonacci numbers, they are all reasonably close. So far minor wave 5 has lasted 18 days and the structure is incomplete. If it continues for another three sessions it may total a Fibonacci 21
Within minor wave 5 minute wave b may not move beyond the start of minute wave a below 1,980.90. This invalidation point allows for the possibility that minute wave a is incomplete and minute wave b is yet to unfold, although this idea does not fit with momentum on the hourly chart.
At 2,133 minute wave c would reach equality in length with minute wave a.
Contracting diagonals normally have fifth waves which end with a slight overshoot of the 1-3 trend line. Because this is such a common tendency I will still expect more upwards movement to see this trend line overshot. It is possible that the fifth wave is over already, but this would look less common.
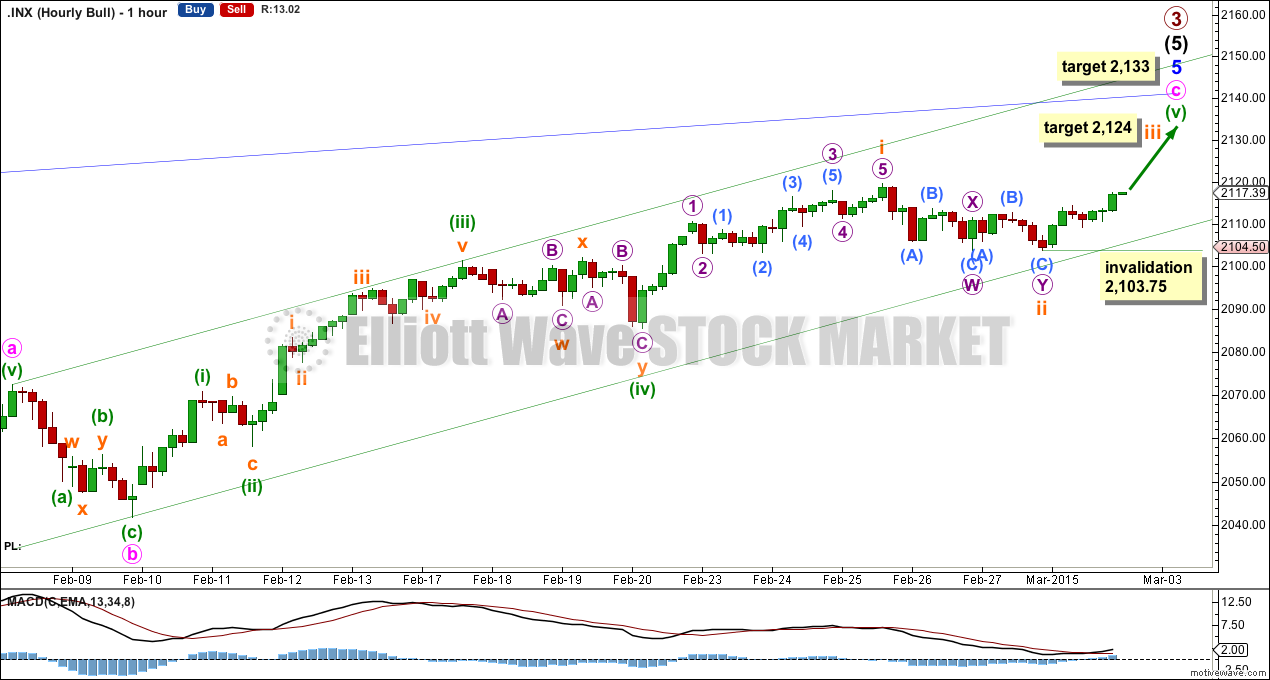
I am adjusting the labelling of the subdivisions on the hourly chart, but it makes no difference to the expected direction, final target or invalidation point. The wave count now has better proportions.
Within minute wave c minuette waves (i) through to (iv) may be complete. Minuette wave (iii) is 3.58 short of 1.618 the length of minuette wave (i). I wouldn’t expect to see a Fibonacci ratio for minuette wave (v) to either of (i) or (iii) so I leave the target calculation at minute degree only.
Within minuette wave (v) subminuette waves i and now ii may be complete. Subminuette wave iii may have begun on Monday. At 2,124 subminuette wave iii would reach 0.618 the length of subminuette wave i. This fits nicely with the target at 2,133 where minute wave c would reach equality in length with minute wave i.
Within subminuette wave iii no second wave correction may move beyond its start below 2,103.75.
Alternate Bull Wave Count
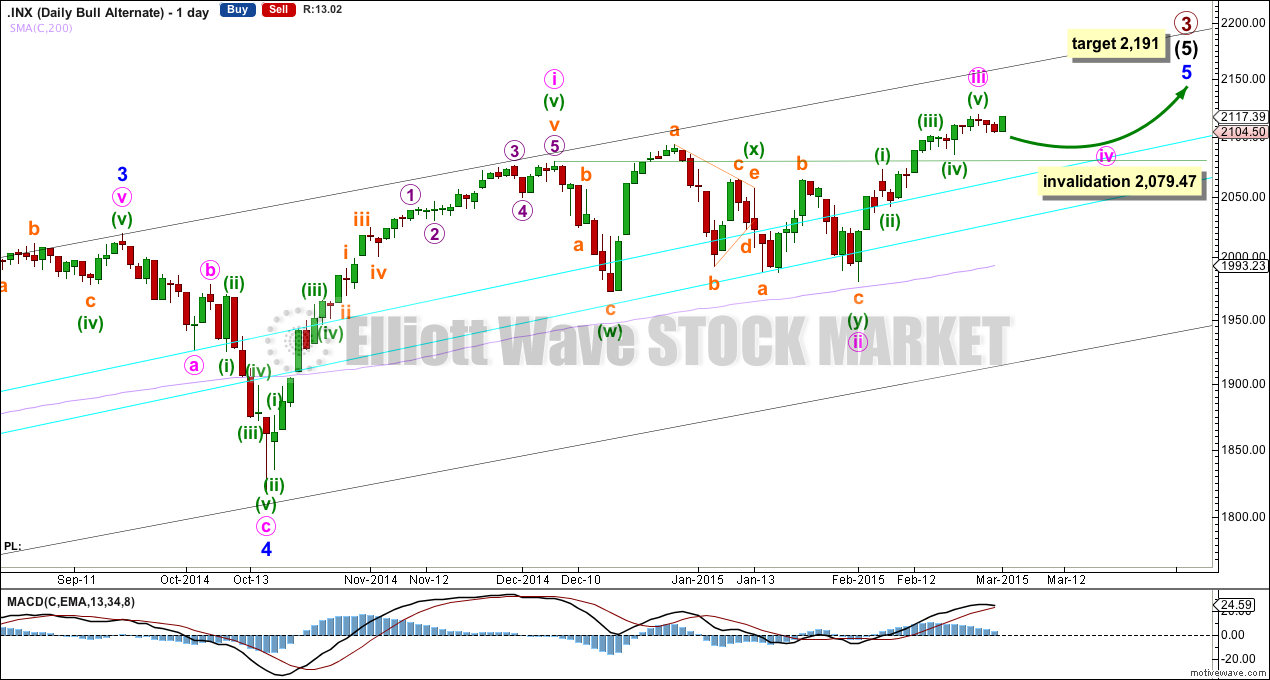
This wave count is an alternate because it does not fit well with momentum at either the daily or the hourly chart levels.
Within intermediate wave (5) minor wave 3 has weaker momentum than minor waves 1 and 5. This is opposite to how it should behave. However, at the weekly chart level minor wave 3 has stronger momentum than minor wave 5 so this could still fit.
At 2,191 primary wave 3 would reach 1.618 the length of primary wave 1. This would expect that within minor wave 5 minute wave iii will be shorter than minute wave i, and minute wave v will be shorter still, which would be a repeat of the pattern seen within minor wave 1. Or the target is wrong.
It is possible to see minute wave iii over. It has no Fibonacci ratio to minute wave i.
If minute wave iii is over then the final target at 2,191 would be too high. When minute wave iv is complete I can calculate the maximum upwards length for this wave count. Because minute wave iii is shorter in length to minute wave i, minute wave v is limited to no longer than equality in length to minute wave iii so that the core Elliott wave rule stating a third wave may not be the shortest is met.
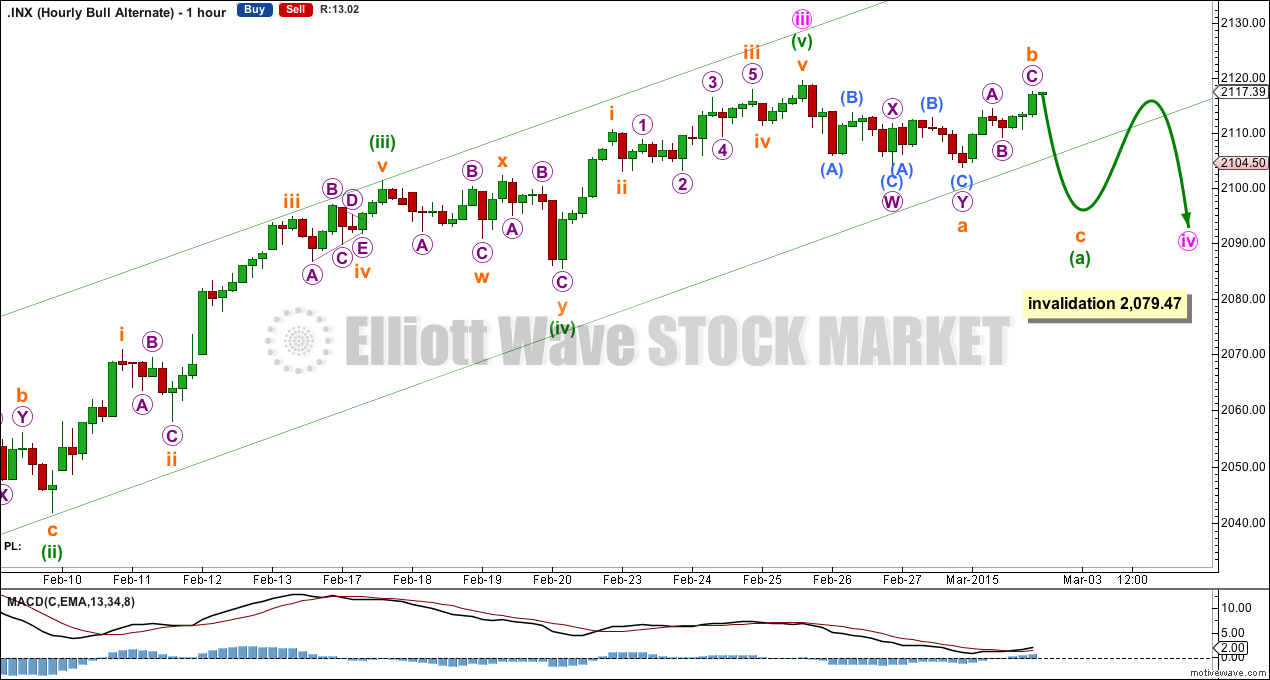
It is possible that minute wave iii is complete. Minute wave iv may have begun. I am moving the degree of labelling within minute wave iv down one degree today.
Minute wave ii was a shallow combination. Minute wave iv may be a flat or triangle, and so far it looks unlikely to be a zigzag. A flat or triangle would still provide alternation with a combination.
Within minute wave iv it is more likely that minuette wave (a) is an incomplete flat correction. There is no upper invalidation point for this idea, and within the flat subminette wave b may make a new high above the start of subminuette wave a at 2,119.59 as in an expanded flat.
This alternate expects to see choppy overlapping movement for several more days as a correction unfolds.
Minute wave iv may not move into minute wave i price territory below 2,079.47.
Bear Wave Count
The subdivisions within primary waves A-B-C are seen in absolutely exactly the same way as primary waves 1-2-3 for the bull wave count. The alternate bull wave count idea also works perfectly for this bear wave count.
To see the difference at the monthly chart level between the bull and bear ideas look at the last historical analysis here.
At cycle degree wave b is over the maximum common length of 138% the length of cycle wave a, at 167% the length of cycle wave a. At 2,393 cycle wave b would be twice the length of cycle wave a and at that point this bear wave count should be discarded.
While we have no confirmation of this wave count we should assume the trend remains the same, upwards. This wave count requires confirmation before I have confidence in it.
This analysis is published about 05:37 p.m. EST.