
Upwards movement was expected. Price moved sideways in a small range.
Summary: I expect more upwards movement to 2,133. This may end in three days.
Click charts to enlarge.
Bullish Wave Count
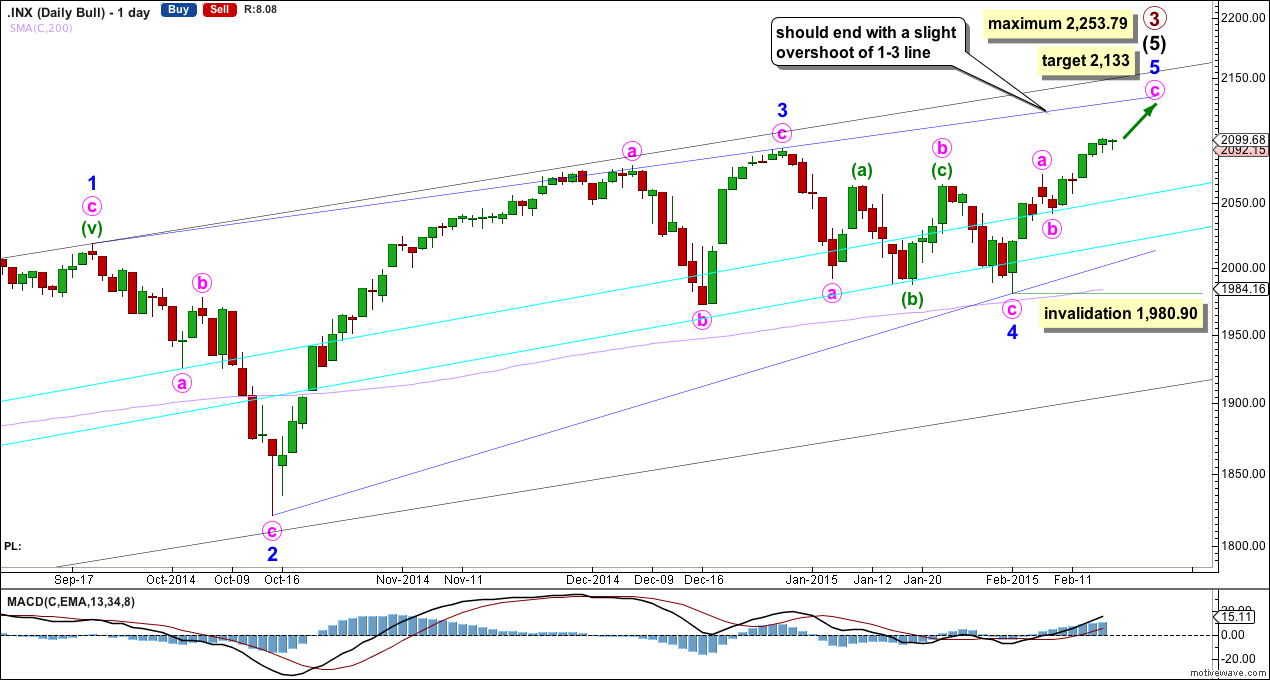
Upwards movement from the low at 666.79 subdivides as an incomplete 5-3-5. For the bull wave count this is seen as primary waves 1-2-3.
The aqua blue trend lines are traditional technical analysis trend lines. These lines are long held (the lower one has its first anchor in November, 2011), repeatedly tested, and shallow enough to be highly technically significant. When the lower of these double trend lines is breached by a close of 3% or more of market value that should indicate a trend change. It does not indicate what degree the trend change should be though. It looks like the last four corrections may have ended about the lower aqua blue trend line, which gives the wave count a typical look. To see a weekly chart where I have drawn these trend lines go here.
I have pulled the upper trend line down a little to touch the low of minute wave a within minor wave 4. This may be a better position for recent movement.
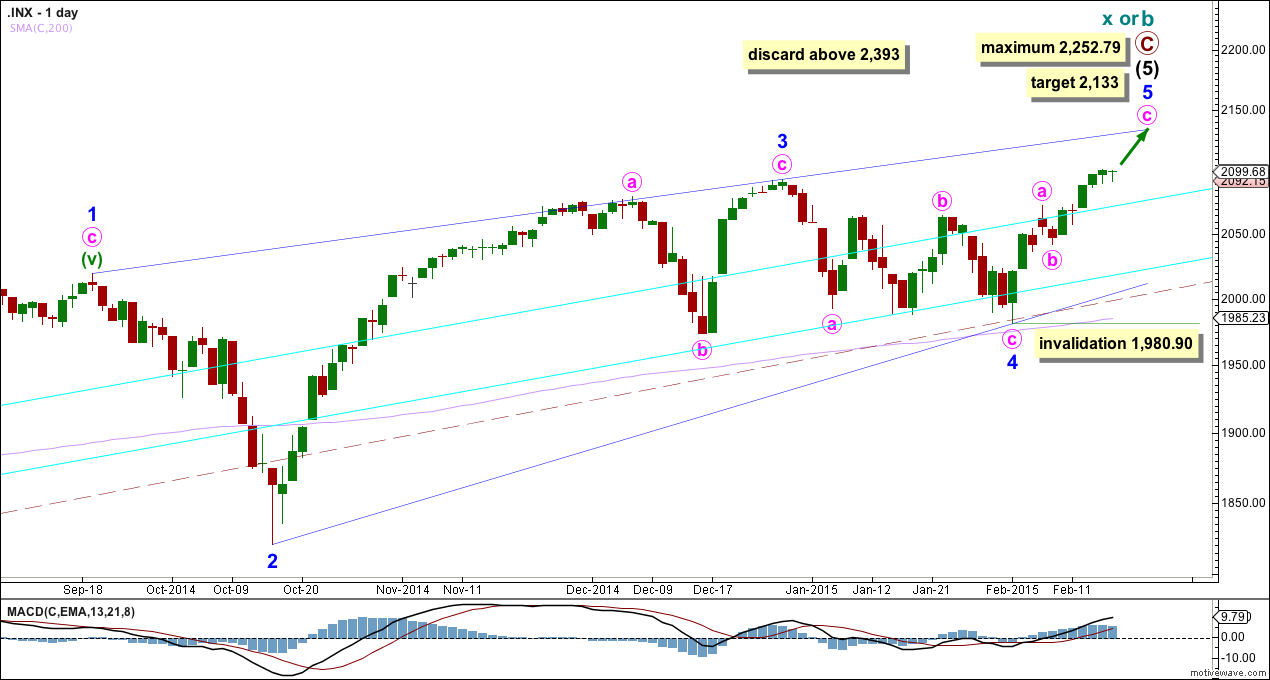
The wave count looks at intermediate wave (5) as an ending contracting diagonal. Ending diagonals require all sub waves to be zigzags. So far this is a perfect fit. Strongest momentum on the daily chart is within minor wave 3.
The diagonal is contracting. The only problem with this possibility is that minor waves 2 and 4 are more shallow than second and fourth waves within diagonals. In this case they may have been forced to be more shallow by support offered from the double aqua blue trend lines.
Because the third wave within the contracting diagonal is shorter than the first wave and a third wave may never be the shortest wave, this limits the final fifth wave to no longer than equality with the third wave at 2,253.79.
Within intermediate wave (5) minor wave 1 lasted 238 days (5 days longer than a Fibonacci 233), minor wave 2 lasted 18 days (2 short of a Fibonacci 21), minor wave 3 lasted 51 days (4 short of a Fibonacci 55) and minor wave 4 lasted 23 days (2 longer than a Fibonacci 21). While none of these durations are perfect Fibonacci numbers, they are all reasonably close. Minor wave 5 may end in a total Fibonacci 13 days, give or take one day either side of this number. So far it has lasted 9 days.
Within minor wave 5 minute wave b may not move beyond the start of minute wave a below 1,980.90.
At 2,133 minute wave c would reach equality in length with minute wave a.
Contracting diagonals normally have fifth waves which end with a slight overshoot of the 1-3 trend line.
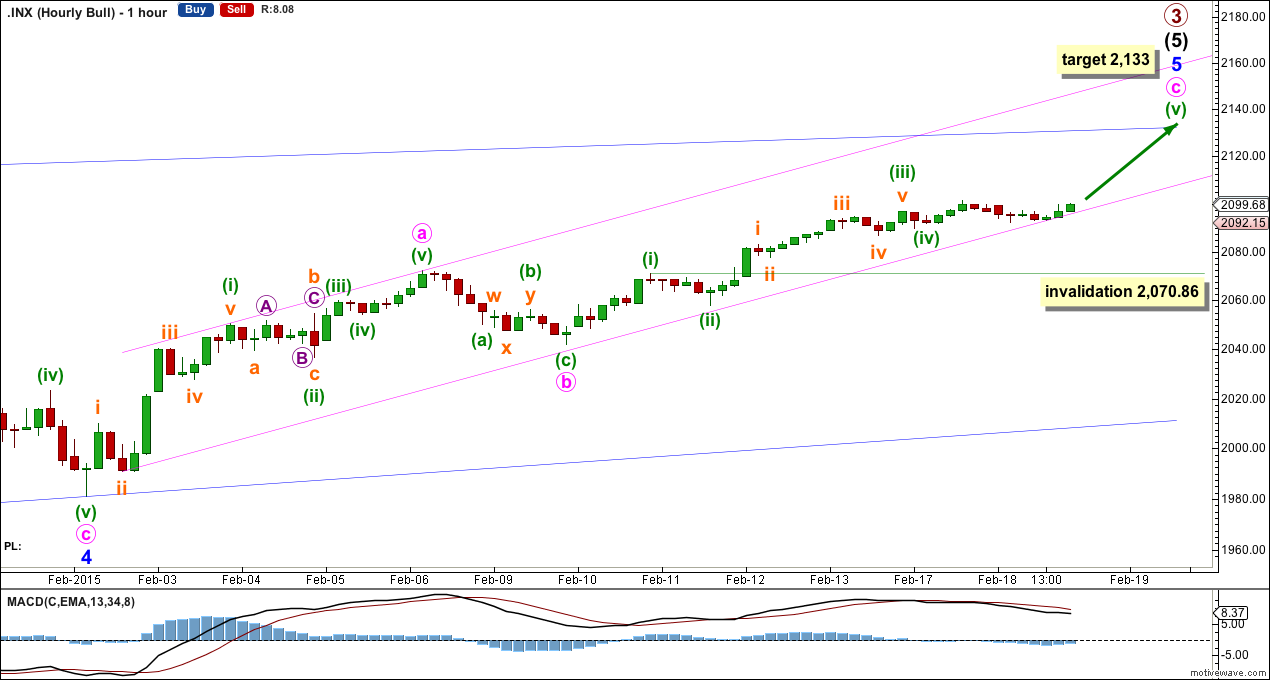
This wave count fits better with momentum on the hourly chart. Minute wave c is showing divergence with minute wave a. At 2,133 minute wave c would reach equality in length with minute wave a.
It is difficult to draw a channel about this upwards movement. The channel drawn is a best fit, but I don’t have confidence it will work to show us where downwards movement should find support along the way up.
Because it is extremely likely that minor wave 5 will end either at the blue 1-3 trend line, or more likely with a small overshoot of it, I do not think upwards movement is over yet. The structure does not yet have a typical look.
If minuette wave (iv) were to continue further as a double or maybe a triangle, it may not move back into minuette wave (i) price territory below 2,070.86.
If minor wave 5 exhibits a Fibonacci duration it may end in another three days to total a Fibonacci 13.
Alternate Bull Wave Count
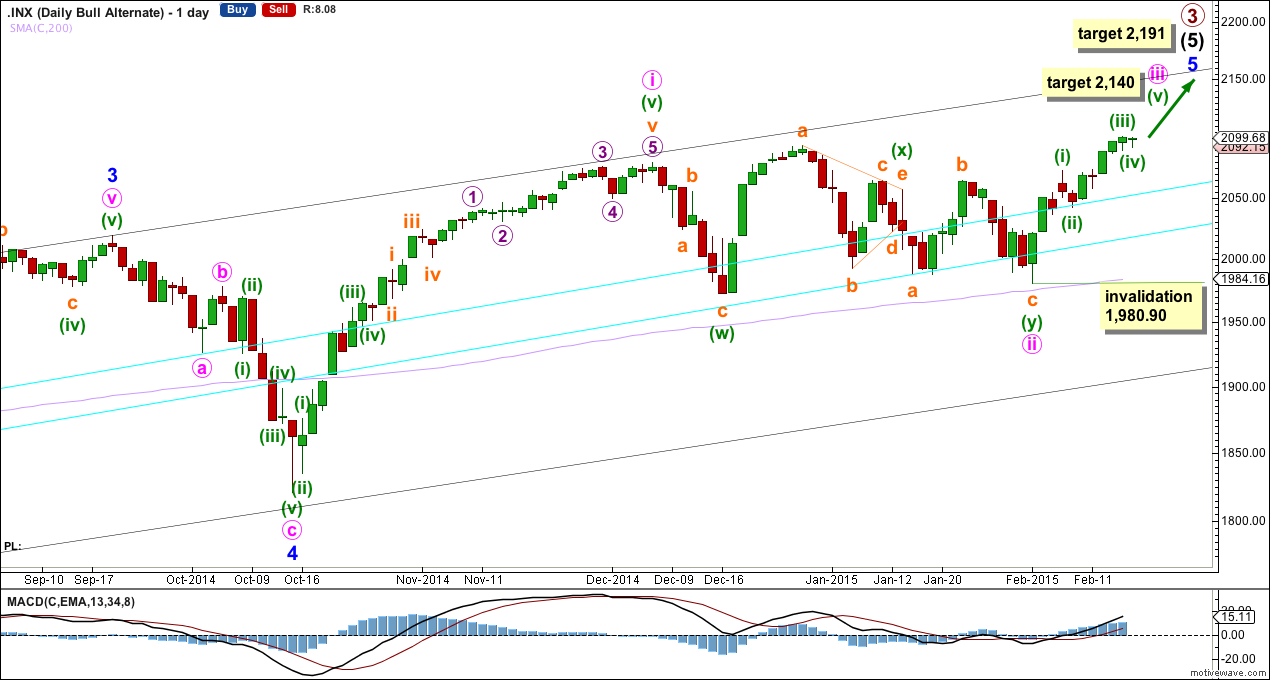
This wave count is an alternate because it does not fit well with momentum at either the daily or the hourly chart levels.
Within intermediate wave (5) minor wave 3 has weaker momentum than minor waves 1 and 5. This is opposite to how it should behave. However, at the weekly chart level minor wave 3 has stronger momentum than minor wave 5 so this could still fit.
At 2,191 primary wave 3 would reach 1.618 the length of primary wave 1. This would expect that within minor wave 5 minute wave iii will be shorter than minute wave i, and minute wave v will be shorter still, which would be a repeat of the pattern seen within minor wave 1. Or the target is wrong.
At 2,140 minute wave iii would reach 0.618 the length of minute wave i.
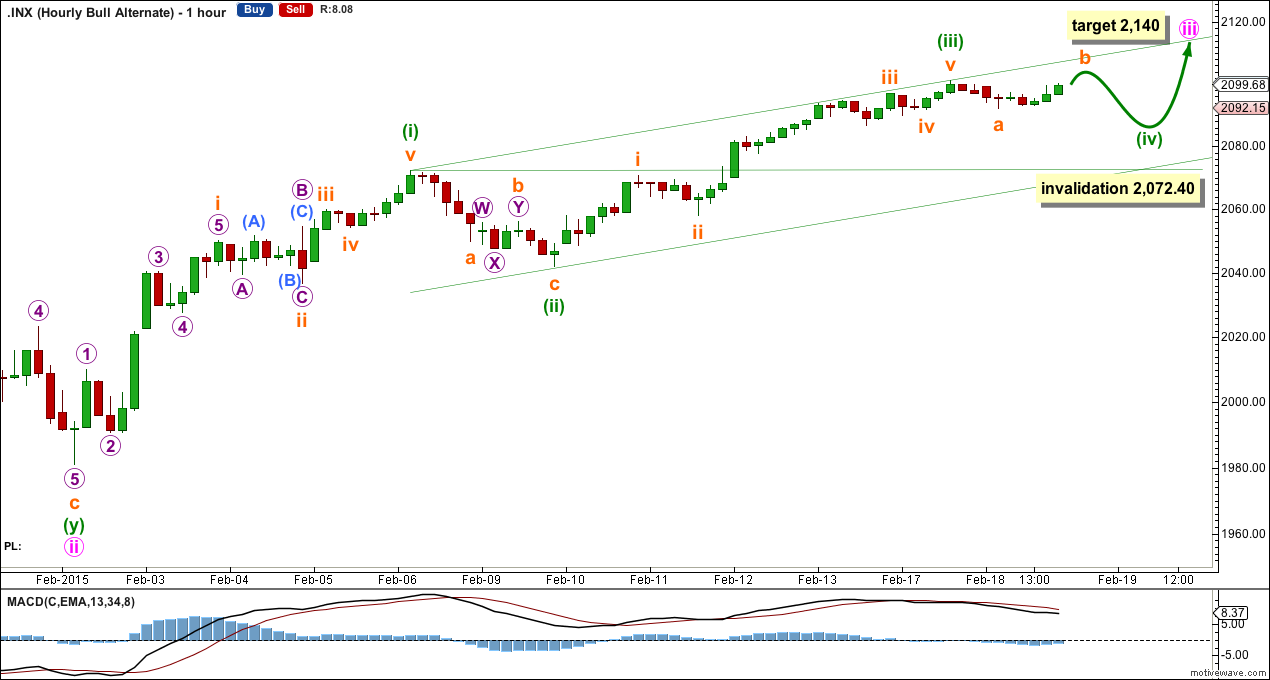
The channel drawn here using Elliott’s first technique may be a better fit for this movement. Draw the first trend line from the ends of minuette waves (i) and (iii), then place a parallel copy on the low of minuette wave (ii).
Minuette wave (ii) was a shallow 0.33 zigzag lasting 12 hours and showing on the daily chart as one red doji. Minuette wave (iv) is most likely to be a flat, triangle or combination, which are all more time consuming corrections than zigzags so it may last longer than 12 hours. It may be more shallow than minuette wave (ii).
Minuette wave (iv) may not move into minuette wave (i) price territory below 2,072.40.
Bear Wave Count
The subdivisions within primary waves A-B-C are seen in absolutely exactly the same way as primary waves 1-2-3 for the bull wave count. The alternate bull wave count idea also works perfectly for this bear wave count.
To see the difference at the monthly chart level between the bull and bear ideas look at the last historical analysis here.
At cycle degree wave b is over the maximum common length of 138% the length of cycle wave a, at 165% the length of cycle wave a. At 2,393 cycle wave b would be twice the length of cycle wave a and at that point this bear wave count should be discarded.
While we have no confirmation of this wave count we should assume the trend remains the same, upwards. This wave count requires confirmation before I have confidence in it.
This analysis is published about 09:03 p.m. EST.
when (not if because it will happen eventually) the market falls it will be swift I am reasonably sure.
the corrections, larger ones that is, do tend to be faster than the rises.
I have been thinking for a few weeks that the ending diagonal was likely the correct pattern; especially since we also saw very shallow second and fourth waves on the prior one. Ending diagonals are notorious for the swiftness and violence of their reversals and tend to retrace to their orgin. A key reversal day at the upside target range might again signal the start of the fireworks, especially if it happens at the usual 1 3 trend line overshoot…any thoughts…?